Abstract
The majority of bioactive principles in a complex matrix such as natural products and botanical medicines are secondary rather than primary metabolites. In addition to being chemically diverse, the bioactivity of an ethnobotanical can comprise from one to several bioactive compounds, present in a complex mixture. Conventional discovery efforts utilize bioassay-guided fractionation (BGF) to isolate individual active compounds. When applied to complex natural products, BGF is often challenged by an apparent loss of activity during fractionation, resulting in weakly active isolated compounds. Metabolomic analysis can potentially complement existing the BGF paradigm by capturing the chemical complexity of the metabolites. The proposed biochemometric approach establishes a link between the chemistry of a secondary metabolome and a deserved health impact, using a high-throughput, high-resolution capable biological endpoint. The proof of principle is demonstrated for the anti-tuberculosis (TB) activity of the Alaskan ethnobotanical, Oplopanax horridus. Biochemometric analysis identified the 100 most active constituents from thousands of metabolites in the active extract by means of 2D orthogonal chromatography using countercurrent and GC-MS methods. Previously isolated O. horridus phytoconstituents were used as reference markers of known structure and bio(in)activity. Positive correlations allowed distinction of anti-TB actives from inactive compounds. A total of 29 bioactives from 3 main structural classes were assigned based on MS data. Biochemometric analysis is a new tool for the standardization of herbal medicines and ethnobotanicals, as well as for drug discovery from nature. The method can assign multiple active compounds in complex mixtures without their prior isolation or structure elucidation, while still providing an interface to structural information.
Keywords: Biochemometrics, Biochromatogram, Natural products standardization, Countercurrent separation, Synergy, Bioactive principles
1 Introduction
One major characteristic of complex natural products is their diversity of secondary metabolites [1, 2], which co-exist with the complex primary metabolome of the living world. In addition, particularly in plants, nature frequently associates metabolite diversity with a highly complex matrix (“background”), which challenges metabolomic analysis. The role of plants as a drug discovery source has been increasingly acknowledged in terms of bioactive (ethno)botanicals and complementary medicines [3, 4]. Thus, it is increasingly observed that multiple active principles exist for any given biological activity of a medicinal plant. Complicating the subject matter further, an extract with moderate activity may only contain relatively large quantities of few moderately active major constituents, or to the contrary, small amounts of several highly active constituents. Concurrently, synergistic interactions need to be considered when quantitatively assessing the potency of crude natural extracts or subsequent fractions [5–9]. While the isolation and characterization of individual active compounds are key operations in the evaluation of biologically active mixtures, they require time-consuming and demanding work. Bioassay-guided fractionation (BGF) is a widely accepted, state-of-the-art process for the isolation of the active principles. As recently shown, a biochromatogram can be an effective guidance tool during BGF procedures, which is aimed at locating active principles in a complex mixture of secondary phytometabolites (see [10] and references within). However, because isolation of all active (trace) compounds can become an overwhelming task, BGF may or may not be suitable for a mixture of phytoconstituents, especially when synergistic effects exist among multiple active principles. Another pitfall for many BGF approaches is the potential loss of activity due to irreversible adsorption to the solid phase of chromatograph during the separation. Thus, new methods capable of coping with complex mixtures of unknown active compounds in crude bioactive natural products are sorely needed.
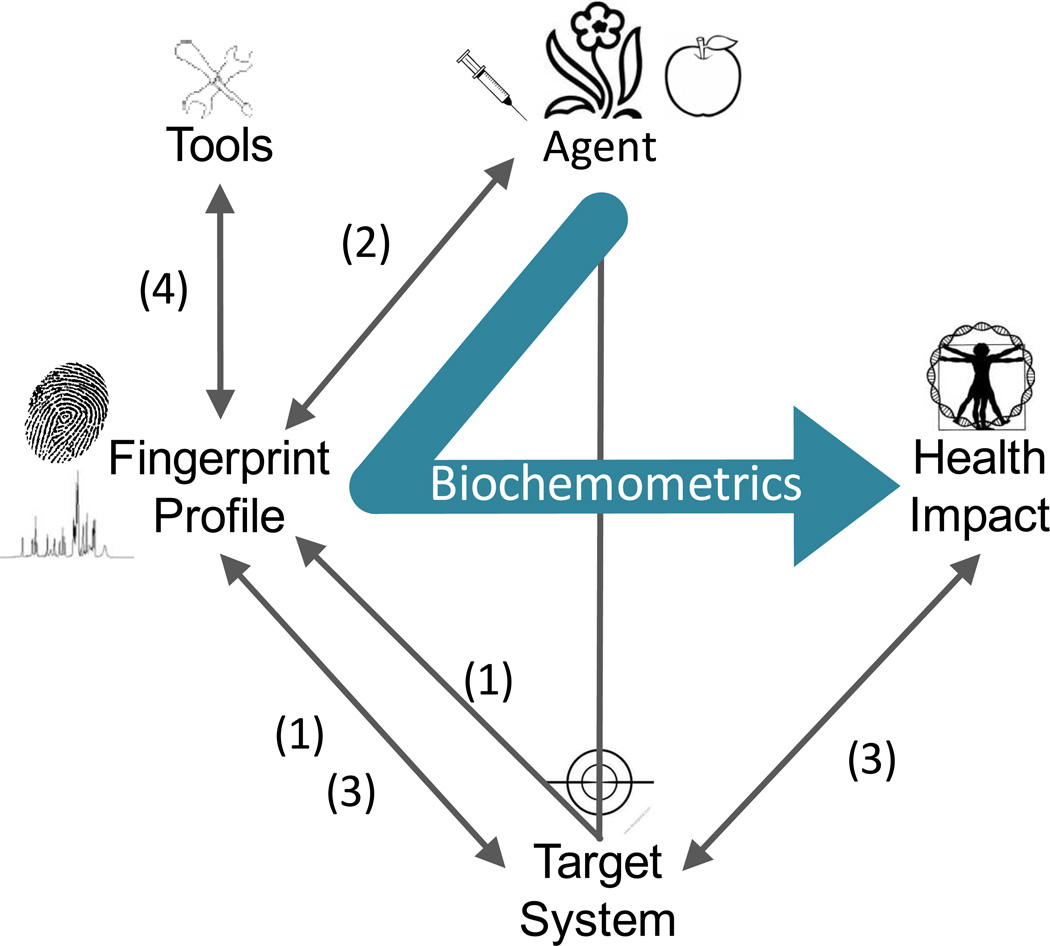
The main objective of current metabolomics research is the assessment of complex metabolite mixtures and building of methodologies for biological identification by chemical profiling and fingerprinting; disease diagnosis using body fluids; and identification of metabolic pathways. Based on a comprehensive survey of the literature, and reflected by the reporting standards for metabolomics [11], metabolomics research has four foci, three of which are biological (Fig. 1). Numerous reports have spectrometrically measured and interpreted changes in primary metabolites that are associated with the biological endpoints of the target species (#1, Fig. 1). Another aim, mainly of mammalian studies, is the investigation of the influence of drug and food administration on the primary metabolome in organs, plasma and urine (#1, Fig. 1). The majority of plant studies concern the identification of principal constituents of known types of analytes, e.g., for the differentiation of wine types (#2, Fig. 1). While this approach is potentially useful for identification of active principles in a complex extract/plant matrix especially when combined with high throughput bioassay, challenge remains for ethnobotanicals where it is hard to obtain multiple samples from different sources and/or time points to provide enough variation to create statistically significant differences among the samples. In the areas of cell culture and microbiology, and in particular with the advent of systems biology, an emerging number of studies report on biodiversity, metabolite pathway, and fluxomics (#3, Fig. 1). The fourth focus is the development of tools for metabolomics (Fig. 1, #4) and this predominantly covers chemical, statistic and metric aspects.
Fig. 1.
Graphical representation of the study aim, in the context of contemporary metabolomics research (see also introduction): (1) Mammalian studies, including clinical research and nutrigenomics; (2) plant studies, (3) cell culture and microbiologic studies, (4) tool development. The proposed biochemometric approach establishes a new metabolomic link between a complex intervention material, such as a natural product with a complex matrix, and a potential health impact, represented by a measurable biological endpoint.
Metabolomic methods capable of targeting and identifying a group of unknown secondary, rather than primary, metabolites that are responsible for a certain biological effect in the target organism (bold connection in Fig. 1) are in high demand. To this end, we propose a method, termed biochemometrics, which enables the assignment of biologically active constituents, both structurally known and unknown, in complex natural product mixtures without the risk of losing actives during the separation. The method consists of four steps:
-
Step 1:
High-resolution preparative fractionation of the complex metabolomic mixture, e.g., ethnobotanical crude extract, by countercurrent chromatography (CCC);
-
Step 2:
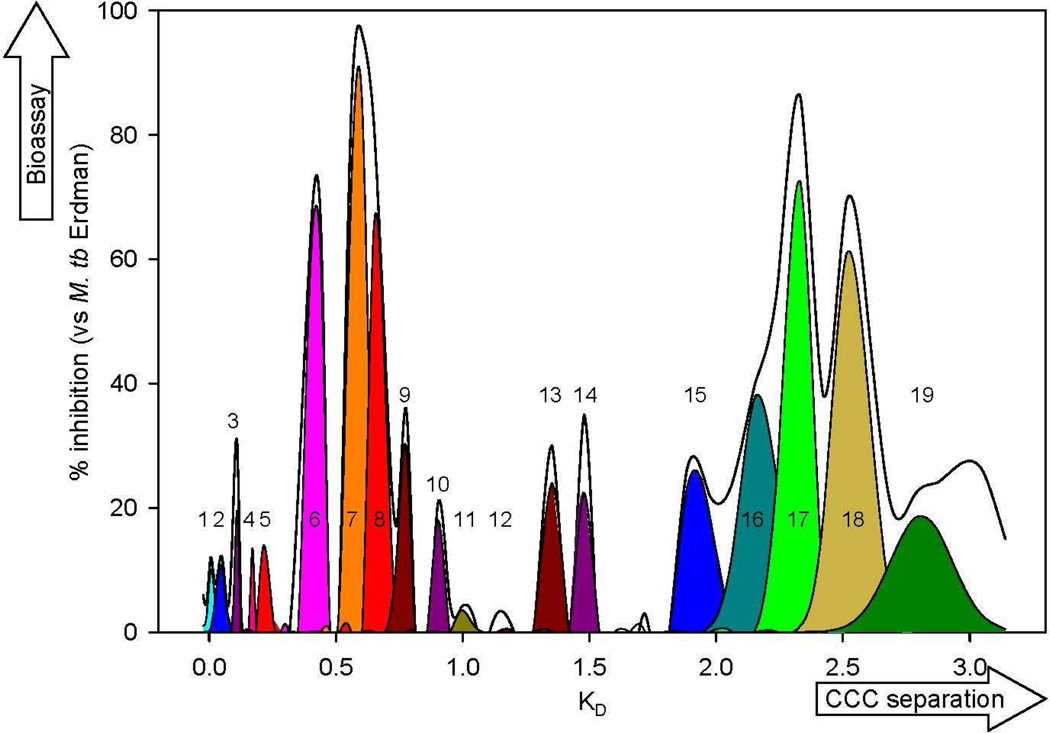
In vitro biological evaluation of all resulting fractions and generation of a high-resolution biochromatogram, derived from the high-resolution CCC fractions (Fig. 2);
-
Step 3:
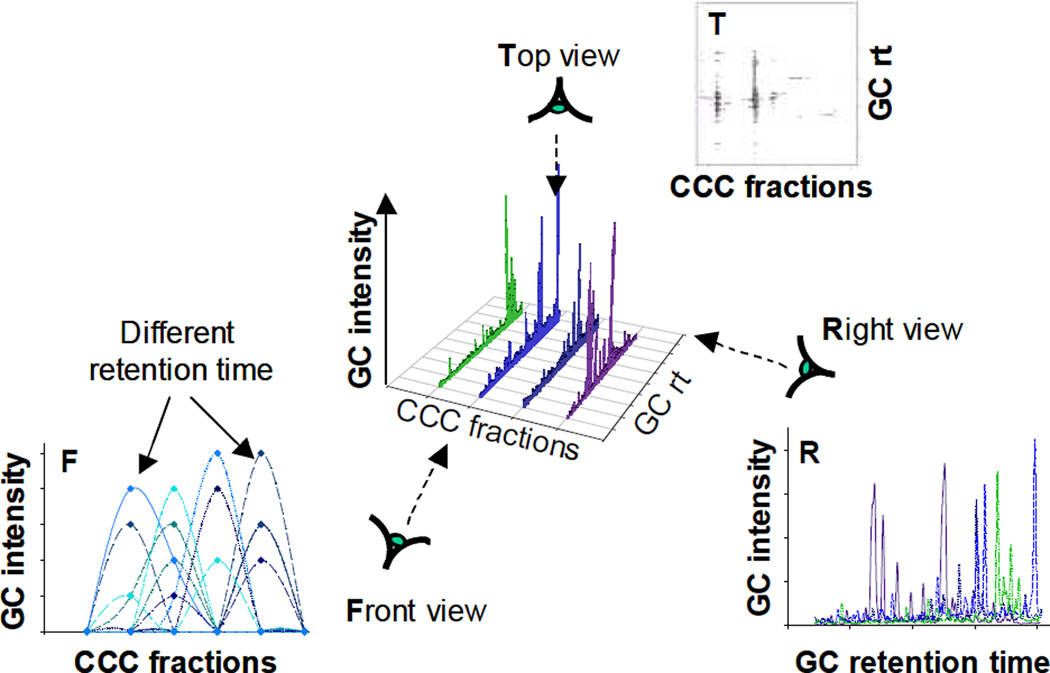
GC/MS analysis of all CCC fractions and subsequent building of a 3-dimentsional CCC-GC/MS data matrix (Fig. 3);
-
Step 4:
Data processing and chemometric analysis, establishing links between the deconvolved biochromatogram (Step 2) with the 3D CCC-GC/MS data matrix (Step 3).
The underlying hypothesis of the present study is that the combination of high-resolution preparative fractionation, bioassay, analytical chromatography, and chemometric analysis enables the assignment of the bioactive constituents in the complex study material (ethnobotanical extract), without the necessity for isolation and/or full structure elucidation. CCC was employed because of its liquid-liquid partition mechanism which provides 100% theoretical recovery of analytes. Another advantage of the proposed method is in creating the orthogonal chromatogram which enables us to correlate transition of elution in chromatography with activity. To test the hypothesis, secondary metabolites of known structure and bioactivity (actives and inactives) were used as positive and negative control markers, respectively. The Alaskan anti-TB ethnobotanical, Oplopanax horridus (common name: devil’s club), was selected as a study plant due to its synergistic mode of activity and the availability of both active (positive) and inactive (negative) reference markers, both previously established in our laboratory [12, 13].
Fig. 2.
Deconvolved biochromatogram of O. horridus crude extract. The x-axis represents the K values of the CCC fractions, and the y-axis indicates the anti-TB activities of the fractions. The bioactivities for all fractions observed at 50 µg/ml (black line) were deconvolved into Gaussian peaks to produce 19 biopeaks (colored), which are representative of the individual active principles and thus were used for Pearson’s correlation. Each of the 19 biopeaks contains multiple compounds which were further analyzed by GC-MS. These biopeaks are reflected as vertical bars in Fig 6.
Fig. 3.
Formation of a 3D CCC-GC-MS matrix. The aligned GC-MS chromatograms (bottom right, Right view) were combined with the CCC dimension of the CCC fractionation to produce a three-dimensional graph (center), which can be projected in the form of a CCC-GC contour map (top right, Top view). Projections of the three-dimensional graph shows the slices of GC peaks of identical retention times when plotted along the CCC axis (bottom left, Front view).
The term biochemometrics for this approach was proposed earlier [14] and is based on the following rationale: It integrates information (a) related to a health impact, e.g., from a high-throughput bioassay; (b) from high-throughput chemical analysis, including preparative scale analysis of the intervention agent; and (c) (chemo)metric methodology (see also Fig. 1).
2 Materials and Methods
2.1 Instrumentation
The CCC separations were conducted using high-speed countercurrent chromatography (HSCCC) with three-coiled, hydrodynamic CCC machines that employ J-type planetary motion of the CCC columns. The instrument used was a CCC-1000 (Pharma-Tech Research Corp., Baltimore, MD, USA), which has a rotation radius of 7.5 cm, and was equipped with a Lab-Alliance Series III digital single-piston solvent pump and a Pharmacia Biotech RediFrac 95-tube fraction collector. The separation was performed with the 3 × 283 ml PTFE Teflon coil set with 2.6 mm i.d., 4.1 mm o.d., and beta values from 0.47 to 0.73.
Gas chromatography was performed on a Varian CP 3800 GC instrument equipped with a Varian 1200 quadrupole mass spectrometer and fitted with a 30 m × 0.25 mm × 0.25 µm FactorFour™ VF-5ms column (Varian Inc., Palo Alto, CA). Helium was used as a carrier gas at 1 ml/min. Splitless injections of 1.0 µl at 240 °C were used for all samples. Oven temperature increased from 50 °C in a linear gradient of 10 °C/min for 23 minutes. Once reaching 280 °C, the temperature was held constant for the remaining 6.8 minutes of a 30-minute run. Mass spectra were acquired in positive EI mode at −70 eV with centroid scans from 50–650 m/z. Blank runs of dichloromethane were used between fractions with the same temperature program to cleanse the system. The database search for mass spectra was conducted using NIST database version 2.0 a (2002). GC-MS was employed because of its high sensitivity against lipophilic small molecules as well as its capability to provide fragment ions to aid dereplication of analytes.
2.2 Plant material
Inner stem bark of O. horridus (Sm.) Miq. from Alaska was harvested from authentic, wild cultures by and obtained through Alaska Green Gold, Anchorage, in the fall of 2002. Voucher specimens are deposited in the John G. Searle Herbarium at the Field Museum in Chicago, IL.
2.3 CCC separation (Step 1)
The CCC separation was conducted with the HEMWat –4 solvent system [15]. A 1.2 g aliquot of the O. horridus extract was dissolved in 10 ml of a 1:1 mixture of upper and lower phase. The instrument was equilibrated with upper phase as the mobile phase (normal phase mode, tail-in/head-out) and stationary phase retention (Sf) of 0.71 was achieved at a flow rate of 3.0 ml/min and a rotation speed of 1000 rpm. The eluent was collected in 4 min intervals until the compound with partition coefficient (K = Cs/Cm) of 3.2 eluted, and combined into 64 fractions based on thin layer chromatography monitoring.
2.4 Bioassay and Formation of Biochromatogram (Step 2)
The anti-mycobacterial assay utilized was a Microplate Alamar Blue Assay (MABA) using the virulent Mycobacteria tuberculosis Erdman strain (ATCC 35801) [16, 17]. Due to the number of fractions tested and the range of the minimum inhibitory concentration (MIC) values of the primary fractions, percent inhibition values were determined at various concentrations. The first-line TB drug, rifampin, was used as a positive control. The results were expressed in terms of % inhibition and plotted against the K values of the CCC fractions, to yield the biochromatogram (Fig. 2). Reflecting the biological fingerprint of the preliminary fractionation of the crude extract, the biochromatogram exhibited the presence of multiple overlapping bioactive principles in O. horridus. As CCC and other partition chromatography method yield Gaussian distribution of analytes, the biochromatogram represents a convolution of Gaussian peaks [18]. Accordingly, the biochromatogram of the crude O. horridus extract was deconvolved into individual peaks of bioactives (biopeaks), each of which represents a Gaussian distribution. The computer-aided deconvolution of the high-resolution biochromatogram, used Origin Pro 8.0 (OriginLab, Northampton, MA, USA) and resulted in nineteen biopeaks.
2.5 GC-MS analysis (Step 3)
Concurrently with Step 2, all CCC fractions from Step 1 were subjected to GC-MS analysis. In order to enable quantitative correlations between the relative peak areas of corresponding constituents of the CCC elution profile, the GC-MS sample concentrations were adjusted in proportion to the yield (dry weight) of each fraction. Background correction was performed by subtracting an average of three blank solvent runs from the chromatograms of each of the samples. Peak alignment was performed using the MATLAB software package and the publicly available modified algorithm [19]. The exported GC chromatograms were divided into seven groups of biopeaks for stepwise chemometric analyses, according to the profile of the biochromatogram from Step 2 (Table S1). Window sizes for peak alignment were manually set for each subgroup.
After the GC-MS data had been aligned by the algorithm, the data sets were recombined to assemble a 3D CCC-GC-MS matrix by plotting all GC-MS chromatograms together along the K values of the CCC axis. The 3D matrix consists of CCC fractions (x-axis) versus GC retention time (y-axis), and MS intensity (z-axis) (Fig. 3), and represents a 3D plot of a 4-way data set which contains bioactivity (% inhibition, Step 2) as the 4th dimension. While we are aware of chemometric methods for the analysis of N-way data, the data set was reduced to 3D for the present application and proof of principle.
Next, the 3D matrix was sliced along the GC retention time axis, which resulted in sub-chromatograms consisting of the GC-MS response vs. the CCC K value (Fig. 3, front view).
2.6 Final Data Analysis (Step 4)
Subsequent chemometric analysis used Pearson’s correlation to establish correlation coefficients between the chemical and biological variables, i.e., GC-MS peaks and biopeaks in the deconvolved biochromatogram, respectively. Pearson’s correlation coefficient (r) is a measure for the similarity of the shapes between two peaks. Thus, one advantage of using Pearson’s correlation for the purpose of linking chemical and biological parameters is that it treats minor and major peaks equally as major ones, i.e., Pearson’s correlation does not take the peak height into account. Thus, in the biochemometrics concept, an ideal match (r=1) unequivocally links chromatographic peak with the biological endpoint, as the mode of GC separation is not only orthogonal to that of CCC, but also independent of the biochromatogram dimension.
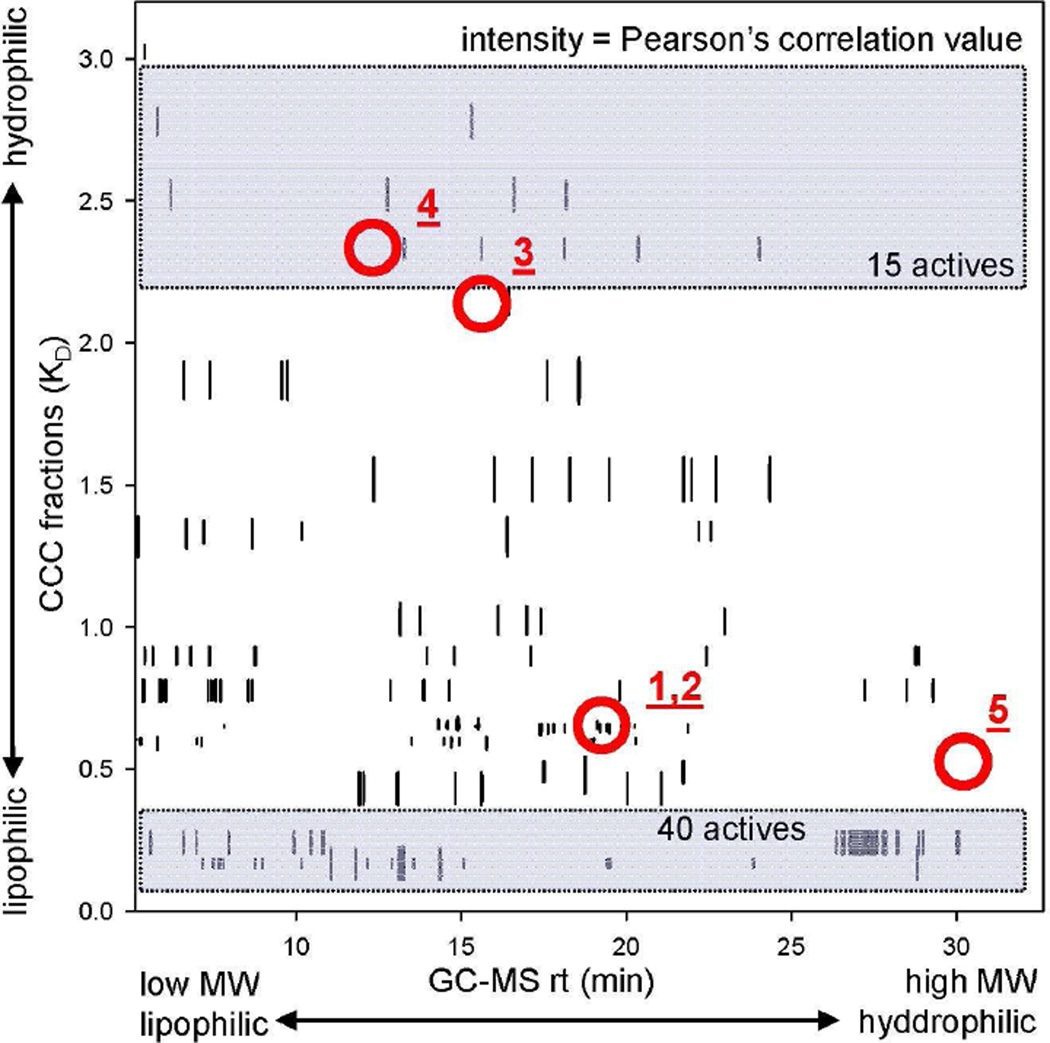
The threshold for r was set individually for each subgroup of GC-MS chromatograms (Table S1) to the lower limit of the Population Correlation Coefficient (ρ) as 0.5 at a 95% confidence interval (Table S2). The results were plotted as a contour map of the Pearson’s correlation values for nineteen biopeaks from Step 2 vs. GC retention times and CCC K values (Fig. 4). The positive correlation of the anti-TB active compounds 1 and 2, for which this bioactivity had been established separately through isolation and bioassay, confirmed the validity of the correlation matrix.
Fig. 4.
Final result of the biochemometric analysis. The Pearson’s correlation values for nineteen biopeaks are plotted as a contour map, with the GC retention time on the x-axis and the CCC K values on the y-axis. The threshold for peaks to appear on the contour map was in accordance with Table S2. The circles and numbers indicate the location of those compounds which were unambiguously identified by comparison with the authentic references. Of these, only the anti-TB active compounds 1 and 2 showed significant correlations with the biopeaks. Relatively large numbers of highly correlated GC peaks were observed at both ends of the GC retention time axis (rt < 13 min and > 25 min) for CCC fractions with K values smaller than 0.30. In contrast, GC peaks highly correlated with activity were observed in the middle of the gas chromatogram among the semi-polar fractions with K values larger than 0.30. In total, more than 40 GC peaks with correlation values above 0.95 were detected in CCC fractions with K values between 0.05 and 0.13. On the other hand, CCC fractions with K values above 1.88 yielded 15 GC peaks with correlations larger than 0.8.
Background corrected mass spectra of the GC-MS peaks which showed high Pearson’s correlations were compared with the spectra stored in the database. A matching factor of 800 and 35 % probability matches were set as thresholds. The following factors were considered when setting these thresholds: the achievable reproducibility of ionization of the same molecule between the different instruments (database vs. experimental equipment), the difference in ion detection methods and tuning characteristics between the types of instrument used (sector field vs. quadrupole, respectively), and the power of the algorithm used in the search to detect correct compounds. The latter particularly addresses the chance that an observed spectrum indeed stems from a compound contained in the spectral library, as well as the possibility of stereo-isomers [20, 21]. Stein has previously demonstrated that (a) MS spectra with matching factors (MFs) over 800 significantly increased the chance that the compound of the observed spectra is indeed in the library, and (b) the probability that the first match is the correct compound is 0.35 if the second and first match have identical MF values [20].
3 Results and Discussion
The result of the biochemometric analysis is summarized in Fig. 4. In line with the expected characteristics of an ethnobotanical extract with synergistic mode of action, more than 100 active principles were assigned in the crude extract of O. horridus, which contained over 3,000 peaks detected by GC-MS. The previously isolated secondary metabolites, 1-5, were positively confirmed in the matrix by comparison of their GC retention times and MS spectra with those of authentic materials [12]. Among 1-5, only the active compounds, namely oplopandiol (1) and falcarindiol (2), resulted in positive matches between biochromatogram (Fig. 2) and CCC elution profile (Fig. 3F) with r values of 0.96 and 0.91, respectively. In contrast, the following previously isolated compounds, which lacked activity (MIC > 128 µg/ml) (3,10-epoxy-3,7,11-trimethyldodeca-1,6-dien-11-ol (3), 7,10-epoxy-3,7,11-trimethyldodec-1-ene-3,6,11-triol (4), and sesamin (5)), exhibited only negligible correlation coefficients of 0.53 (3), 0.47 (4), and 0.32 (5), respectively. These observations provide strong support for the ability of the biochemometric method to distinguish active from inactive compounds in complex mixtures.
Relatively large numbers of highly correlated GC peaks were observed at both ends of the GC retention time axis (rt < 13 min and > 25 min) for CCC fractions with K values smaller than 0.30 (Fig. 4). In contrast, GC peaks highly correlated with activity were observed in the middle of the gas chromatogram among the semi-polar fractions with K values larger than 0.30. In total, more than 40 GC peaks with correlation values above 0.95 were detected in CCC fractions with K values between 0.05 and 0.13. On the other hand, CCC fractions with K values above 1.88 yielded 15 GC peaks with correlations larger than 0.8. One possible explanation is that O. horridus is rich in lipophilic anti-TB active constituents. Another consideration is that CCC fractions with extreme K values (K ≪ 0.1 and K ≫ 10) obtained from crude materials typically contain relatively large numbers of metabolites. Information about the population density of positive hits could help in optimizing the experimental analytical conditions for future studies, and aid in scale-up studies aimed at the isolation of active compounds.
The effect of peak alignment was tested by comparing the result of biochemometric analysis from two GC-MS data sets, i.e., with and without peak alignment. The average of the top 20 matches for biopeak 7 was 0.95 with peak alignment, in contrast to 0.81 without peak alignment. The correction of the retention time caused by peak alignment was less than 2s on average. The aligned GC peaks had almost identical fragmentation patterns in the mass spectra of neighboring CCC fractions. Thus, peak alignment was confirmed to be an important component of the biochemometric method.
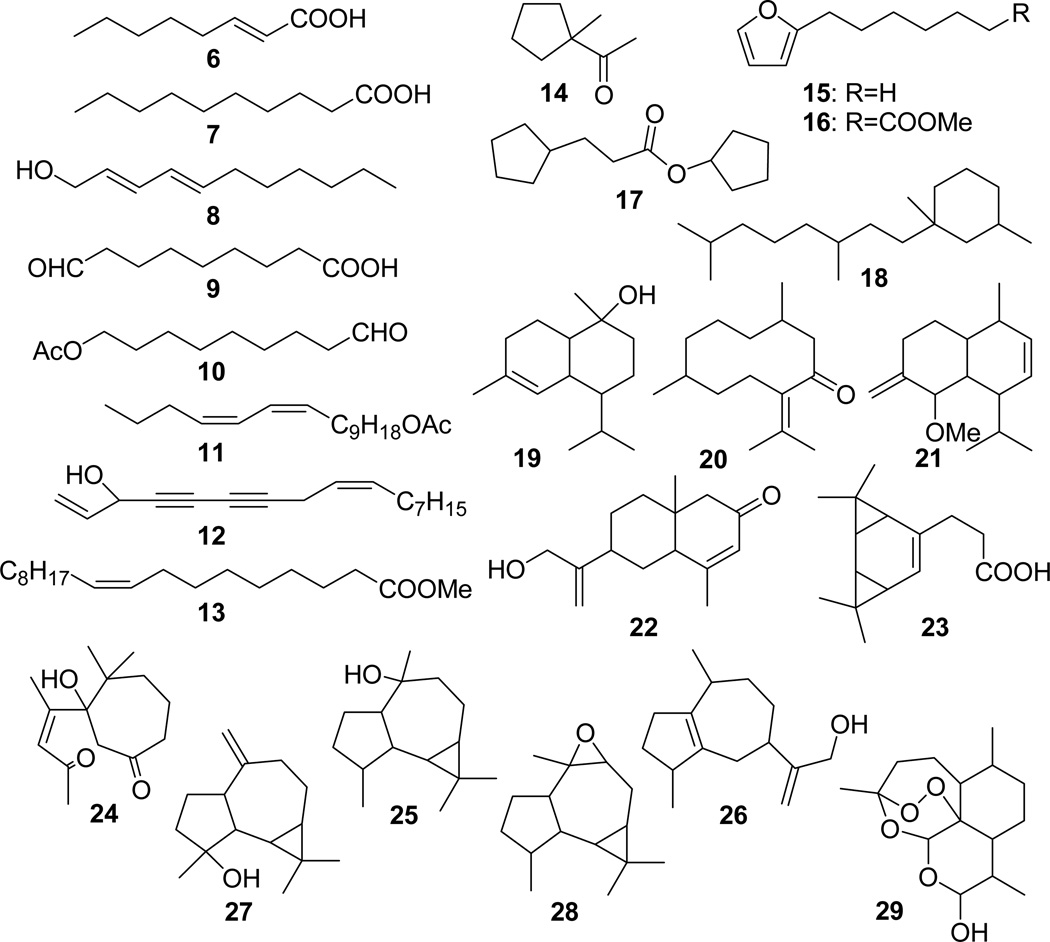
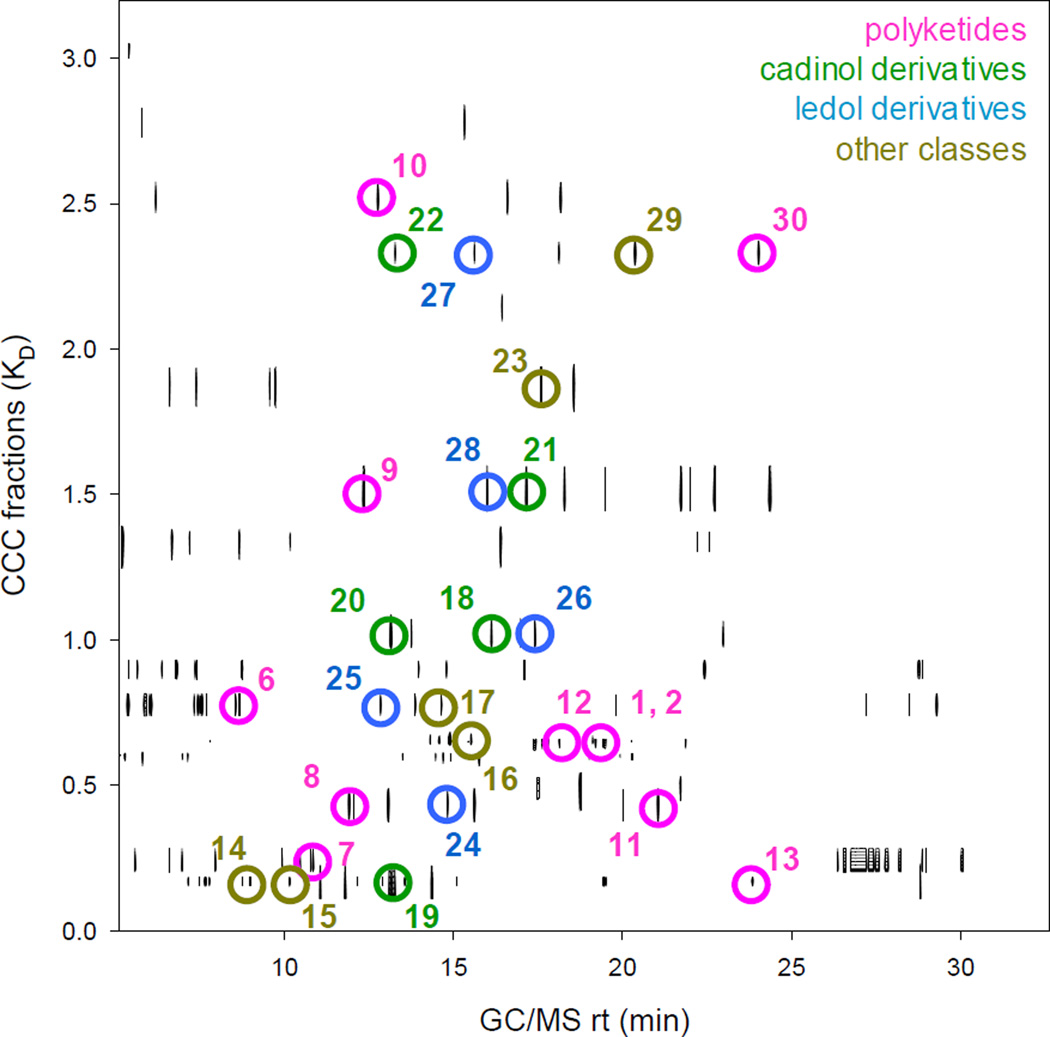
Having the scope to develop a method to identify active principles, we attempted to dereplicate actives among the GC peaks highly correlated with activity by using mass spectra library searches. This resulted in identification of an additional 24 compounds, each of which were assigned to individual correlations in the CCC-GC-Pearson matrix (Fig. 5 and 6; see also Table S3 of Supplementary Material).
Fig. 5.
Structures of the anti-TB active metabolites, 6 – 29, identified by biochemometric analysis by EI-MS based dereplication.
Fig. 6.
Distribution of the 24 anti-TB active metabolites in the 3D CCC-GC-Pearson Matrix. The assigned peaks are color coded in accord to the structural classes: pink for polyketides, green for cadinol type sesquiterpenes, blue for ledol type sesquiterpenes, and brown for others.
This MS spectra library based identification of 24 compounds led to discovery of potential advantages of biochemometrics that are summarized in four following points.
Consistent positive identification of previously known active compounds
Consistent identification of compounds of the same skeletal structure from different areas of 3D CCC-GC-MS matrix
Orthogonal chromatographs separated actives that an individual technique failed to resolve
High sensitivity for the detection of minor active constituents
A positive match of EI mass spectra does not substitute for an unambiguous identification, through isolation and intensive spectroscopic analysis. Nevertheless, EI MS fragmentation patterns provide a rich source of information regarding the skeleton of the compound, its functional groups, and the molecular mass of the building blocks. Among the identified compounds, n-decanoic acid (7) and falcarinol (12) were known to be active in vitro against virulent strains of M. tuberculosis [13, 22, 23]. Moreover, although structurally unidentified, compound 30 exhibited the characteristic MS fragmentation pattern of an en-diyne-type compound, and is, therefore, likely to possess significant activity against TB. This confirms previous results, identifying en-diynes as important anti-TB active principles in O. horridus. In addition, dihydroartemisinin (29), which is used as positive control for anti-malarial activity, has a potential for anti-TB activity since two endo-peroxides with anti-TB activity have been reported [24, 25]. Apart from active constituents in O. horridus, the biochemometrics method was preliminarily tested for a Dracaena angustifolia extract while the present method was still under development. The results were in line with the results shown here for O. horridus, in as much as they also led to the positive identification of all three D. angustifolia active compounds which had been isolated through a BGF procedure [26].
The anti-TB active principles of O. horridus identified by biochemometric analysis can be classified into three main compound classes: fatty acids and their derivatives (6-13, 30), cadinane derivatives (19-21), and ledane derivatives (24-26) (Fig. 5). These compounds were detected across the entire 2D chromatogram and were resolved within the complex matrix by two independent modes of separations, i.e., CCC and GC-MS. Thus, a striking consistency was observed in the structural types of compounds that correlated with the bioactivity, suggesting that the activity was derived from the skeletal backbone of these compounds. Accordingly, these structural classes may have potential as templates for structure-activity relationship studies, especially when combined with analoging efforts. These results demonstrate the ability of the biochemometric approach to identify classes of active constituents from complex mixtures such as crude extracts.
Among the assigned active principles, compounds 8-10, 19, and 20 exhibited very close GC retention times while eluting at largely different K values in CCC. On the other hand, compounds 1, 2, and 12, as well as compounds 8 and 11, eluted at practically identical K values, but they were separated by GC-MS (Fig. 6). These observations exemplify the orthogonal nature of the employed chromatographic methods, CCC and GC. The power of orthogonality enabled separation of similar compounds that most likely would be unresolved in single-step chromatography even at high-resolution.
It is also noteworthy that fourteen of the assigned active anti-TB principles, including the previously isolated potent anti-TB active compound 12, had individual GC peak areas less than 1% of the total chromatogram generated from each of the CCC fractions [13]. Since it is always possible that moderate activity of the crude extract results from the presence of highly potent compounds at very low abundance, sensitivity is crucial for the detection of bioactive metabolites. To this end, based on uncorrected GC peak areas and considering the number of CCC fractions obtained from the crude extract, the estimated limit of correlation of the method in detecting active principles is in the range of 0.01% or 100 ppm.
Although biochemometric analysis required a deconvolution process for the biological component of the biochromatogram, advantages are that it provides multi-dimensional information of bioactivities for each sample and reduces overlap in the matrix of the chemical components separated during the 2-step chromatographic analysis. While the spectroscopic component provides useful structural information, the biochemometric concept does not necessary require full structure elucidation of the active constituents. The key innovation of the method comes from its mathematical correlation between biological (bioassay) and chemical (chromatographic, spectroscopic) information while eliminating the risk of losing active principles during the chemical procedure. This is particularly useful when standardizing complex mixtures with unknown active constituents.
4 Concluding Remarks
Bioactivity and efficacy of complex natural products are frequently a result of the coexistence of several active principles, which are embedded into a complex mixture and, sometimes, unfold essential synergistic interactions. Accordingly, such materials challenge classical approaches which depend on the monitoring and isolation of individual active constituents and their subsequent identification. The presented biochemometric analysis allowed pinpointing of multiple actives in an ethnobotanical, O. horridus, without potential loss of active principles while excluding inactives as biologically significant marker compounds. The biochemometric approach was validated by the identification of four bioactive phytoconstituents that were previously discovered through bioassay-guided isolation. In addition, the approach was capable of semi-quantitative assignment of a total of 100 active anti-TB principles in the ethnobotanical, O. horridus.
From this large pool of actives, 24 compounds were tentatively identified by mass spectrometry and assigned to each of the biochemometric cross peaks. Although covering a wide range of CCC K values and GC retention times, the actives share structural similarities, in particular with regard to their cadinol- and ledol-type sesquiterpene as well as polyketide skeletons. Considering these assignments, and owing to the fact that information about their anti-TB activities is lacking, these two classes of secondary metabolites are worth further investigation, including analoging and isolation. Synthetic analoging has been shown to improve the bioactivity of leads by orders of magnitude [27, 28]. Hence the two terpene skeletons consistently found in the active anti-TB fractions of O. horridus are prime candidates for further in-depth studies.
The biochemometric approach exemplifies how metabolomic methodology can complement a widely accepted contemporary paradigm, such as bioassay-guided fractionation, used to identify active principles in complex extracts with established or potential health impact (Fig. 1). With regard to future developments, the approach can benefit from advancements in MS-based metabolomics, such as MS databases for secondary metabolites of plant origin, as well as from methods for peak identification (high-resolution MS) and peak alignment [29]. Keeping in mind the need to employ chemical and biological assays that are robust, precise and capable of sufficient throughput, biochemometric analysis has particular potential as a standardization method for bioactive (ethno)botanicals. Most useful in this role will be its capability of establishing semi-quantitative connections between chemical entities (chromatographic peaks) and biologically active principles (secondary metabolites).
Supplementary Material
Acknowledgements
We thank Mr. David C. Smith of Alaska Green Gold, Anchorage, for cultivation of the plant material. We are also grateful to Dr. Tobias Karakach, IMB/NRC, Halifax (Canada) and Dr. Jim McAlpine, University of Illinois at Chicago, for their helpful comments during the preparation of the manuscript. This work was supported in part by the National Center for Complementary and Alternative Medicine (NCCAM/NIH) under grant 1R43AT001758-01.
Footnotes
Publisher's Disclaimer: This is a PDF file of an unedited manuscript that has been accepted for publication. As a service to our customers we are providing this early version of the manuscript. The manuscript will undergo copyediting, typesetting, and review of the resulting proof before it is published in its final citable form. Please note that during the production process errors may be discovered which could affect the content, and all legal disclaimers that apply to the journal pertain.
References
- 1.Dobson CM. Chemical space and biology. Nature. 2004;432:824–828. doi: 10.1038/nature03192. [DOI] [PubMed] [Google Scholar]
- 2.Koch MA, Schuffenhauer A, Scheck M, Wetzel S, Casaulta M, Odermatt A, et al. Charting biologically relevant chemical space: a structural classification of natural products (SCONP) Proceedings of the National Academy of Sciences of the United States of America. 2005;102:17272–17277. doi: 10.1073/pnas.0503647102. [DOI] [PMC free article] [PubMed] [Google Scholar]
- 3.Balunas MJ, Kinghorn AD. Drug Discovery from Medicinal Plants. Life Sciences. 2005;78:431–441. doi: 10.1016/j.lfs.2005.09.012. [DOI] [PubMed] [Google Scholar]
- 4.Tyler VE. Phytomedicines: Back to the Future. Journal of Natural Products. 1999;62:1589–1592. doi: 10.1021/np9904049. [DOI] [PubMed] [Google Scholar]
- 5.Belofsky G, Carreno R, Lewis K, Ball A, Casadei G, Tegos GP. Metabolites of the "Smoke Tree", Dalea spinosa, Potentiate Antibiotic Activity against Multidrug-Resistant Staphylococcus aureus. Journal of Natural Products. 2006;69:261–264. doi: 10.1021/np058057s. [DOI] [PubMed] [Google Scholar]
- 6.Stermitz FR, Lorenz P, Tawara JN, Zenewicz LA, Lewis K. Synergy in a medicinal plant: antimicrobial action of berberine potentiated by 5'-methoxyhydnocarpin, a multidrug pump inhibitor. Proceedings of the National Academy of Sciences of the United States of America. 2000;97:1433–1437. doi: 10.1073/pnas.030540597. [DOI] [PMC free article] [PubMed] [Google Scholar]
- 7.Gilbert B, Alves LF. Synergy in plant medicines. Current Medicinal Chemistry. 2003;10:13–20. doi: 10.2174/0929867033368583. [DOI] [PubMed] [Google Scholar]
- 8.van Vuuren S, Viljoen A. Plant-Based Antimicrobial Studies - Methods and Approaches to Study the Interaction between Natural Products. Planta Medica. 2011;77:1168–1182. doi: 10.1055/s-0030-1250736. [DOI] [PubMed] [Google Scholar]
- 9.Junio HA, Sy-Cordero AA, Ettefagh KA, Burns JT, Micko KT, Graf TN, et al. Synergy-Directed Fractionation of Botanical Medicines: A Case Study with Goldenseal (Hydrastis canadensis) Journal of Natural Products. 2011;74:1621–1629. doi: 10.1021/np200336g. [DOI] [PMC free article] [PubMed] [Google Scholar]
- 10.Case RJ, Wang Y, Franzblau SG, Soejarto DD, Matainaho L, Piskaut P, et al. Advanced applications of counter-current chromatography in the isolation of anti-tuberculosis constituents from Dracaena angustifolia. Journal of Chromatography, A. 2007;1151:169–174. doi: 10.1016/j.chroma.2007.01.022. [DOI] [PubMed] [Google Scholar]
- 11.Fiehn O, Kristal B, van Ommen B, Sumner LW, Sansone SA, Taylor C, et al. Establishing reporting standards for metabolomic and metabonomic studies: a call for participation. OMICS. 2006;10:158–163. doi: 10.1089/omi.2006.10.158. [DOI] [PubMed] [Google Scholar]
- 12.Inui T, Wang Y, Nikolic D, Smith DC, Franzblau SG, Pauli GF. Sesquiterpenes from Oplopanax horridus. Journal of Natural Products. 2010;73:563–567. doi: 10.1021/np900674d. [DOI] [PubMed] [Google Scholar]
- 13.Kobaisy M, Abramowski Z, Lermer L, Saxena G, Hancock REW, Towers GHN, et al. Antimycobacterial polyynes of Devil's Club (Oplopanax horridus), a North American native medicinal plant. J Nat. Prod. 1997;60:1210–1213. doi: 10.1021/np970182j. [DOI] [PubMed] [Google Scholar]
- 14.Inui T, Wang Y, Franzblau SG, Pauli GF. Biochemometric Evaluation of an Anti-TB Ethnobotanical. In: Beutler JA, editor. 46th Annual Meeting of American Society of Pharmacognosy; Corvallis, Oregon. 2005. p. 229. [Google Scholar]
- 15.Friesen JB, Pauli GF. G.U.E.S.S. - A Generally Useful Estimate of Solvent Systems for CCC. Journal of Liquid Chromatography & Related Technologies. 2005;28:2777–2806. [Google Scholar]
- 16.Franzblau SG, Witzig RS, McLaughlin JC, Torres P, Madico G, Hernandez A, et al. Rapid, low-technology MIC determination with clinical cobacterium tuberculosis isolates by using the microplate Alamar Blue assay. Journal of Clinical Microbiology. 1998;36:362–366. doi: 10.1128/jcm.36.2.362-366.1998. [DOI] [PMC free article] [PubMed] [Google Scholar]
- 17.Collins LA, Franzblau SG. Microplate Alamar blue assay versus BACTEC 460 system for high-throughput screening of compounds against Mycobacterium tuberculosis and Mycobacterium avium. Antimicrobial Agents and Chemotherapy. 1997;41:1004–1009. doi: 10.1128/aac.41.5.1004. [DOI] [PMC free article] [PubMed] [Google Scholar]
- 18.Craig LC. Identification of small amounts of organic compounds by distribution studies II: Separation by counter-current distribution. Journal of Biological Chemistry. 1944;155:519–534. [PubMed] [Google Scholar]
- 19.Johnson KJ, Wright BW, Jarman KH, Synovec RE. High-speed peak matching algorithm for retention time alignment of gas chromatographic data for chemometric analysis. Journal of Chromatography A. 2003;996:141–155. doi: 10.1016/s0021-9673(03)00616-2. [DOI] [PubMed] [Google Scholar]
- 20.Stein SE. Estimating Probabilities of Correct Identification from Results of Mass Spectral Library Searches. Journal of the American Society for Mass Spectrometry. 1994;5:316–323. doi: 10.1016/1044-0305(94)85022-4. [DOI] [PubMed] [Google Scholar]
- 21.McLafferty FW, Zhang M-Y, Stauffer DB, Loh SY. Comparison of Algorithms and Databases for Matching Unknown Mass Spectra. Journal of the American Society for Mass Spectrometry. 1998;9:92–95. doi: 10.1016/S1044-0305(97)00235-3. [DOI] [PubMed] [Google Scholar]
- 22.Carballeira NM, Cruz H, Kwong CD, Wan B, Franzblau S. 2-Methoxylated fatty acids in marine sponges: Defense mechanism against mycobacteria? Lipids. 2004;39:675–680. doi: 10.1007/s11745-004-1281-8. [DOI] [PubMed] [Google Scholar]
- 23.Barker RM. Bactericidal action of low-molecular-weight compounds on Mycobacterium tuberculosis. J. Appl. Bacteriol. 1964;27:213–220. [Google Scholar]
- 24.Cantrell CL, Rajab MS, Franzblau SG, Fronczek FR, Fischer NH. Antimycobacterial ergosterol-5,8-endoperoxide from Ajuga remota. Planta Medica. 1999;65:732–734. doi: 10.1055/s-1999-14053. [DOI] [PubMed] [Google Scholar]
- 25.Saludes JP, Garson MJ, Franzblau SG, Aguinaldo AM. Antitubercular constituents from the hexane fraction of Morinda citrifolia Linn. (Rubiaceae) Phytotherapy Research. 2002;16:683–685. doi: 10.1002/ptr.1003. [DOI] [PubMed] [Google Scholar]
- 26.Case R. Integrative pharmacognostic evaluation of anti-TB ethnobotanicals from Manus. Chicago: Department of Medicinal Chemistry and Pharmacognosy, University of Illinois at Chicago; 2006. p. 226. [Google Scholar]
- 27.Dal Ben D, Lambertucci C, Taffi S, Vittori S, Volpini R, Cristalli G, et al. Molecular modelling study of 2-phenylethynyladenosine (PEAdo) derivatives as highly selective A(3) adenosine receptor ligands. Purinergic Signal. 2006;2:589–594. doi: 10.1007/s11302-006-9010-6. [DOI] [PMC free article] [PubMed] [Google Scholar]
- 28.Basu S, Ellinger B, Rizzo S, Deraeve C, Schurmann M, Preut H, et al. Organic Synthesis Toward Small-Molecule Probes and Drugs Special Feature: Biology-oriented synthesis of a natural-product inspired oxepane collection yields a small-molecule activator of the Wnt-pathway. Proceedings of the National Academy of Sciences of the United States of America. 2011;108:6805–6810. doi: 10.1073/pnas.1015269108. [DOI] [PMC free article] [PubMed] [Google Scholar]
- 29.Tohge T, Fernie AR. Web-based resources for mass-spectrometry-based metabolomics: A user's guide. Phytochemistry. 2009;70:450–456. doi: 10.1016/j.phytochem.2009.02.004. [DOI] [PubMed] [Google Scholar]
Associated Data
This section collects any data citations, data availability statements, or supplementary materials included in this article.


