

Summary
3-Phosphoinositide-dependent protein kinase-1 (PDK1) and phospholipase C (PLC)γ1 are two key enzymes in signal transduction that control several intracellular processes. Despite the fact that PLCγ1 has been investigated for several years, the mechanisms of activation of this enzyme are still not completely clear. Similarly, although PDK1 has been mostly investigated for its role in activation of Akt, a crucial enzyme in regulation of several cellular processes, it has become evident recently that the role of PDK1 in physiological and pathological conditions is not limited to Akt activation. Here we demonstrate that PDK1 regulates PLCγ1 activation in a mechanism involving association of the two enzymes and modulation of PLCγ1 tyrosine phosphorylation. We further show that this novel PDK1–PLCγ1 pathway is important for cancer cell invasion. The identification of a PDK1–PLCγ1 pathway reveals the existence of a previously undetected link between two of the most important enzymes in signal transduction. This is likely to have profound consequences for our understanding of several cellular functions that are dependent on phosphoinositides and controlled by PDK1 and PLCγ1.
Key words: Cell invasion, Cell signalling, 3-Phosphoinositide-dependent protein kinase-1, Phosphoinositide 3-kinase, Phospholipase Cγ1
Introduction
Phosphoinositides (PIs) play a pivotal role in signal transduction and they are extensively studied both as precursors and as second messengers themselves. Members of the family of the phosphoinositide-specific phospholipases C (PLC) converts phosphatidylinositol 4,5-bisphosphate [PtdIns(4,5)P2] into the second messengers diacylglycerol and inositol 1,4,5-trisphosphate (Rhee, 2001). PI-PLCs have been involved in regulation of several intracellular functions through PtdIns(4,5)P2 hydrolysis. In particular, PLCγ1 has a well established role in mediating cellular signalling upon activation of several receptor tyrosine kinases (RTK), including epidermal growth factor (EGF) receptor, platelet-derived growth factor receptor and many more (Bunney and Katan, 2011). Many cellular functions regulated by PLCγ1 activation have been discovered, including a central role in actin cytoskeleton remodelling and cell migration (Kölsch et al., 2008). Importantly, several studies have now demonstrated the key role of PLCγ1 in metastasis (Wells and Grandis, 2003; Sala et al., 2008), revealing the involvement of this enzyme in cancer and suggesting that PLCγ1 may represent an important therapeutic target for development of anti-metastatic drugs. Despite the fact that PLCγ1 is one of the central enzymes in regulation of signalling cascades downstream of growth factors stimulation and that it has been investigated for several years, the mechanisms of activation of this enzyme are still not completely clear (Maffucci and Falasca, 2007). Although it is well established that tyrosine phosphorylation upon recruitment of the enzyme to RTKs is critical for PLCγ1 activation, this event is not sufficient to induce full activation of the enzyme (Sekiya et al., 2004). Additional mechanisms of activation exist and they can be necessary for full activation of PLCγ upon RTK stimulation or complementary (Maffucci and Falasca, 2007). For instance phosphoinositide 3-kinase (PI3K) product phosphatidylinositol 3,4,5-trisphosphate [PtdIns(3,4,5)P3] induces strong activation of PLCγ1 in vitro and constitutively active PI3K induces PLCγ1 activation in vivo (Bae et al., 1998; Falasca et al., 1998). This alternative and/or complementary mechanism can become particularly relevant in the context of specific PLCγ1-mediated cellular functions. In particular we demonstrated that a PI3K-dependent PLCγ1 activation is involved in regulation of cell migration upon EGF stimulation in breast cancer cells (Piccolo et al., 2002) and upon fibroblast growth factor 2 stimulation in human umbilical vein endothelial cells (Maffucci et al., 2009). The mechanism underlying the PI3K-dependent regulation of PLCγ is not fully elucidated. Binding of PLCγ1 pleckstrin homology (PH) domain to PtdIns(3,4,5)P3 is involved in PLCγ1 activation (Falasca et al., 1998) but it is not known whether other PI3K effectors can mediate the PI3K-dependent PLCγ1 activation. In this respect it is worth mentioning that a dual PI3K-dependent regulation of PLCγ2 isoform has been proposed, mediated by the interaction between the PH domains of Btk and PLCγ2 and PtdIns(3,4,5)P3 (Clayton et al., 2002; Kim et al., 2004). This leads to the possibility that PI3K may also control PLCγ1 activation through an intermediate, PI3K-dependent effector.
3-Phosphoinositide-dependent protein kinase-1 (PDK1) is a major regulator of PI3K-dependent signalling and it regulates activation of several AGC kinases, including protein kinase B/Akt (Bayascas, 2010; Pearce et al., 2010). Although PDK1 has been previously mostly studied because of its role in regulation of Akt and Akt-dependent cellular functions, including cell proliferation and survival, a huge interest has recently risen on investigating more extensively the wider contribution of PDK1 to signal transduction and cellular processes. This interest has been particularly fuelled by the identification of PDK1-dependent, Akt-independent signalling pathways that can be activated downstream of oncogenic PI3K (Vasudevan et al., 2009), indicating that PDK1-deregulated signalling in disease may have more profound consequences than simply affecting Akt-dependent processes. These data have highlighted the relevance of PDK1 as a potential therapeutic target in cancer and the potential advantages of specific PDK1 inhibitors as more efficient anti cancer drugs compared to drugs targeting only Akt (Raimondi and Falasca, 2011).
PDK1 and PLCγ1 are two central enzymes in signal transduction, regulating several intracellular functions. Despite the general assumption that these two enzymes control parallel and distinct signalling pathways, it has been reported that downregulation of either PDK1 (Liu et al., 2009) or PLCγ1 (Sala et al., 2008) inhibits migration and experimental metastasis of breast cancer cells. This observation led us to the hypothesis that the two enzymes could either co-operate or act in the same signalling cascade to control these processes.
Here we demonstrate that PDK1 regulates EGF-induced PLCγ1 activation, identifying for the first time PLCγ1 as a downstream target of PDK1 action. The mechanism of PDK1-dependent PLCγ1 activation involves association of the two enzymes, specifically at the level of cell protrusions, and modulation of PLCγ1 tyrosine phosphorylation. We further show that this novel PDK1–PLCγ1 pathway is important for cancer cell invasion, suggesting that blockade of this interaction may have a therapeutic potential to counteract metastasis dissemination. The identification of a PDK1–PLCγ1 pathway reveals the existence of a previously undetected link between two of the most important enzymes in signal transduction and it is likely to have profound consequences in our understanding of several PIs-dependent cellular processes.
Results
PDK1 regulates PLCγ1 activity
PDK1 and PLCγ1 have both been reported to be involved in regulation of migration and experimental metastasis of breast cancer cells (Sala et al., 2008; Liu et al., 2009). Whether these two enzymes are involved in the same signalling cascade is not known. This possibility is supported by evidence indicating a role for PI3K or PI3K-dependent signalling in PLCγ1 activation (Bae et al., 1998; Falasca et al., 1998; Maffucci and Falasca, 2007) and in regulation of PLCγ1-dependent cell migration (Piccolo et al., 2002; Maffucci et al., 2009).
We therefore decided to investigate whether PDK1 and PLCγ1 could be activated in the same intracellular signalling cascade. Using a tetracycline-inducible system of PLCγ1 downregulation in breast cancer cells MDA-MB-231 we first observed that downregulation of PLCγ1 did not affect the EGF-induced Akt phosphorylation at Thr308, an event dependent on PDK1 activation (supplementary material Fig. S1). These data indicated that PLCγ1 does not regulate PDK1 activation.
We then tested the hypothesis that PDK1 could be involved in mediating the PI3K-dependent PLCγ1 activation. To investigate this hypothesis we analysed the increase in intracellular calcium and accumulation of inositol phosphates induced by treatment of MDA-MB-231 cells with EGF. Both these processes are dependent on PLCγ1 activation in this cell line since they are strongly inhibited upon tetracycline-induced downregulation of this enzyme (supplementary material Fig. S2A,B) and therefore these assays allowed us to monitor the specific activation of PLCγ1 over other PLC isoforms.
When intracellular calcium was monitored in MDA-MB-231 transiently transfected with a control, scrambled siRNA we observed a clear increase of intracellular calcium upon EGF stimulation (Fig. 1A, left panel). In contrast, downregulation of PDK1 completely inhibited the EGF-induced increase in intracellular calcium in these cells (Fig. 1A, right panel). Cells lacking PDK1 were as responsive as control cells to ATP treatment, confirming the specific inhibitory effect towards EGF-induced calcium increase (Fig. 1A). As a complementary assay to investigate PLCγ1 activation we analysed the EGF-induced accumulation of total inositol phosphates in stable MDA-MB-231 cells expressing a control shRNA (5MUT) and in two distinct clones expressing a shRNA specifically targeting PDK1 (Fig. 1B). PDK1 knock down strongly inhibited the EGF-induced accumulation of inositol phosphates, further indicating that PDK1 regulates PLCγ1 activation. Furthermore, chemical inhibition of PDK1 using the specific inhibitor GSK2334470 (Najafov et al., 2011) also resulted in total abrogation of the EGF-induced intracellular calcium increase and inositol phosphates accumulation in MDA-MB-231 cells (Fig. 1C). These data demonstrate that PDK1 regulates PLCγ1 activation upon EGF stimulation in breast cancer cells.
Fig. 1.

Inhibition of PDK1 blocks PLCγ1 activity. (A) Analysis of intracellular calcium variation in MDA-MB-231 cells transiently transfected with scrambled siRNA (left panel) or with siRNA targeting PDK1 (right panel) upon stimulation with EGF or ATP at the indicated time points (arrows). Data are means from four independent experiments. Representative images of unstimulated and EGF-stimulated cells are shown. (B) Accumulation of inositol phosphates was measured in two clones of MDA-MB-231 cells expressing shRNA targeting PDK1 or 5MUT control shRNA at the indicated times of stimulation with 50 ng/ml EGF. Data are means ± s.e.m. from four independent experiments. *P<0.05. Levels of PDK1 in the indicated clones assessed by western blot analysis are also shown. Equal loading was determined using an anti-ERK2 antibody. (C) Intracellular calcium mobilisation (left panel) and accumulation of inositol phosphates (right panel) in MDA-MB-231 cells treated with 1 µM GSK2334470 and stimulated with EGF at the indicated time points. Left panel shows a representative experiment from three independent experiments. Representative images of unstimulated and EGF-stimulated cells are shown above the left panel. Data in the right panel are means ± s.e.m. from five independent experiments. *P<0.05.
We next investigated whether PDK1 had a role in PLC activation in other, distinct cell lines. Both transient PDK1 downregulation (Fig. 2A) and chemical PDK1 inhibition (Fig. 2B) strongly inhibited the EGF-induced but not the ATP-mediated calcium increase in prostate cancer cells PC3. Similar results were obtained in melanoma cell line A375M upon transient PDK1 downregulation (Fig. 2C). Downregulation of PLCγ1 also inhibited the EGF-mediated calcium increase in PC3 (supplementary material Fig. S2C) and A375M cells (supplementary material Fig. S2D), supporting the conclusion that PDK1 specifically regulates PLCγ1 activity in different cancer cell lines. Finally, a clear inhibition of EGF-induced calcium increase was detected in PDK1-deficient embryonic stem cells (ES) compared to control cells (Fig. 2D).
Fig. 2.
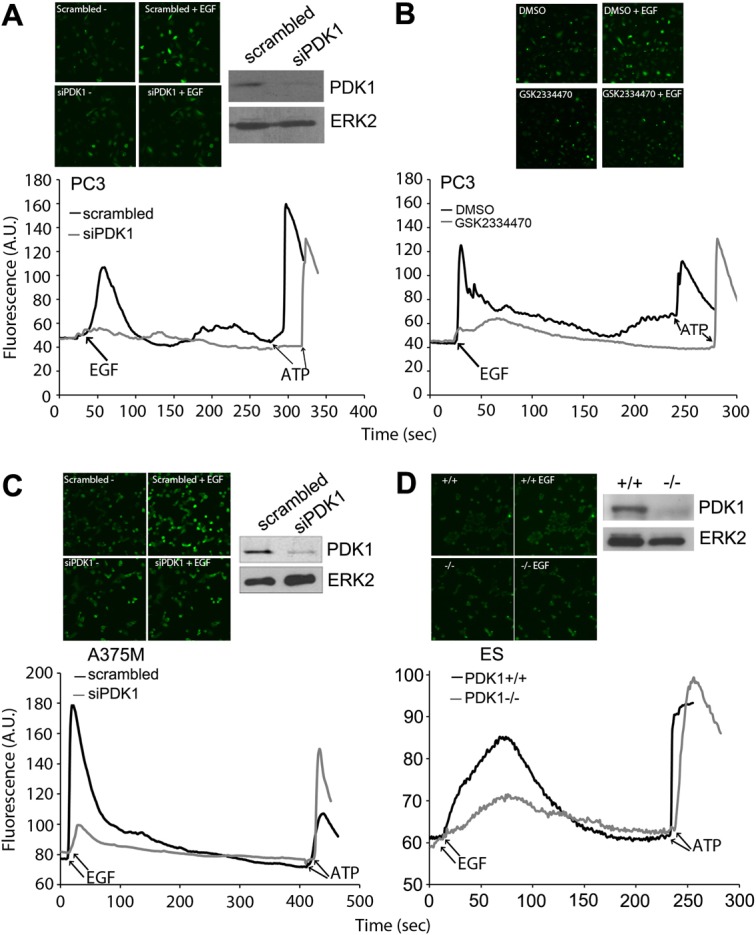
Inhibition of PDK1 impairs EGF-induced calcium increase in different cell lines. (A) Analysis of intracellular calcium variation in PC3 transiently transfected with scrambled siRNA or with siRNA targeting PDK1 upon EGF or ATP stimulation. Levels of PDK1 assessed by western blot analysis are shown. Equal loading was determined using an anti-ERK2 antibody. (B) Analysis of intracellular calcium variation in PC3 treated with 1 µM GSK2334470 upon stimulation with EGF or ATP at the indicated time points (arrows). (C,D) Analysis of intracellular calcium variation in A375M transiently transfected with scrambled siRNA or with siRNA targeting PDK1 (C) and in PDK1+/+ or PDK1−/− ES cells (D) upon stimulation with EGF or ATP at the indicated time points (arrows). Levels of PDK1 assessed by western blot analysis are also shown. Equal loading was determined using an anti-ERK2 antibody. All panels show a representative experiment from three independent experiments. Representative images of unstimulated and EGF-stimulated cells are shown.
Taken together these data demonstrate that PDK1 regulates PLCγ1 activity in several distinct cell lines.
PDK1 regulates the EGF-induced PLCγ1 tyrosine phosphorylation
Since one of the key events for PLCγ1 activation is phosphorylation of its residue Tyr783 (Rhee, 2001), we investigated whether PDK1 was involved in this process. Stable cell populations expressing the same PDK1-specific shRNA as clones shown in Fig. 1B or the control 5MUT were generated by retroviral infection and selected as described in the Materials and Methods section. Cells were then serum-starved overnight and stimulated with EGF for different times. Western blotting analysis indicated that EGF stimulation induced Tyr783 phosphorylation of PLCγ1 in control (5MUT) MDA-MB-231 (Fig. 3A) and A375M (Fig. 3B) cells. Downregulation of PDK1 in these cells completely abrogated the EGF-induced PLCγ1 tyrosine phosphorylation. As expected, inhibition of the PDK1-dependent Akt phosphorylation at its residue Thr308 was also detected in cells lacking PDK1 upon EGF stimulation (Fig. 3A,B). Inhibition of PLCγ1 Tyr783 phosphorylation was also detected in EGF-stimulated MDA-MB-231 treated with the PDK1 inhibitor GSK2334470 (Fig. 3C). These data indicate that PDK1 modulates PLCγ1 activation by regulating phosphorylation of the key residue Tyr783. Interestingly, treatment with the PDK1-specific inhibitor only partially inhibited whereas downregulation of PDK1 completely blocked PLCγ1 Tyr783 phosphorylation. This was not due to partial PDK1 inhibition by GSK2334470 since the inhibitor completely abrogated Akt Thr308 phosphorylation upon EGF stimulation (Fig. 3C). This observation suggested an additional role for PDK1 in regulation of PLCγ1 Tyr783 phosphorylation that is independent from its kinase activity.
Fig. 3.
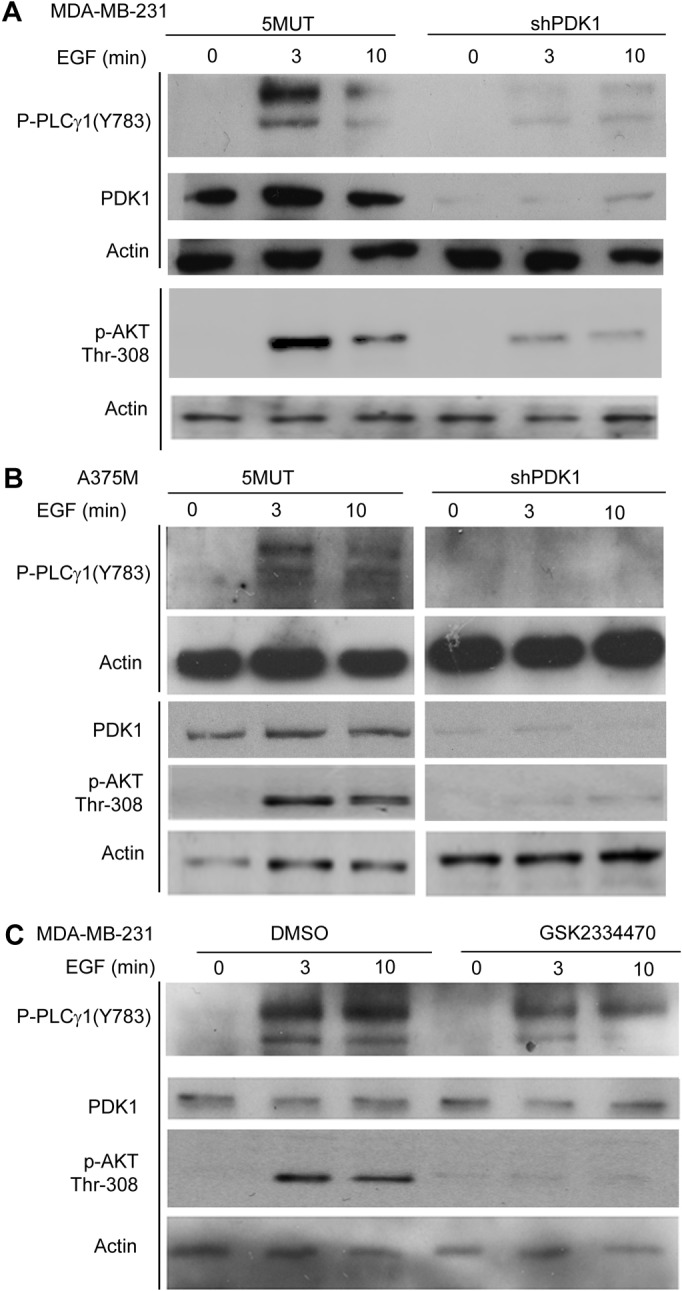
Phosphorylation of PLCγ1 Tyr783 is inhibited upon PDK1 inhibition. (A,B) Representative blot of lysates from stable MDA-MB-231 and A375M cell populations, respectively, expressing the shRNA specifically targeting PDK1 or the 5MUT control shRNA, untreated or stimulated with 50 ng/ml EGF for the indicated times. Phosphorylation of Thr308 Akt in the same lysates was analysed in parallel gels. Anti-actin was used as a loading control. (B) PDK1 levels were determined after stripping of membranes previously incubated with the anti-phosphoThr308 Akt. Anti-actin antibody was used as a loading control. (C) MDA-MB-231 cells were pre-treated with 1 µM GSK2334470 for 30 minutes before stimulation with EGF for the indicated times. PLCγ1 phosphorylation was determined using an anti-phosphoTyr783-specific antibody. Levels of PDK1 and phosphorylation of AKT Thr308 were also analysed. Equal loading was determined using an anti-actin antibody. Data are representative of four independent experiments.
PDK1 associates with PLCγ1
To gain further insight into the mechanisms of PDK1-dependent PLCγ1 activation we first analysed the intracellular localisation of overexpressed PDK1 and PLCγ1 in unstimulated and EGF-stimulated MDA-MB-231 cells. Confocal microscopy analysis indicated that EGF induced a strong colocalisation of the two proteins at the plasma membrane, in particular at the level of cell protrusions (Fig. 4A). We therefore decided to investigate whether the two enzymes could associate in a protein complex. Lysates containing a GST-tagged PDK1 or GST alone (expressed in HEK293 cells) were incubated with lysates from HEK293 overexpressing PLCγ1. GST or GST–PDK1 were then pulled down by glutathione beads. Western blot analysis of the proteins associated with the beads revealed that PLCγ1 was specifically pulled down by GST–PDK1 but not GST alone (Fig. 4B), indicating that the two enzymes can associate in a protein complex. In parallel experiments we analysed PLCγ1 association with distinct GST-tagged PDK1 constructs. First we observed that a GST-tagged isolated PDK1 PH domain was not able to bind PLCγ1 and that a GST-tagged ΔPH PDK1 associated with PLCγ1 (Fig. 4B) indicating that PLCγ1 does not bind to PDK1 PH domain in vitro. This however does not exclude the possibility that the PH domain of PDK1 contributes to the interaction of the two proteins in vivo, likely by targeting PDK1 to the plasma membrane. On the other hand, neither a kinase dead PDK1 nor PIF pocket inactive PDK1 mutant (L155E) were able to associate with PLCγ1 (Fig. 4B), suggesting that alteration of PDK1 catalytic domain or possibly of PDK1 conformation impairs PDK1/PLCγ1 interaction.
Fig. 4.
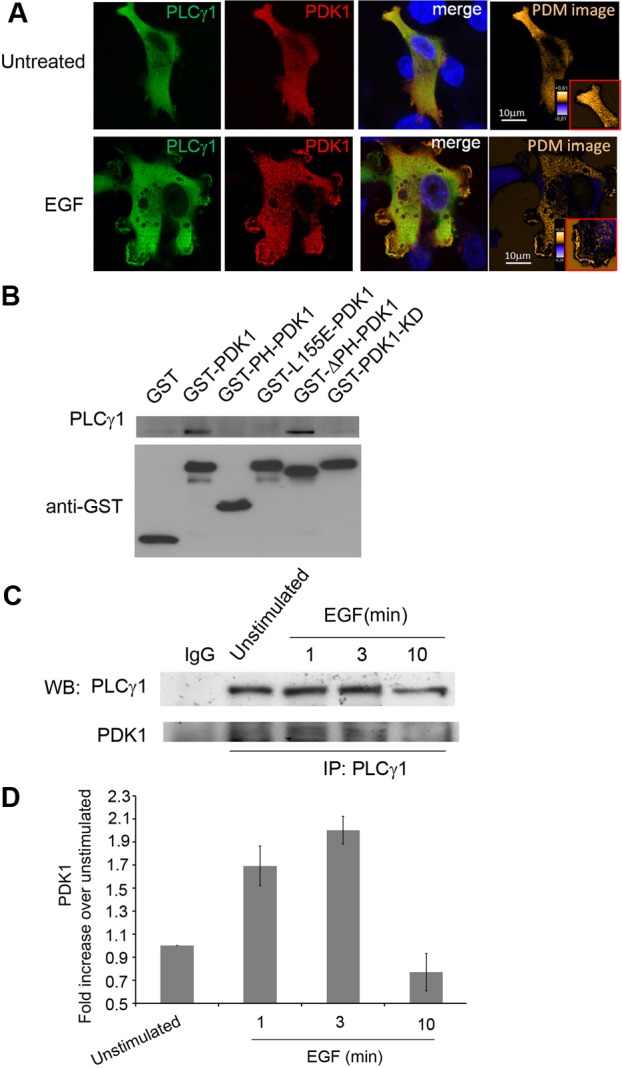
PDK1 associates with PLCγ1 in a protein complex. (A) Serum-starved MDA-MB-231 cells overexpressing PLCγ1 and PDK1 were left untreated or stimulated with EGF for 10 minutes before being fixed and stained with anti-PLCγ1 (green) and anti-PDK1 (red) antibodies. Colocalisation was analysed by confocal microscopy. Pseudo-coloured ‘product of the differences from the mean’ (PDM) images in which each pixel is equal to the PDM value at that location, are shown with a PDM scale. (B) Western blot analysis of PDK1 and PLCγ1 recovered in GST pulldown experiments performed from lysates containing the indicated GST-tagged PDK1 constructs or GST alone (expressed in HEK293 cells) upon incubation with lysates from HEK293 overexpressing PLCγ1. GST or GST–PDK1 proteins were pulled down by glutathione beads. Incubation with anti-GST antibody was used as a loading control. The blot is representative of three independent experiments. (C) Serum-starved MDA-MB-231 cells were left untreated or stimulated with EGF for the indicated times. Co-immunoprecipitation experiments of the endogenous proteins were performed using PLCγ1 antibody, and western blot analysis (WB) was performed using anti-PLCγ1 and anti-PDK1 antibodies. Parallel co-immunoprecipitation with mouse IgG was performed as control. (D) Densitometry analysis performed on three independent co-immunoprecipitation experiments.
To further investigate the hypothesis that PDK1 and PLCγ1 can associate in a protein complex and to investigate whether the association is modulated by EGF stimulation, co-immunoprecipitation experiments were performed using lysates from serum-starved, unstimulated or EGF-stimulated MDA-MB-231 using an anti-PLCγ1 antibody. Association of endogenous PDK1 and PLCγ1 upon different times of EGF stimulation was analysed in the immunocomplexes by western blotting. Data showed that endogenous PDK1 associated with endogenous PLCγ1 specifically upon EGF stimulation (Fig. 4C), with a peak at 3 minutes of stimulation (Fig. 4D).
Taken together these data indicate that PDK1 and PLCγ1 can form a complex, in particular upon EGF stimulation, and provide some indication of the mechanisms by which PDK1 through its association with PLCγ1 can regulate the activity of the lipase.
FRET analysis of PDK1 and PLCγ1 interaction
To further investigate the dynamic of PDK1 and PLCγ1 interaction, steady state Förster Resonance Energy Transfer (FRET) analysis was performed in MDA-MB-231 by FACS analysis. Cells were co-transfected with plasmids to simultaneously overexpress PLCγ1 and PDK1. As controls, MDA-MB-231 cells were co-transfected with GFP vector and either the PLCγ1- or the PDK1-expressing vector alone. The methodology used to detect steady state FRET using FACS analysis relies on increased fluorescence of the acceptor following donor excitation, without direct excitation of the acceptor itself (details of the experimental procedures and controls are discussed in the Materials and Methods section). As shown in Fig. 5A, unstimulated cells showed the same emission profile as the single positive sample. A shift in the acceptor emission profile together with increased acceptor fluorescence was detected upon EGF stimulation (Fig. 5A). Analysis of the acceptor emission profiles showed that stimulation with EGF induced 30% increase of acceptor fluorescence due to FRET occurring between PLCγ1 and PDK1 (Fig. 5B). No increase in fluorescence was detected in cells expressing either PLCγ1 or PDK1 together with a GFP-containing vector (Fig. 5B). These data indicate that EGF stimulation induces association of PLCγ1 and PDK1, consistent with data obtained with co-immunoprecipitation studies.
Fig. 5.

PDK1 interacts with PLCγ1. FRET analysis was performed by FACS (A,B) or confocal microscopy (C–E) as described in the Materials and Methods section. (A) Histogram of the acceptor fluorescence of single positive (control) and unstimulated cells (left), and single positive and EGF-stimulated cells (right) measured by FACS; chart shows acceptor fluorescence intensity over time of acquisition of single positive, unstimulated and EGF stimulated cells. (B) Quantification of fluorescence in the FRET channels measured by FACS in MDA-MB-231 cells transfected with PLCγ1 or pOZ-PDK1 plasmid and labelled with acceptor-dye-conjugated antibody, or expressing a GFP-containing vector (donor) together with PLCγ1 plasmid or pOZ-PDK1 plasmid labelled with acceptor-dye-conjugated antibody. Values are the means ± s.e.m. from three independent experiments. (C) Confocal microscopy images of FRET analysis performed in serum-starved MDA-MB-231 cells coexpressing PLCγ1 (green) and PDK1 (red) that were either untreated or stimulated with EGF. (D) The fluorescence of donor and acceptor (green and red lines, respectively) before and after acceptor photobleaching measured in cells along the line indicated by the red arrow in C. (E) Quantification of FRET measured by acceptor photobleaching in serum-starved MDA-MB-231 overexpressing PLCγ1 alone (+PLCγ1) or PDK1 alone (+PDK1) or coexpressing PLCγ1 and PDK1 (+PLCγ1/+PDK1), untreated or treated with EGF for the indicated times and co-stained with anti-mouse-Alexa-488 and anti-rabbit-Alexa-555-conjugated antibodies. Values are the means ± s.e.m. from three independent experiments. *P<0.05.
To better investigate the mechanisms of PLCγ1 and PDK1 association and to determine the specific intracellular localisation of the PLCγ1/PDK1-containing protein complex, we performed FRET experiments using confocal microscopy analysis. Cells were starved overnight and then left untreated or stimulated with EGF for different times before being fixed. Increase in fluorescence in the donor channel was detected after acceptor's photobleaching. Donor fluorescence was measured at the level of membrane protrusions (induced by EGF stimulation) and in more cytoplasmic regions. Images presented in Fig. 5C and supplementary material Fig. S3A show the fluorescence intensity of the donor before and after photobleaching for each time point in chosen regions. The merged channel shows where the acceptor was photobleached. Arrows indicate representative regions where donor fluorescence change was measured and value collected for statistical analysis. Charts (Fig. 5D; supplementary material Fig. S3B) show the donor fluorescence (green line) before and after photobleaching of the acceptor (red line) of the corresponding regions. FRET occurred after 1 minute and 3 minutes of EGF stimulation where drop of fluorescence of the acceptor following photobleaching and increased fluorescence of the donor were detected. Specifically, photobleaching of the acceptor caused a significant increase of fluorescence in the donor channel after 3 minutes of stimulation with EGF, indicative of FRET (Fig. 5E), consistent with results obtained in co-immunoprecipitation experiments of endogenous PLCγ1 and PDK1 (Fig. 4C,D). No change in donor fluorescence was detected in internal cytoplasmic region after acceptor photobleaching (Fig. 5E). No FRET was detected in cells overexpressing either PLCγ1 or PDK1 alone and co-stained with both Alexa-488 and Alexa-555 (Fig. 5E) or stained with the corresponding secondary Alexa-488 antibody (supplementary material Fig. S3C). Similarly, no FRET was observed in cells overexpressing both PLCγ1 and PDK1 and stained with Alexa-488 alone (supplementary material Fig. S3C). These data support the previous conclusion that PLCγ1 and PDK1 associate upon EGF stimulation and further indicate that the association occurs in well-defined regions corresponding to cellular protrusions induced by EGF.
The PDK1-dependent PLCγ1 activation regulates cell invasion
We next investigated the functional relevance of this newly identified PDK1–PLCγ1 signalling cascade. As mentioned before, both PLCγ1 and PDK1 have been implicated in migration and experimental metastasis of breast cancer cells, therefore we first used this cellular model to investigate a potential role for PDK1 in this process. We observed that stable downregulation of PDK1 reduced invasion of MDA-MB-231 on Matrigel (Fig. 6A). Similar results were obtained upon downregulation of PDK1 in melanoma cells A375M (Fig. 6B) and when invasion was monitored in both cell lines using organotypic cultures as an alternative and complementary assay (Fig. 6C,D). These data demonstrate that PDK1 has a role in invasion in distinct cellular models, consistent with data in literature (Pinner and Sahai, 2008; Liu et al., 2009). Stable PDK1 knock down did not affect MDA-MB-231 cell proliferation (supplementary material Fig. S4A), consistent with previous data obtained in the same cell line upon PDK1 downregulation (Nagashima et al., 2011) whereas it inhibited proliferation of A375M (supplementary material Fig. S4B). Similar results were obtained in MDA-MB-231 and A375M upon treatment with GSK2334470 (supplementary material Fig. S4C,D). No difference in ERK phosphorylation was detected between stable knock down and control cells (supplementary material Fig. S4E).
Fig. 6.

Inhibition of PDK1 blocks cancer cell invasion. (A,B) Results from an invasion assay of the indicated MDA-MB-231 and A375M stable cell populations on Matrigel. (C,D) Haematoxylin and Eosin staining of organotypic cultures of the indicated cells. Arrows indicate invading cells. Images are representative of two independent experiments for each cell line. Higher magnification views of the boxed regions are shown on the right of each image. (E) Results from invasion assay of MDA-MB-231 transiently transfected with siRNA targeting PDK1 or scrambled siRNA. (F) Results from invasion assay of A375M transiently transfected with scrambled siRNA or siRNAs targeting PDK1 or PLCγ1. Representative images of invading cells stained with Crystal Violet, and western blots confirming proteins downregulation, are also shown. All graphs show the number of invaded cells/field expressed as a percentage of control (5MUT or scrambled cells, respectively) and are means ± s.e.m. from three independent experiments. *P<0.05.
To confirm the specific inhibitory effect of PDK1 silencing, cell invasion was monitored in cells upon transient downregulation of PDK1 using specific siRNA. Consistent with data obtained with stable knock down, transient silencing of PDK1 inhibited invasion of MDA-MB-231 (Fig. 6E) and A375M (Fig. 6F). Transient downregulation of PLCγ1 also reduced invasion of A375M (Fig. 6F). Taken together these data indicate that PDK1 and PLCγ1 are both required to promote invasion of MDA-MB-231 and A375M cells.
To determine whether the two enzymes act in the same cellular signalling pathway, we tested the effect of the PDK1 inhibitor GSK2334470 on stable cell lines expressing a shRNA targeting PLCγ1 or a mutated (3MUT) shRNA unable to target PLCγ1. Treatment of control 3MUT cells with GSK2334470 significantly inhibited invasion of MDA-MB-231 and A375M (Fig. 7A,B), consistent with results obtained using stable and transient PDK1 downregulation. Stable downregulation of PLCγ1 inhibited cell invasion in both cellular models (Fig. 7A,B). Importantly, treatment of cells lacking PLCγ1 with GSK2334470 did not further reduce cell invasion (Fig. 7A,B) indicating that inhibition of PDK1 in cells lacking PLCγ1 has no additive inhibitory effect on cell invasion. As a complementary approach, we then investigated the effect of transient downregulation of PLCγ1 on invasion of stable PDK1 knock down (shPDK1) and control (5MUT) cells. MDA-MB-231 and A375M 5MUT and shPDK1 cells were transiently transfected with either the specific siRNA targeting PLCγ1 or with the non-targeting, scrambled siRNA. A clear inhibition of cell invasion was detected in 5MUT MDA-MB-231 and 5MUT A375M cells transfected with the PLCγ1-targeting siRNA compared to 5MUT cells transfected with the scrambled siRNA (Fig. 7C,D). Invasion was similarly inhibited in shPDK1 MDA-MB-231 and shPDK1 A375M cells transfected with the non-targeting scrambled siRNA compared to the corresponding 5MUT/scrambled siRNA cells (Fig. 7C,D). Importantly, no further reduction in cell invasion was detected in shPDK1 cells transfected with PLCγ1 siRNA compared to shPDK1 cells transfected with the scrambled siRNA (Fig. 7C,D) indicating that downregulation of PLCγ1 in cells lacking PDK1 has no additive inhibitory effect on cell invasion.
Fig. 7.
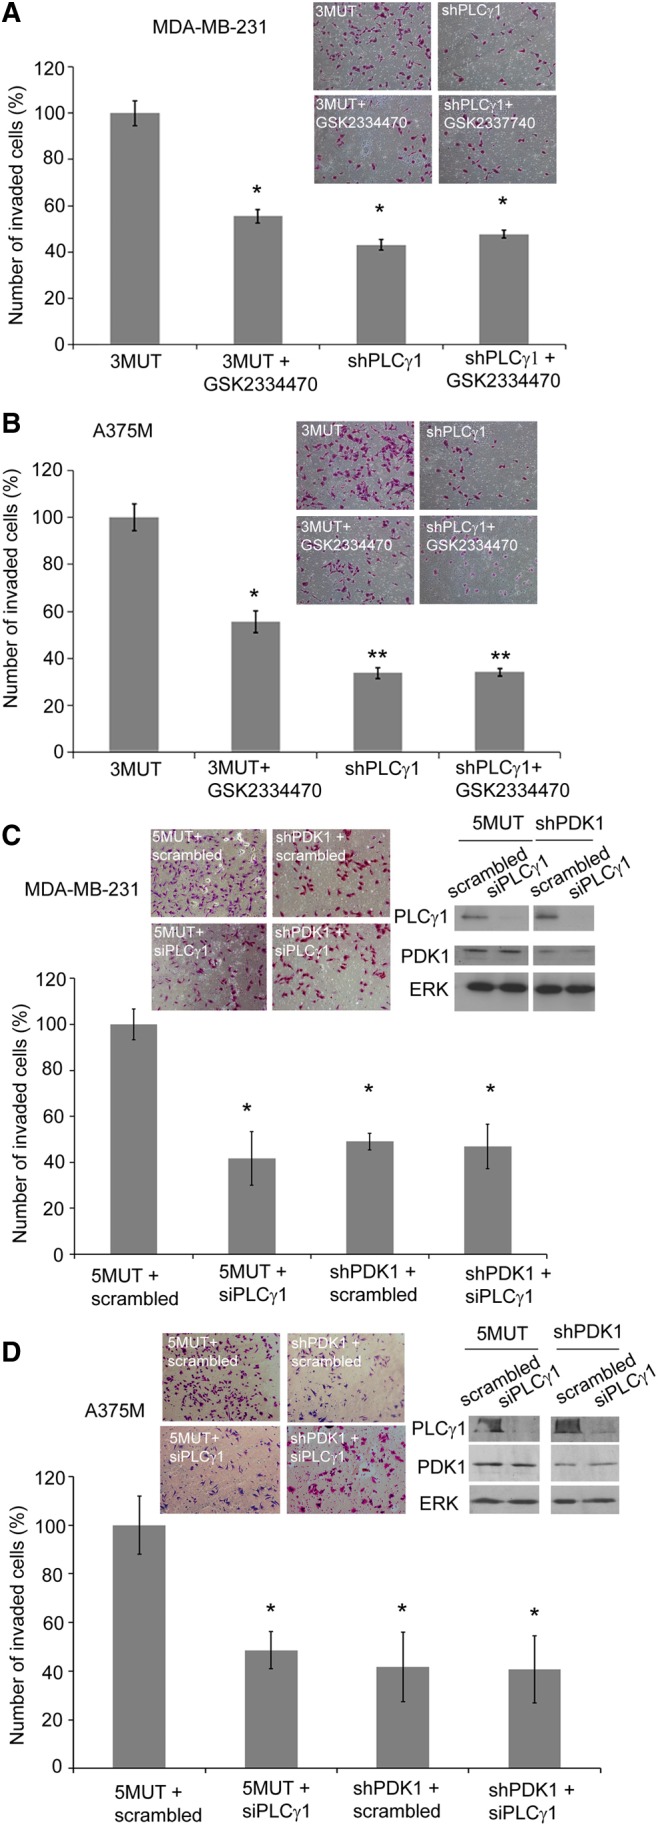
Simultaneous inhibition of PDK1 and PLCγ1 does not enhance the effect of inhibition of PDK1 or PLCγ1 alone on cell invasion. (A,B) Results from an invasion assay performed with MDA-MB-231 and A375M cells, respectively, expressing shRNA targeting PLCγ1 or a 3MUT non-targeting sequence, and treated with 1 µM GSK2334470. (C,D) Results from invasion assay performed with the indicated MDA-MB-231 and A375M stable cell populations transiently transfected with scrambled siRNA or siRNA targeting PLCγ1. In all panels data are the number of invaded cells per field expressed as a percentage of control (5MUT or 3MUT cells, respectively). Blots in figure show the levels of PDK1 or PLCγ1 in the indicated cells. Anti-ERK2 antibody was used as a loading control. Inserts show representative images stained with Crystal Violet. In all panels values are means ± s.e.m. from three independent experiments performed in duplicate. *P<0.05. **P<0.01.
These data suggest that PDK1 and PLCγ1 act on the same signalling cascade and that the PDK1/PLCγ1 pathway is required for regulation of cell invasion.
Discussion
This study demonstrates for the first time that PDK1 can regulate PLCγ1 activation in a mechanism involving assembly of a complex between the two enzymes upon growth factor stimulation. These results shed a brand new and unexpected light on two of the main enzymes involved in signal transduction.
Since its identification as the kinase responsible for phosphorylation and activation of Akt, the role of PDK1 in signalling and regulation of cellular processes has been almost exclusively focused on its involvement in Akt activation. With the accumulation of data demonstrating the key role of Akt in several cellular functions and in cancer development and progression, for several years PDK1 has been completely shadowed by the huge interest on Akt. Less attention has been focussed on the role of PDK1 in activation of several other enzymes which also control many important cellular functions. More recently a renewed attention has been paid to PDK1 and it has become increasingly evident that the importance of PDK1 in physiological conditions goes far beyond Akt activation. Moreover, it has become clear that the role of PDK1 in cancer is not limited to Akt activation which has also fuelled a novel interest in developing specific PDK1 inhibitors as potential anti-cancer drugs (Raimondi and Falasca, 2011).
Results presented in this manuscript fit into this renewed interest towards PDK1 and add very important and brand new information, with relevance from both a physiological and therapeutic point of view. We demonstrate that inhibition of PDK1 by siRNA- or shRNA-mediated downregulation of the enzyme or by using a specific PDK1 inhibitor blocks PLCγ1 activation in distinct cell lines. In this respect our data identify a novel and unexpected target for PDK1. While enzymes activated by PDK1 mostly belong to the AGC kinases family our data reveal for the first time that PDK1 can also regulate activation of the lipase PLCγ1, a complete distinct enzyme from AGC kinases. Although chemical inhibition of PDK1 affects PLCγ1 tyrosine phosphorylation and activation, the mechanism of PDK1-dependent PLCγ1 activation appears to mainly involve assembly of a protein complex between the two enzymes which is regulated by growth factor stimulation and occurs in particular at the level of cellular protrusions. Whether other enzymes can be controlled by PDK1 in a similar manner is an interesting question that now needs to be answered.
Our results also add new information towards our understanding of the mechanism of PLCγ1 activation. PLCγ1 has been extensively investigated over the years because of its role in mediating activation of key signalling pathways downstream of several growth factor receptors stimulation. It has been long known that tyrosine phosphorylation of the enzyme is critical but not sufficient for the full activation of PLCγ1 (Sekiya et al., 2004; Maffucci and Falasca, 2007). Among the alternative and/or complementary mechanisms of activation, PI3K has been shown to be important for PLCγ1 activation (Bae et al., 1998; Falasca et al., 1998) although the precise contribution of PI3K to this event has been elusive for long time. Our data here reveal that PDK1 can represent the missing link between PI3K and PLCγ1 in a mechanism likely involving the PI3K-dependent translocation of both PDK1 and PLCγ1 to the plasma membrane and assembly of the PDK1–PLCγ1 complex (Fig. 8). This mechanism would guarantee a double control of PLCγ1 by PI3K, through the PH domain–PtdIns(3,4,5)P3 interaction and the PDK1–PLCγ1 assembly. The consequences of this discovery are multiple since PLCγ1 can control many cellular functions therefore it will be important to understand how many of the PLCγ1-dependent cellular functions are controlled through a PDK1-dependent mechanism.
Fig. 8.
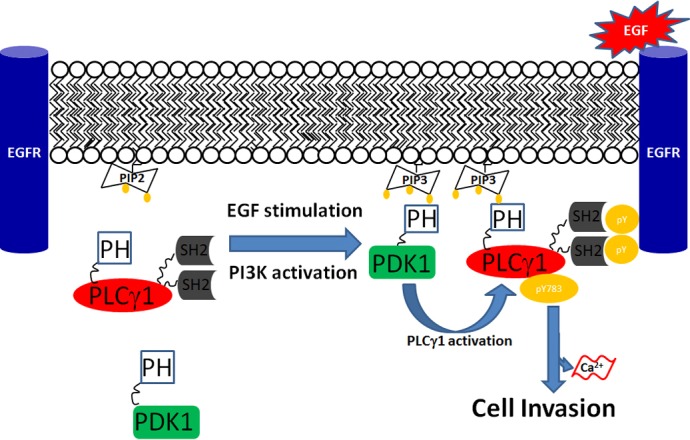
Schematic representation of the potential mechanism of PDK1-dependent PLCγ1 regulation. In unstimulated conditions, EGF receptor is not phosphorylated, PI3K is not activated and both PDK1 and PLCγ1 are confined in the cytosol. Upon EGF stimulation, EGF receptor is phosphorylated, PI3K is activated and PtdIns(4,5)P2 is converted to PtdIns(3,4,5)P3. Binding of the PH domain of PDK1 to PtdIns(3,4,5)P3 recruits the enzyme to the plasma membrane. PLCγ1 is also recruited to the plasma membrane through a similar PH domain–PtdIns(3,4,5)P3 interaction and it is further associated with the phosphorylated tyrosine residues of the receptor through its SH2 domains. The PDK1-dependent-PLCγ1 activation guarantees a further level of interaction and further stabilises the association of PLCγ1 to the receptor, which allows PLCγ1 tyrosine phosphorylation at Tyr783.
We demonstrate here that this novel PDK1–PLCγ1 pathway is specifically involved in regulation of cell invasion, in particular of breast cancer and melanoma cells. A role for PDK1 in control of cancer cell migration was previously demonstrated by data indicating that co-overexpression of PDK1 and of the active mutant rat homolog of ERBB2 in MCF10A increased cell motility (Maurer et al., 2009) and that downregulation or inhibition of PDK1 inhibited Matrigel cell invasion in breast cancer cell lines, prostate cancer and melanoma (Pinner and Sahai, 2008). The precise mechanisms by which PDK1 regulates this process are not fully understood. It has been reported that PDK1 can control cancer cell motility by regulating cortical acto-myosin contraction in a mechanism involving activation of ROCK1 (Pinner and Sahai, 2008). Recently it has been shown that PDK1 regulates invadopodia formation in breast cancer cells (Yamaguchi et al., 2011). Interestingly, although a role for Akt in this process has also been reported in this study, downregulation of PDK1 reduced the number of cells presenting invadopodia much strongly than downregulation of Akt (Yamaguchi et al., 2011). Our results add important information towards a full understanding of the contribution of PDK1 to cell invasion by identifying PLCγ1 as a novel downstream effector that PDK1 can activate to control this cellular process. Whether the PDK1/PLCγ1 pathway regulates invadopodia formation or ROCK1 activation or distinct processes involved in cell invasion remains to be investigated.
More importantly accumulating evidence now suggests that PLCγ1 plays a key role in metastasis development (Wells and Grandis, 2003; Sala et al., 2008) and progression (Sala et al., 2008). Reduced primary tumour spreading and invasion was detected in mice injected with DU145 prostate cancer cells expressing a dominant negative mutant of PLCγ1. Furthermore, the expression of this mutant specifically in the breast and prostate decreased the invasiveness of primary tumours and reduced formation of distant lung metastasis without affecting the size of the primary tumour size (Shepard et al., 2007). Consistent with these data, we demonstrated that downregulation of PLCγ1 inhibited the development of breast cancer MDA-MB-231 cells-derived lung metastases without affecting the primary tumour (Sala et al., 2008). The identification of PDK1 as a key upstream regulator of PLCγ1 strongly suggests that PDK1 has also an important role in metastasis development and progression through regulation of PLCγ1 activation.
In this respect it is worth mentioning that increased copy number of PDK1 is often present in human breast cancer compared to normal breast epithelia and correlates with the presence of activating mutation of class I PI3K p110α or with ERBB2 overexpression (Maurer et al., 2009). Similarly, increased PLCγ1 expression was reported in breast carcinoma samples compared to healthy tissue (Arteaga et al., 1991) and we recently reported that the enzyme accumulates in metastasis compared to the primary tumour (Sala et al., 2008). Importantly, we demonstrated that downregulation of PLCγ1 after metastasis had developed was able not only to block metastasis spreading but also to revert it (Sala et al., 2008). These data, together with evidence indicating that pharmacological inhibition of PLCγ1 is able to inhibit in vitro Matrigel invasion of breast and prostate cancer cells (Kassis et al., 1999) strongly suggest that inhibition of the PDK1/PLCγ1 pathway may represent a novel strategy to counteract metastasis progression. In this respect, breast and melanoma cancer cells downregulated for PLCγ1 show no additive inhibition of cell invasion in vitro when treated with the PDK1-specific inhibitor GSK2334470. These data suggest PLCγ1 as one of the main downstream target of PDK1 to promote cancer cell invasion. Therefore pharmacological inhibition of the novel PDK1/PLCγ1 pathway may have important therapeutic relevance.
In conclusion this study has demonstrated for the first time that PDK1 can control PLCγ1 activation and regulate cell invasion. The identification of a direct link between two of the most studied enzymes in signal transduction is likely to have profound consequences and redefine our understanding of several cellular processes controlled by PDK1 and PLCγ1.
Materials and Methods
Cell culture and transfections
MDA-MB-231 and HEK293 were cultured in DMEM (Invitrogen, UK); A375M and PC3 were cultured in RPMI 1640 (Invitrogen or PAA, UK). Media were supplemented with 10% (v/v) foetal bovine serum (Invitrogen), sodium pyruvate 1% (v/v), 1× L-glutamine/penicillin/streptomycin (Invitrogen) and 0.1% gentamycin (v/v) (Invitrogen, UK). PDK1+/+ and PDK1−/− ES cells were kindly provided by Dario Alessi (University of Dundee, UK) and cultured as previously described (Williams et al., 2000). siRNA transfection was performed using Oligofectamine (Invitrogen, UK) for MDA-MB-231 and PC3 or Hiperfect (Qiagen, UK) for A375M. SMARTpool siRNA targeting PDK1 and PLCγ1 were purchased from Dharmacon, USA. Stable or inducible cell lines knockdown for PLCγ1 were previously described (Sala et al., 2008). For stable downregulation of PDK1 a sequence targeting the human PDK1 mRNA was subcloned into pSUPERIOR.retro.puro vector (5′-CAAGAGACCTCGTGGAGAA-3′). Control vector pSUPERIOR.retro.puro 5MUT contains a five-point mutated sequence unable to target the human PDK1 mRNA (5′-GACAGGAGGTCAAGGATTTGA-3′). Single MDA-MB-231 clones (Fig. 1B) were selected in 1 µg/ml puromycin upon transfection of the pSUPERIOR-based constructs using LipofectAMINE (Invitrogen, UK). MDA-MB-231 and A375M used in the rest of the study were cell populations generated by retroviral infection as previously described (Sala et al., 2008).
Western blot analysis
Cells were lysed in lysis buffer containing 50 mmol/l Tris-HCl (pH 7.4), 5 mmol/l EDTA, 0.1% NP40, 250 mmol/l NaCl, and proteases inhibitors cocktail 2 (Sigma-Aldrich, UK). Lysates were then centrifuged at 13,000 rpm for 10 min at 4°C, and the protein concentration was determined using a Bio-Rad assay kit (Bio-Rad). Forty micrograms of proteins were separated on SDS-PAGE and transferred to a nitrocellulose membrane (Whatman, USA). Membranes were probed with the indicated primary antibodies. Antibodies were as follows: phosphoTyr783 PLCγ1, phosphoThr308 Akt and PDK1 from Cell Signaling Technology, USA; PLCγ1, ERK2 and Actin from Santa Cruz Biotechnology, USA.
Intracellular calcium measurement
Cells were seeded on glass-bottomed chambers (Labtek, UK) and serum-starved overnight. For experiments with siRNAs, cells were detached 24 hours after transfection, seeded on the glass-bottomed chambers and serum-starved overnight the following day. Each well was then incubated with 200 µl of HBSS (Invitrogen, UK), containing 0.5% BSA, 2 mM CaCl2, 4 µM Fluo-4-AM (Invitrogen, UK) for 45 minutes at 37°C. After loading, cells were washed twice in HBSS 0.5% BSA 2 mM CaCl2 and left in the same solution for 30 minutes for de-esterification of the Fluo-4-AM dye. Where indicated inhibitors were added during the de-esterification step for 30 minutes. Samples were then analysed using the LSM 510 inverted confocal microscope equipped with a chamber for live imaging at 37°C supplied with 5% CO2 using a 20× objective. After recording basal fluorescence, cells were then stimulated with EGF (20 ng/ml) and fluorescence was measured for 6 minutes. Thirty cells were gated and variation of fluorescence intensity was measured for each sample. The average of intensity per time point was calculated.
Analysis of inositol phosphates accumulation
Cells were labelled with [3H]myo inositol (PerkinElmer) in inositol free medium M199. After 24 h, cells were incubated in M199 containing 10 mM Hepes and 20 mM LiCl for 15 min before stimulation with 50 ng/ml EGF for the indicated times, then lysed in 0.1 M formic acid. In the case of GSK2334470 treatment, cells were pre-incubated with 1 µM of GSK2334470 for 30 minutes and stimulated in the presence of the inhibitor. Cells treated with DMSO were used as control. Total inositol phosphates were separated by anion exchange chromatography using AG 1-X8 resin (formate form, 200–400 mesh, Bio-Rad) and the total amount assessed by liquid radioactivity counting.
Confocal microscopy analysis
MDA-MB-231 cells were co-transfected with PRK5-PLCγ1 and pOZ-PDK1 or with pEGFP and PRK5-PLCγ1 or with pEGFP and pOZ-PDK1. Twenty four hours after transfection cells were serum deprived overnight. The following day, cells were stimulated with serum free DMEM containing EGF (50 ng/ml) for the indicated times before being fixed in paraformaldehyde 4% (v/v) for 30 minutes at RT. Cells were permeabilised in PBS/0.25% Triton X-100 for 2.5 minutes at RT. Unspecific staining was prevented by blocking the coverslips with a solution PBS/0.1% of BSA for 30 minutes at RT. Coverslips were then incubated overnight with primary antibodies (anti-mouse PLCγ1 and anti-rabbit PDK1 diluted 1:50 in PBS/0.1% BSA). Coverslips were then washed 3× with PBS/0.1% BSA, incubated with secondary antibodies anti-mouse Alexa-488 (Invitrogen, UK) and anti-rabbit Alexa-555 (Invitrogen, UK) and analysed using a Carl Zeiss LSM 510 Meta confocal microscope using a Zeiss plan apochromat 63× 1.4 NA (oil) lens. Colocalisation analysis was performed using ImageJ (Macbiophonics). Pseudo-coloured ‘product of the differences from the mean’ (PDM) image was calculated by the program as: PDM = (red intensity− mean red intensity) × (green intensity − mean green intensity).
GST pull-down assay
Three sets of three 6-cm Petri dishes of HEK293 were transfected with PRK5-PLCγ1, pEBG2T-MYC-PDK1, pEBG2T-MYC-PDK1-L155E, pEBG2T-MYC-PDK1-D223A (PDK1 Kinase-Dead), pEBG2T-MYC-PDK1-(2–450) (PDK1-ΔPH-PDK1), pEBG2T-PDK1 (408–end) (PH-PDK1) and pEBG2T-GST empty vector, respectively. All GST constructs were kindly provided by Dario Alessi. Twenty-four hours after transfection, cells were lysed in lysis buffer (50 mM Tris pH 8.0, 50 mM KCl, 1% NP-40) containing protease and phosphatases inhibitors (Sigma-Aldrich, UK). Lysates were cleared by centrifugation at 10,000 g for 3 minutes at 4°C. 500 µg of HEK293 overexpressing GST–empty-vector and 500 µg of HEK293 lysate overexpressing GST–PDK1 were incubated separately with 20 µl of G4510 glutathione–Sepharose beads (Sigma-Aldrich) for 1 hour at 4°C. Beads were washed 3× in washing buffer for 5 minutes at 4°C and incubated with 500 µg of protein lysates from HEK293 overexpressing PLCγ1, overnight on a rotating wheel at 4°C in a total volume of 1 ml. The following day beads were collected, washed 3× with lysis washing buffer, resuspended in 50 µl of denaturing sample buffer and heated at 95°C for 5 minute. Supernatant was analysed by SDS-PAGE and western blotting.
Co-immunoprecipitation
Three confluent 10-cm Petri dishes of MDA-MB-231 cells were used for these experiments. Serum-starved cells were left untreated or stimulated with EGF for the indicated times. Cells were lysed using NP-40 lysis buffer [50 mM Tris pH 8.0, 50 mM KCl, 1% (v/v) NP-40] containing protease and phosphatase inhibitors (Sigma-Aldrich, UK). One mg of protein lysates were mixed with 3 µg of anti-PLCγ1 antibody (Santa Cruz Biotechnology, USA) or control mouse IgG and incubated overnight at 4°C. The following day the mix was centrifuged at 10,000 g for 3 minutes and incubated with 30 µl of protein G Sepharose 4 fast flow (GE Healthcare, UK) on a rotating wheel at 4°C for 1 hour. Beads were centrifuged at 2000 g for 1 minute. Supernatant was removed, beads were washed three times with lysis buffer on a rotating wheel at 4°C for 5 minutes and finally resuspended in 50 µl of 2× sample buffer and heated at 95°C for 5 minutes. The supernatant was analysed by SDS-PAGE and western blotting.
FRET measurement by FACS
MDA-MB-231 cells were transfected with pOZ-PDK1 and PRK5-PLCγ1 either individually or in combination. In addition cells were co-transfected with pEGFP and pOZ-PDK1 vectors or with pEGFP and PRK5-PLCγ1. Cells transfected with pCDNA empty vector were used as control. Twenty-four hours after transfection, cells were serum-starved overnight and then detached by incubation with PBS + 0.2% EGTA (w/v) solution for 20 minutes. Cells were centrifuged at 1200 rpm for 5 minutes and resuspended in 1 ml of serum-free medium supplemented with EGF (50 ng/ml) for 5 and 10 minutes. Cells where then fixed in 2% paraformaldehyde solution for 15 minutes and permeabilised using PBS/0.25% Triton X-100 solution for 2.5 minutes at RT. Cells were centrifuged and resuspended in PBS/0.1% BSA blocking solution for 30 minutes at RT, then pelletted and resuspended in 400 µl blocking solution containing anti-PLCγ1 or anti-PDK1 antibodies either individually or in combination. Cells were incubated overnight at 4°C. The following day cells were centrifuged at 1200 rpm for 5 minutes and washed three times for 5 minutes in blocking solution before being resuspended in 500 µl of blocking solution containing anti-mouse or anti-rabbit Alexa-555-conjugated secondary antibodies and incubated for 1 hour at room temperature. Cells were washed three times and resuspended in PBS for FACS analysis with a Canto II FACS (Becton, Dickinson BD; UK). Cells were gated according to forward and sideward scatter (FSC/SSC). All samples were excited with 488 nm laser and emission measured at 555 nm. The single positive samples stained with Alexa-555-conjugated secondary antibodies allowed to measure the background emission of the dye when excited with the 488 nm laser. The single positive samples stained with Alexa-488-conjugated secondary antibodies allowed removing of bleed-through fluorescence of the donor (Alexa-488) in the FRET channel adjusting the photomultiplier tube (PMT) voltages and compensation for Alexa-488 and Alexa-555 dyes to specifically assess FRET in double-positive cells. Cells co-transfected with pEGFP and PLCγ1 or PDK1 were used as negative control of FRET and acquired using FACS Diva software (Becton, Dickinson BD; UK). Data were analysed with FlowJo Software (Treestar, US).
FRET by acceptor photo-bleaching
Cells were treated as for confocal microscopy analysis. Spectral imaging analysis was performed on Carl Zeiss LSM 510 Meta. Cells were imaged with excitation λ = 488 nm and λ = 543 laser line and emission spectra were collected respectively in two different channels of the PMT detector. Reference spectra were generated from coverslips incubated separately with the two Alexa-conjugated secondary antibodies alone in order to generate single positive sample and all data were corrected for crosstalk and background fluorescence. Furthermore cells overexpressing PLCγ1 or PDK1 or coexpressing PLCγ1 and PDK1 were stained with Alexa-555-conjugated antibodies in order to examine crosstalk and background fluorescence in overexpressing conditions. The FRET efficiency was measured by acceptor photo-bleaching as previously described (Guillaud et al., 2008). A selected area of the cell was repeatedly photobleached with λ = 543 nm laser line at full power for 1 minute and FRET efficiency was measured as the increase (or dequenching) of donor fluorescence after photo-bleaching in the selected area. All fluorescence measurements were performed in MetaMorph software (Molecular Devices Inc., USA).
Two independent areas in the bleached zone and one area in the non-bleached zone were analysed in parallel to ensure that the FRET efficiency values were not artefacts due to the photo-bleaching protocol. FRET efficiency was calculated using the following equation: E = [1 – (Donor.before – BCK.before) / (Donor.after – BCK.after)] × 100, where Donor.before is the fluorescence intensity of PLCγ1 before photobleaching, BCK.before is the background intensity before photobleaching, Donor.after is the fluorescence intensity of PLCγ1 after photobleaching and BCK.after is the background intensity after photobleaching. As a negative control, GFP was used as donor to validate the system.
Invasion assay
MDA-MB-231 and A375M were serum-starved overnight before the experiment. The following day Matrigel pre-coated Transwell inserts (8.0 µm pores, 10 mm diameter; BD Biosciences, UK) were rehydrated. Where indicated, cells were pre-treated with 1 µM GSK22334470 (GlaxoSmithKline, UK) for 30 minutes and then allowed to invade in presence of the inhibitor. After 36 hours the upper face of the porous membrane was cleaned with a cotton bud and cells that invaded the Matrigel were fixed with paraformaldehyde and stained with 0.1% Crystal Violet solution for 10 minutes. A Leica phase-contrast light microscope using a 10× magnification objective was used for manual counting. A minimum of five fields was counted per insert. Each invasion experiment was performed in duplicate and the average of invading cells/fields was calculated.
Organotypic cultures
Organotypic cultures were grown on collagen:Matrigel gels as previously described with some modifications (Nyström et al., 2005) in triplicate. Collagen:Matrigel (70:30) gels were prepared mixing type I collagen (First Link, UK), Matrigel (BD Biosciences, UK), 1 volume of 10× DMEM, 1 volume of FBS and 1 volume of DMEM with 10% FBS containing human fibroblasts (re-suspended at a density of 5×10⁶/ml). One ml of the gel mixture was placed into each well of a 24-well plate and allowed to polymerase at 37°C for 2 hours. After polymerization, 1 ml of DMEM or RPMI 10% FBS, containing MDA-MB-231 or A375M at a density of 5×10⁵ per gel respectively, expressing PDK1 shRNA or 5MUT shRNA non-targeting sequence was added on top of the gels. After 24 hours, the gels were raised to the air–liquid interface on stainless steel grids. The gels were harvested at day 10, fixed and Haematoxylin and Eosin staining was performed.
Statistical analysis
Statistical analyses were performed using the one-tailed, paired Student's t-test, using Microsoft Excel.
Supplementary Material
Acknowledgments
We thank Dirk Heerding (Glaxo SmithKline) for PDK1 inhibitor GSK2334470 and Dario Alessi for providing the GST-tagged PDK1 constructs, PDK1-deficient ES cells and control cells. We also thank Arturo Sala (University College London) and Banafshé Larijani (Cancer Research UK, London Research Institute) for critical reading of the manuscript, and Gary Warnes for help with the FRET experiments.
Footnotes
Funding
This work was supported by Prospect Funds Queen Mary Innovation (to M. F.) and Wellcome Trust Investors in People. Deposited in PMC for release after 6 months.
Supplementary material available online at http://jcs.biologists.org/lookup/suppl/doi:10.1242/jcs.100511/-/DC1
References
- Arteaga C. L., Johnson M. D., Todderud G., Coffey R. J., Carpenter G., Page D. L. (1991). Elevated content of the tyrosine kinase substrate phospholipase C-gamma 1 in primary human breast carcinomas. Proc. Natl. Acad. Sci. USA 88, 10435–10439 10.1073/pnas.88.23.10435 [DOI] [PMC free article] [PubMed] [Google Scholar]
- Bae Y. S., Cantley L. G., Chen C. S., Kim S. R., Kwon K. S., Rhee S. G. (1998). Activation of phospholipase C-gamma by phosphatidylinositol 3,4,5-trisphosphate. J. Biol. Chem. 273, 4465–4469 10.1074/jbc.273.8.4465 [DOI] [PubMed] [Google Scholar]
- Bayascas J. R. (2010). PDK1: the major transducer of PI 3-kinase actions. Curr. Top. Microbiol. Immunol. 346, 9–29 10.1007/82_2010_43 [DOI] [PubMed] [Google Scholar]
- Bunney T. D., Katan M. (2011). PLC regulation: emerging pictures for molecular mechanisms. Trends Biochem. Sci. 36, 88–96 10.1016/j.tibs.2010.08.003 [DOI] [PubMed] [Google Scholar]
- Clayton E., Bardi G., Bell S. E., Chantry D., Downes C. P., Gray A., Humphries L. A., Rawlings D., Reynolds H., Vigorito E.et al. (2002). A crucial role for the p110delta subunit of phosphatidylinositol 3-kinase in B cell development and activation. J. Exp. Med. 196, 753–763 10.1084/jem.20020805 [DOI] [PMC free article] [PubMed] [Google Scholar]
- Falasca M., Logan S. K., Lehto V. P., Baccante G., Lemmon M. A., Schlessinger J. (1998). Activation of phospholipase C gamma by PI 3-kinase-induced PH domain-mediated membrane targeting. EMBO J. 17, 414–422 10.1093/emboj/17.2.414 [DOI] [PMC free article] [PubMed] [Google Scholar]
- Guillaud L., Wong R., Hirokawa N. (2008). Disruption of KIF17-Mint1 interaction by CaMKII-dependent phosphorylation: a molecular model of kinesin-cargo release. Nat. Cell Biol. 10, 19–29 10.1038/ncb1665 [DOI] [PubMed] [Google Scholar]
- Kassis J., Moellinger J., Lo H., Greenberg N. M., Kim H. G., Wells A. (1999). A role for phospholipase C-gamma-mediated signaling in tumor cell invasion. Clin. Cancer Res. 5, 2251–2260 [PubMed] [Google Scholar]
- Kim Y. J., Sekiya F., Poulin B., Bae Y. S., Rhee S. G. (2004). Mechanism of B-cell receptor-induced phosphorylation and activation of phospholipase C-gamma2. Mol. Cell. Biol. 24, 9986–9999 10.1128/MCB.24.22.9986-9999.2004 [DOI] [PMC free article] [PubMed] [Google Scholar]
- Kölsch V., Charest P. G., Firtel R. A. (2008). The regulation of cell motility and chemotaxis by phospholipid signaling. J. Cell Sci. 121, 551–559 10.1242/jcs.023333 [DOI] [PMC free article] [PubMed] [Google Scholar]
- Liu Y., Wang J., Wu M., Wan W., Sun R., Yang D., Sun X., Ma D., Ying G., Zhang N. (2009). Down-regulation of 3-phosphoinositide-dependent protein kinase-1 levels inhibits migration and experimental metastasis of human breast cancer cells. Mol. Cancer Res. 7, 944–954 10.1158/1541-7786.MCR-08-0368 [DOI] [PubMed] [Google Scholar]
- Maffucci T., Falasca M. (2007). Phosphoinositide 3-kinase-dependent regulation of phospholipase Cgamma. Biochem. Soc. Trans. 35, 229–230 10.1042/BST0350229 [DOI] [PubMed] [Google Scholar]
- Maffucci T., Raimondi C., Abu–Hayyeh S., Dominguez V., Sala G., Zachary I., Falasca M. (2009). A phosphoinositide 3-kinase/phospholipase Cgamma1 pathway regulates fibroblast growth factor-induced capillary tube formation. PLoS ONE 4, e8285 10.1371/journal.pone.0008285 [DOI] [PMC free article] [PubMed] [Google Scholar]
- Maurer M., Su T., Saal L. H., Koujak S., Hopkins B. D., Barkley C. R., Wu J., Nandula S., Dutta B., Xie Y.et al. (2009). 3-Phosphoinositide-dependent kinase 1 potentiates upstream lesions on the phosphatidylinositol 3-kinase pathway in breast carcinoma. Cancer Res. 69, 6299–6306 10.1158/0008-5472.CAN-09-0820 [DOI] [PMC free article] [PubMed] [Google Scholar]
- Nagashima K., Shumway S. D., Sathyanarayanan S., Chen A. H., Dolinski B., Xu Y., Keilhack H., Nguyen T., Wiznerowicz M., Li L.et al. (2011). Genetic and pharmacological inhibition of PDK1 in cancer cells: characterization of a selective allosteric kinase inhibitor. J. Biol. Chem. 286, 6433–6448 10.1074/jbc.M110.156463 [DOI] [PMC free article] [PubMed] [Google Scholar]
- Najafov A., Sommer E. M., Axten J. M., Deyoung M. P., Alessi D. R. (2011). Characterization of GSK2334470, a novel and highly specific inhibitor of PDK1. Biochem. J. 433, 357–369 10.1042/BJ20101732 [DOI] [PubMed] [Google Scholar]
- Nyström M L., Thomas G J., Stone M., Mackenzie I. C., Hart I. R., Marshall J. F. (2005). Development of a quantitative method to analyse tumour cell invasion in organotypic culture. J. Pathol. 205, 468–475 10.1002/path.1716 [DOI] [PubMed] [Google Scholar]
- Pearce L. R., Komander D., Alessi D. R. (2010). The nuts and bolts of AGC protein kinases. Nat. Rev. Mol. Cell Biol. 11, 9–22 10.1038/nrm2822 [DOI] [PubMed] [Google Scholar]
- Piccolo E., Innominato P. F., Mariggio M. A., Maffucci T., Iacobelli S., Falasca M. (2002). The mechanism involved in the regulation of phospholipase Cgamma1 activity in cell migration. Oncogene 21, 6520–6529 10.1038/sj.onc.1205821 [DOI] [PubMed] [Google Scholar]
- Pinner S., Sahai E. (2008). PDK1 regulates cancer cell motility by antagonising inhibition of ROCK1 by RhoE. Nat. Cell Biol. 10, 127–137 10.1038/ncb1675 [DOI] [PubMed] [Google Scholar]
- Raimondi C., Falasca M. (2011). Targeting PDK1 in cancer. Curr. Med. Chem. 18, 2763–2769 10.2174/092986711796011238 [DOI] [PubMed] [Google Scholar]
- Rhee S. G. (2001). Regulation of phosphoinositide-specific phospholipase C. Annu. Rev. Biochem. 70, 281–312 10.1146/annurev.biochem.70.1.281 [DOI] [PMC free article] [PubMed] [Google Scholar]
- Sala G., Dituri F., Raimondi C., Previdi S., Maffucci T., Mazzoletti M., Rossi C., Iezzi M., Lattanzio R., Piantelli M.et al. (2008). Phospholipase Cgamma1 is required for metastasis development and progression. Cancer Res. 68, 10187–10196 10.1158/0008-5472.CAN-08-1181 [DOI] [PubMed] [Google Scholar]
- Sekiya F., Poulin B., Kim Y. J., Rhee S. G. (2004). Mechanism of tyrosine phosphorylation and activation of phospholipase C-gamma 1. Tyrosine 783 phosphorylation is not sufficient for lipase activation. J. Biol. Chem. 279, 32181–32190 10.1074/jbc.M405116200 [DOI] [PubMed] [Google Scholar]
- Shepard C. R., Kassis J., Whaley D. L., Kim H. G., Wells A. (2007). PLC gamma contributes to metastasis of in situ-occurring mammary and prostate tumors. Oncogene 26, 3020–3026 10.1038/sj.onc.1210115 [DOI] [PubMed] [Google Scholar]
- Vasudevan K. M., Barbie D. A., Davies M. A., Rabinovsky R., McNear C. J., Kim J. J., Hennessy B. T., Tseng H., Pochanard P., Kim S. Y.et al. (2009). AKT-independent signaling downstream of oncogenic PIK3CA mutations in human cancer. Cancer Cell 16, 21–32 10.1016/j.ccr.2009.04.012 [DOI] [PMC free article] [PubMed] [Google Scholar]
- Wells A., Grandis J. R. (2003). Phospholipase C-gamma1 in tumor progression. Clin. Exp. Metastasis 20, 285–290 10.1023/A:1024088922957 [DOI] [PubMed] [Google Scholar]
- Williams M. R., Arthur J. S., Balendran A., van der Kaay J., Poli V., Cohen P., Alessi D. R. (2000). The role of 3-phosphoinositide-dependent protein kinase 1 in activating AGC kinases defined in embryonic stem cells. Curr. Biol. 10, 439–448 10.1016/S0960-9822(00)00441-3 [DOI] [PubMed] [Google Scholar]
- Yamaguchi H., Yoshida S., Muroi E., Yoshida N., Kawamura M., Kouchi Z., Nakamura Y., Sakai R., Fukami K. (2011). Phosphoinositide 3-kinase signaling pathway mediated by p110α regulates invadopodia formation. J. Cell Biol. 193, 1275–1288 10.1083/jcb.201009126 [DOI] [PMC free article] [PubMed] [Google Scholar]
Associated Data
This section collects any data citations, data availability statements, or supplementary materials included in this article.