

Abstract
Purpose
To evaluate whether the use of Bayesian adaptive randomized (AR) designs in clinical trials for glioblastoma is feasible and would allow for more efficient trials.
Patients and Methods
We generated an adaptive randomization procedure that was retrospectively applied to primary patient data from four separate phase II clinical trials in patients with recurrent glioblastoma. We then compared AR designs with more conventional trial designs by using realistic hypothetical scenarios consistent with survival data reported in the literature. Our primary end point was the number of patients needed to achieve a desired statistical power.
Results
If our phase II trials had been a single, multiarm trial using AR design, 30 fewer patients would have been needed compared with a multiarm balanced randomized (BR) design to attain the same power level. More generally, Bayesian AR trial design for patients with glioblastoma would result in trials with fewer overall patients with no loss in statistical power and in more patients being randomly assigned to effective treatment arms. For a 140-patient trial with a control arm, two ineffective arms, and one effective arm with a hazard ratio of 0.6, a median of 47 patients would be randomly assigned to the effective arm compared with 35 in a BR trial design.
Conclusion
Given the desire for control arms in phase II trials, an increasing number of experimental therapeutics, and a relatively short time for events, Bayesian AR designs are attractive for clinical trials in glioblastoma.
INTRODUCTION
Glioblastoma is associated with a poor prognosis despite multimodality therapy.1,2 Numerous compounds targeting a variety of cellular pathways have shown promise in preclinical models, but translating that potential drug pipeline into clinical trials has been slow, and progress has been minimal. The current paradigms for clinical trial design have been criticized by some as too inflexible to deal with the influx of novel therapeutics and the burgeoning information related to molecular signatures.3,4 There is also a desire to incorporate comparator arms into phase II trials, because the observed rate of success in these trials rarely translates into positive phase III results.5,6 Currently, most early-phase trials for patients with glioblastoma are single-arm studies.
One alternative to traditional clinical trials is to incorporate Bayesian principles into trial design. Bayesian-based trial design has the ability to use accumulating data in real time to alter the course of the trial, thereby enabling dynamic allocation to experimental arms and earlier dropping of ineffective arms.3 This flexibility results in a potentially more efficient trial framework by increasing the probability of enrollment to arms that show evidence of efficacy.
In this study, we considered a hypothetical scenario in which patients who had been previously treated on several separate experimental protocols at the Dana-Farber/Harvard Cancer Center and the University of California at Los Angeles were instead enrolled in a single multiarm protocol using a Bayesian adaptively randomized (AR) trial design. The purpose was to determine whether similar scientific results could have been accomplished more efficiently. This study was motivated by the need for a rational choice of future clinical trial architecture for patients with glioblastoma.
PATIENTS AND METHODS
Adaptive Randomization Strategy
We used a proportional hazards model, Fk(t)=[F0(t)]θk, for survival in the control (F0) and experimental arms (Fk; k = 1, 2, 3). Estimates of the hazard ratios θ = (θ1, θ2, θ3) and predictive inference were obtained with established Bayesian methodology based on the partial likelihood function7:
 |
The time-varying randomization probabilities of enrolling the i-th patient to treatment k are:
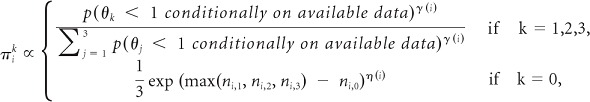 |
where ni,k is the number of patients previously randomly assigned to arm k.
The expression gives, for patient i, four positive numbers that are then normalized to obtain the probabilities πik that he/she will be randomly assigned to treatment k. The top line of the expression shows that as long as γ(i) is positive, the probability of assigning patient i to arm k increases with the evidence in favor of a treatment effect. The bottom line approximately matches the number of patients randomly assigned to the control arm to that of the experimental arm with the highest sample size. We specify η(i) as an increasing linear function with η(overall sample size) = 0.25.
The parameter γ(i) modulates the exploration versus exploitation trade-off.8 If γ is approximately equal to zero for a group of patients, then this group is randomly assigned with approximately identical probabilities to each of the arms, as may be desirable in an initial explorative stage of the trial. Increasing the values of γ for later patients would begin to exploit the accruing information via higher randomization probabilities πik for the most promising arms. The procedure for selecting the parameter γ(i) is detailed in the Appendix (online only).
Retrospective Simulation Using Actual Patient Data
We used primary data from four phase II clinical trials for patients with recurrent glioblastoma to generate the simulation scenario (Fig 1). Specific trial characteristics and results for each of these trials have been previously published.9–12 Scenarios were specified assuming that the empirical distributions obtained with the data and the corresponding true unknown distributions were identical. Simulations included two experimental arms without positive treatment effect and identical outcome distributions. With these data, we sought to quantify the advantage of performing a multiarm AR trial by considering a hypothetical scenario wherein these four trials were instead run as a single multiarm trial using adaptive randomization. This scenario was compared against a hypothetical of three separate two-arm balanced randomized (BR) trials and a single four-arm BR trial. The accrual rate was set at 70 patients per year, and follow-up after the last patient enrolled was 6 months in the simulation.
Fig 1.

Kaplan-Meier curves of overall survival by clinical trial. BCNU, carmustine.
Simulation Based on Historical Data
We defined simulation scenarios by fitting a Weibull distribution to the survival data for patients with recurrent glioblastoma receiving bevacizumab from a modern series that did not contain patient data used for defining scenarios in the previous section.13 The expected accrual rate was set to 70 patients per year on the basis of experience at the Dana-Farber/Harvard Cancer Center. We ran simulations comparing a trial with a control arm, two ineffective treatment arms, and an effective treatment arm with relative risk 0.6, by using either AR or BR trial design. We also performed additional simulations, varying the number of effective arms and the hazard ratios of effective treatment arms. Results were compared by evaluating frequentist operating characteristics and by graphing the number of patients randomly assigned to each arm.
We considered the power of a statistical test for rejecting the null hypotheses (H0) that none of the experimental therapies had a positive effect versus the alternative H1 = {min (θk; k = 1, 2, 3) < 1}. We used exact P values obtained by adapting previously described methodology for response-adaptive designs14 to our setting and compared the adaptive approach with multiarm BR. The main steps for obtaining exact P values were selecting a suitable test statistic Z, randomly generating the sequentially assigned treatments assuming H0 and the adaptive assignment rules, and computing via the Monte Carlo method the test statistics' conditional distribution, given the observed responses under H0. The P value is the tail area of this distribution at the observed value of the test statistics. We then considered the null hypothesis H0 that θk = 1 for a specific k contrasted to the hypothesis H1 = {θk < 1}. In this case, we did not obtain exact P values but used an approximation scheme adapting previously described methodology.15 The main steps of the procedure are selecting a test statistic Z, obtaining maximum likelihood estimations for (Fk; k = 0, 1, 2, 3) under H0, and computing via the Monte Carlo method an approximation of the test statistics' distribution under H0, taking into account the adaptive assignment. Our simulations over several scenarios suggested that the P values distribution under H0 were close to the uniform distribution, as desired.
RESULTS
Retrospective Simulation
In the actual trials, median follow-up was 9.64 months. Other clinical characteristics are provided in Table 1. Median overall survivals for the bevacizumab with or without CPT-11 (irinotecan), cediranib, thalidomide/carmustine, and metronomic chemotherapy arms were 47.0, 31.3, 28.9, and 23.1 weeks, respectively. Figure 1 shows the Kaplan-Meier curves of the survival times in the four trials. We considered a range of combinations of the significance levels and the number of patients enrolled in the AR trials. We computed, for fixed sample sizes including 130, 140, and 150 patients and significance levels α = .05, .1, and .15, the power of detecting a positive effect for bevacizumab. We then computed, under a BR trial design, the necessary sample size for matching the power of AR trial design. Across all combinations, more than 30 additional patients were needed in the multiarm BR trial design, with an average of an additional 5 months for completing the trial. This represents a shortening of the trial duration ranging between 15% and 18%, depending on the desired power. The efficiency gain, in terms of sample size necessary for achieving a desired power level of the adaptive procedure, was almost constant across the significance levels considered. This gain was substantially amplified when we compared the adaptive design with three independent, two-arm BR trial designs. This amplification follows from a more efficient use of the data for the control regimen in the four-arm trial than in the two-arm trials.
Table 1.
Clinical Characteristics of Patients Treated on Four Previously Reported Phase II Clinical Trials Used in the Retrospective Simulation
| Characteristic | Bevacizumab ± Irinotecan | Thalidomide/Carmustine | Metronomic Chemotherapy | Cediranib |
|---|---|---|---|---|
| No. of patients | 50 | 30 | 39 | 31 |
| Sex | ||||
| Male | 33 | 17 | 28 | 18 |
| Female | 17 | 13 | 11 | 13 |
| KPS | ||||
| 60 | 0 | 0 | 3 | 0 |
| 70 | 9 | 8 | 16 | 5 |
| 80 | 18 | 9 | 13 | 6 |
| 90 | 20 | 10 | 6 | 16 |
| 100 | 3 | 3 | 1 | 4 |
| Age, years | ||||
| Median | 54 | 55 | 51 | 53 |
| Range | 24-78 | 29-72 | 34-74 | 20-77 |
Abbreviation: KPS, Karnofsky performance score.
Systematic Simulation
To confirm that these results were not anecdotal, we systematically examined a broad set of scenarios, motivated by real data as discussed in the Patients and Methods section. The adaptive approach is substantially more powerful when only one of the experimental therapies has a positive effect. Figure 2 illustrates the major characteristics of the adaptive procedure. Clinical trials with sample size N = 140 were simulated under a scenario with one effective treatment, θ1 = 0.6, while θ2 = θ3 = 1. Estimates of θ1 and θ2 at three time points during the trials were contrasted with the probability that the next patient was randomly assigned to the other arm. Time points include the enrollment times of the 40th, 90th, and 140th patients. The graph shows that during the initial stage of the trial, the estimates of θ1 and θ2 are highly dispersed and that, importantly, adaptive randomization deviates minimally from balanced randomization. In contrast, as the trials continue and there is less uncertainty in the hazard ratios, the procedure selects with higher probability the most promising arm. Figure 2 illustrates substantial increments of the randomization probabilities to the only effective treatment during the course of the trials.
Fig 2.

Dynamic changes in adaptive randomization probabilities and hazard ratios. (A) Superior treatment. Estimates of the hazard ratios comparing an experimental arm (arm 1) with the control (arm 2). (B) Arm 2. Randomization probabilities for patients 40, 90, and 140. Simulations include one superior regimen (arm 1: hazard ratio, 0.6) and two experimental arms (arm 2 and arm 3) with no treatment effect. Each line corresponds to a separate simulated trial.
In all scenarios in Table 2, AR trial design is more powerful than BR trial design in detecting a positive treatment effect of the first arm; the magnitude of the benefit is displayed in the four columns on the right side. The number of patients assigned to various treatment arms in the course of 500 simulated trials is shown in Figure 3 for a specific realistic scenario. The figure displays a difference of more than 25 patients between the median number of randomizations to the only effective treatment or the control arm and the medians of the two arms without a positive treatment effect.
Table 2.
Probability of Rejecting the Hypothesis H0 that θ1 = 1, Evaluated at Various Significance Levels of α (N = 140)
| HR (θ1,θ2, θ3) | AR |
Δ: AR v BR |
||||||
|---|---|---|---|---|---|---|---|---|
| α = .05 | α = .1 | α = .15 | α = .2 | α = .05 | α = .1 | α = .15 | α = .2 | |
| 0.6, 1, 1 | 0.73 | 0.84 | 0.88 | 0.91 | 0.05 | 0.06 | 0.04 | 0.03 |
| 0.6, 0.73, 1 | 0.72 | 0.83 | 0.89 | 0.91 | 0.06 | 0.06 | 0.05 | 0.03 |
| 0.6, 0.66, 1 | 0.72 | 0.82 | 0.87 | 0.90 | 0.06 | 0.05 | 0.04 | 0.03 |
| 0.66, 1, 1 | 0.58 | 0.70 | 0.76 | 0.81 | 0.05 | 0.06 | 0.04 | 0.03 |
| 0.73, 1, 1 | 0.38 | 0.51 | 0.62 | 0.69 | 0.02 | 0.03 | 0.03 | 0.03 |
NOTE. Monte Carlo iterations, 5.000.
Abbreviations: AR, adaptive randomized [trial design]; BR, balanced randomized [trial design]; HR, hazard ratio.
Fig 3.

Number of patients assigned to each arm across simulations: median, quartiles, and 10th and 90th percentiles. Overall sample size, N = 140.
Although one relatively effective arm was the scenario specified by our phase II data, we also considered operating characteristics under scenarios with no effective regimens (hazard ratios, 1, 1, 1) or identical positive effects (hazard ratios, 0.6, 0.6, 0.6), assuming an overall sample size of 140 patients. In the first case, the median sample size across simulations for experimental arms was 33 patients in each arm, and the type I error probabilities obtained with simulations are controlled below the desired thresholds α = .05, .1, .15, and .2. In the latter case, the probability of detecting the positive effect of arm 1 at a confidence level of α = .05 (.1) shows a decrease of .03 (.03) under AR trial design compared with BR trial design. With a cutoff of α = .05 or .1, the probability of at least one positive result under AR trial design decreases by less than .005. These operating characteristics can be interpreted as an increase of sample size variability under AR trial design compared with BR trial design.
In our simulation study, we also considered overall samples sizes of 60, 80, 100, 110, 120, and 130 patients and scenarios with one effective treatment calibrated to match a power of 0.65 or 0.85 under BR trial design with α = .1. For the sample sizes of 60 and 80 patients, we considered both trials with two or three experimental arms contrasted with a control. In each scenario, we observed power increments between 0.02 and 0.06 under AR trial design.
Robustness to Changes in Randomization Assumptions
We evaluated the robustness of our AR trial design approach by considering what would happen if the underlying assumptions of the Bayesian model or those used for selecting the tuning parameters were violated and by comparing arm-specific sample sizes under various scenarios. We considered substantial departures from the hazards proportionality assumption as well as departures from the estimate of accrual rate. When the treatment effects, expressed as differences between medians, under the ideal scenario were matched with scenarios violating these assumptions, the distribution of the arm-specific sample sizes appeared stable. We considered, for instance, θ1 = 0.66, θ2 = 1, θ3 = 1, N = 140, and a log-normal baseline. In this case, when the accelerated failure time or the proportional odds structures replaced hazards proportionality, the median sample sizes remained identical (44, 44, 26, 26). When the accrual rate is 1.4-fold higher than expected, the medians became 42, 43, 28, and 28. We also considered a hypothetical unexpectedly long temporal delay of 2 months in availability of data, in which case the medians were 42, 42, 28, and 28.
DISCUSSION
A diagnosis of recurrent glioblastoma confers an extremely poor prognosis.11 With the growing number of novel compounds, combinations, and potential interactions with molecular subtypes, the number of therapeutic hypotheses to be tested in well-designed clinical trials is expanding exponentially.
The optimal mechanism for evaluating therapeutics in the phase II setting is a source of considerable debate. Unfortunately, many promising results from single-arm phase II trials are likely overstated when compared with historical benchmarks16 and are not found to be effective on further testing.5,6 For example, the New Approaches to Brain Tumor Therapy (NABTT) Consortium found that three of their single-agent cohort studies all had significantly longer survival times than historical data.16 A recent Institute of Medicine report commented that better phase II designs are needed,17 and The Clinical Trial Design Task Force of the National Cancer Institute Investigational Drug Steering Committee has recommended randomized trials in the phase II setting unless a robust control database is available.18 The introduction of efficacious therapies, improved supportive care, intertrial and interinstitution variability, and changes in response and progression criteria are a few of the ways that newer patient populations may differ from historical controls. In a modeling study, Tang et al19 showed that variability in historical control rates, patient selection, and outcome drifts over time led to significant type I error rates for single-arm trials but left randomized two-arm designs largely unaffected. Resistance to more robust randomized designs has been mostly related to the increased sample size required.
One possible solution is the incorporation of Bayesian principles into clinical trial design.3,4,20–22 Bayesian statistics allow for the real-time incorporation of results as they accumulate, thereby opening the possibility of multiarm AR trial designs with a single control arm, leading to more efficient and nimble trials. Bayesian-based adaptive trials seem particularly attractive for glioblastoma in which events occur early and frequently since AR trials rely on event information to alter the probability of assignment to treatment arms. If the time to event is long relative to the accrual rate, then little new information will inform randomization and there would be no advantage over BR trial design. In glioblastoma, events (either deaths or progression) occur relatively early compared with the rate of accrual, meaning that information can be effectively used to alter random assignment.
We retrospectively investigated multiarm adaptive randomization for patients with recurrent glioblastoma. Data from prior clinical trials were used to realistically model potential drug treatment effects, accrual rates, and time to end points for these patients. An AR trial design would have resulted in fewer patients, a shorter overall study time, and a higher proportion of patients randomly assigned to the effective (bevacizumab) arm compared with a multiarm BR design. We considered a variety of hypothetical multiarm AR versus BR designs, varying the number of effective arms as well as the hazard ratios, and we found that the advantages of AR design held in a variety of scenarios. Of note, the fact that the control arm had approximately the same number of patients randomly assigned as the effective arm was an explicit choice to preserve the multiarm trial advantage for efficient use of control patients. If randomization probabilities had been defined only to obtain unbalanced randomizations toward the most promising arm, then the procedure would not have adequately taken into account the possible result of a small final sample size for the control regimen.
The only scenario that was considered in which there was a relative disadvantage under AR trial design was when every experimental arm had the same positive effect, but this disadvantage was small. Considering the historically poor rate of positive results in glioblastoma clinical trials, this appears to be a minor limitation of our AR trial design.
The adaptive procedure can also be combined with early stopping rules for dropping experimental arms or stopping patient accrual. We considered a stopping rule based on Bayesian predictions.23 The stopping rule drops an experimental arm after a minimum of 10 patients have been randomly assigned to it if the predictive probability that the arm will be recommended for a confirmatory study falls below 1%, for example. Predictive probabilities are computed by ignoring the stopping rule, and if all the experimental arms have been dropped, then the trial is stopped for futility. The structure of the testing procedures remains identical. After incorporating the outlined rules, the operating characteristics in Table 2 suffered negligible variations. When none of the experimental arms had a positive effect, the average number of randomly assigned patients slightly decreased from 140 to 137. Conversely, when we considered a single harmful regimen (hazard ratio, 1.2), the stopping rule had the desired effect of reducing the final sample size of the harmful arm from an average of 27.2 to 20.6 patients.
One limitation of this study relates to the validity of comparing results across separately conducted trials. However, the focus of our study was not to show that arms containing bevacizumab perform better than the other arms, but to examine the operating characteristics of Bayesian adaptive trials. Another limitation is that in our analysis, we did not use multiple hypothesis testing corrections for testing various novel treatments. The rational basis for not correcting for multiplicities in this context has been discussed previously.24 We also combined a Bayesian adaptive procedure with frequentist analyses. The choice of reporting frequentist operating characteristics is motivated by the need to present results that are directly applicable to the regulatory process and that can be compared with the large body of existing literature. Apart from these general limitations, there are hurdles in incorporating AR clinical trials into practice. These include methodologic challenges from generating a prior probability distribution and writing code specific for each trial22 to pragmatic considerations such as obtaining buy-in from regulators and industry.4 Although these barriers remain, they are not insurmountable, as evidenced by the increasing number of these designs within single-institution25,26 and multicenter trials.27
In conclusion, on the basis of the results of our study, the use of Bayesian adaptive designs in glioblastoma trials would result in trials requiring substantially fewer overall patients, with more patients being randomly assigned to efficacious arms.
Appendix
Bayesian Model
The adaptive procedure that we proposed is based on Bayesian modeling of survival functions Fk, k = 0, 1, 2, 3. Recall that F0 is associated with the control arm and the remaining survival functions correspond to the experimental arms. We used the proportional hazards model Fk(t)=[F0(t)]θk. Here, we emphasize that the use of the partial likelihood for deriving Bayesian inference is particularly advantageous in our context. There are three main reasons: (1) it considerably simplifies posterior computations compared with the usual Bayesian analysis based on the full likelihood, (2) it does not require an explicit prior distribution for the baseline function F0, and (3) posterior probabilities on the unknown parameters θ1, θ2, θ3 have a clear Bayesian interpretation. We recall that the posterior distribution on θ = θ1, θ2, θ3 is defined by
Simplification of posterior computations follows from the fact that we don't need to obtain inference on the baseline distribution F0 . Note that posterior inference on θ is not related to any assumption on F0. Finally, posterior inference based on partial likelihood can be viewed as a direct application of Bayes' formulas for obtaining the conditional distribution of the parameters of interest, given the assigned treatments and the ranks of the survival times.
Selection of the Tuning Parameters of the Adaptive Procedure
The randomization probabilities, πik, generated by our adaptive procedure are functions of (1) the posterior probabilities of positive treatment effects; these are the conditional probabilities (given the available data) that θk < 1, with k = 1, 2, 3 and (2) the number of patients already randomly assigned to each arm. The procedure for obtaining the randomization probabilities πik also includes tuning parameters—γ(i) and η(i)—that need to be properly selected. These parameters play an important role in that they tune the exploration versus exploitation trade-off of the randomization procedure. It can be observed that if the tuning parameter γ(i) is null—γ(i) = 0—for a group of patients, say for i = 1, . . ., 50, then each time a patient in this group is enrolled, the randomization probabilities are identical across the three experimental treatments, that is πi1=πi2=πi3. In the opposite extreme case, with large values of γ(i), say γ(i) = 100, for i = 51, . . . 100, we have that each time a patient is randomly assigned, two of the randomization probabilities πi1, πi2 and πi3 are approximately null. Our adaptive procedure requires the tuning of the parameters γ(i) within these two extreme cases.
The parameters η(i) have a different scope and allow one to approximately match [max (ηi1,ηi2,ηi3)] the number of patients randomly assigned to the most frequently assigned experimental arm, and ηi0, the number of patients on the control arm. If a large constant value is specified for η(i), say 100, then when max (ηi1,ηi2,ηi3) >ηi0, the adaptive procedure selects the control arm and vice versa. Nonetheless, to obtain the desired balance, it is unnecessary to select large values for η(i) and, importantly, a suitable selection of these parameters avoids the random assignment of enrolled patients to the control arm becoming highly predictable. In our study we used η(i) as an increasing linear function with η (overall sample size) = 0.25. In a series of simulations, we observed little sensitivity of the operating characteristics of the adaptive procedure to alternative choices of the η(i) parameters.
We chose γ(i) by exploring the operating characteristics across alternative specifications of these parameters. We proceeded through the following steps: (1) we selected realistic scenarios, including accrual rate and survival functions on the basis of reported results from recent clinical trials; (2) we considered two flexible parametric functions,  and
and  , where a and b are positive tuning parameters and I (i > b) equals 1 if i > b and zero otherwise; and 3 we specified a grid of possible values for (a, b) and computed operating characteristics of interest of alternative γ functions by iteratively simulating trials. We repeated this in scenarios with zero, 1, or 2 effective arms and with hazard ratios for the control ranging from 0.5 to 1.
We compared γ functions by computing the probability of reporting the effectiveness of treatments under alternative testing procedures. A graphical representation is provided in Appendix Figure A1. The probability surfaces in the figure suggest that the optimal selections of the parameters in the considered scenarios are attained for combinations of a and b, with the first parameter within the interval (2.5, 3.5) and the second within the interval (1.5, 2). The maxima of the surfaces are marked. Importantly, the graphical representation also shows moderate sensitivity of the operating characteristics with respect to variations of a and b. Note that the probability surfaces are nearly flat in proximity to the maxima.
Overall, we observed moderate sensitivity of operating characteristics to changes in the tuning parameters. After selecting γ, we recommend comparisons under additional scenarios (including violations of the proportional hazards assumption and expectations for the accrual rate) with a balanced randomized design.
Fig A1.

Operating characteristics for possible tuning parameters of the adaptive design. The overall sample size is N = 140, and the γ functions can be written as , with a within the interval (0.5, 4) and b within the interval (0.3, 2.2). The values of a and vary on the axes of the panels. The hazard ratios are as follows: for the panels in the first row under Scenario 1 (θ1, θ2, θ3) = (11/15, 1, 1); in the second row under Scenario 2, (θ1, θ2, θ3) = (9/16, 1, 1). Colors illustrate the probabilities of correctly recommending further investigations for treatment 1 at completion of the trial. Panels in the first column assume that evidence of efficacy for treatment 1 is reported when the posterior probability is that θ1 < 1 is higher than 75% (or higher than 85% in the second column).
Footnotes
Authors' disclosures of potential conflicts of interest and author contributions are found at the end of this article.
Clinical trial information can be found for the following: NCT00305656.
AUTHORS' DISCLOSURES OF POTENTIAL CONFLICTS OF INTEREST
Although all authors completed the disclosure declaration, the following author(s) indicated a financial or other interest that is relevant to the subject matter under consideration in this article. Certain relationships marked with a “U” are those for which no compensation was received; those relationships marked with a “C” were compensated. For a detailed description of the disclosure categories, or for more information about ASCO's conflict of interest policy, please refer to the Author Disclosure Declaration and the Disclosures of Potential Conflicts of Interest section in Information for Contributors.
Employment or Leadership Position: None Consultant or Advisory Role: Eudocia Q. Lee, Genentech (C), Novartis (C); Tracy T. Batchelor, Amgen (C), Genentech (C), Merck (C), Millennium Pharmaceuticals (C), Roche (C), Spectrum Pharmaceuticals (C); Timothy Cloughesy, Agios Pharmaceuticals (C), Amgen (C), Celgene (C), Eli Lilly (C), Genentech (C), Novartis (C), Roche (C) Stock Ownership: None Honoraria: Timothy Cloughesy, Merck Research Funding: Patrick Y. Wen, AstraZeneca, Genentech; Tracy T. Batchelor, AstraZeneca, Millennium Pharmaceuticals, Pfizer Expert Testimony: None Other Remuneration: None
AUTHOR CONTRIBUTIONS
Conception and design: Lorenzo Trippa, Eudocia Q. Lee, Patrick Y. Wen, Giovanni Parmigiani, Brian M. Alexander
Provision of study materials or patients: Patrick Y. Wen, Tracy T. Batchelor, Timothy Cloughesy
Collection and assembly of data: Eudocia Q. Lee, Patrick Y. Wen, Tracy T. Batchelor, Timothy Cloughesy, Brian M. Alexander
Data analysis and interpretation: Lorenzo Trippa, Patrick Y. Wen, Giovanni Parmigiani, Brian M. Alexander
Manuscript writing: All authors
Final approval of manuscript: All authors
REFERENCES
- 1.Quant EC, Drappatz J, Wen PY, et al. Recurrent high-grade glioma. Curr Treat Options Neurol. 2010;12:321–333. doi: 10.1007/s11940-010-0078-5. [DOI] [PubMed] [Google Scholar]
- 2.Wen PY, Kesari S. Malignant gliomas in adults. N Engl J Med. 2008;359:492–507. doi: 10.1056/NEJMra0708126. [DOI] [PubMed] [Google Scholar]
- 3.Berry DA. Bayesian clinical trials. Nat Rev Drug Discov. 2006;5:27–36. doi: 10.1038/nrd1927. [DOI] [PubMed] [Google Scholar]
- 4.Berry DA. Adaptive clinical trials: The promise and the caution. J Clin Oncol. 2011;29:606–609. doi: 10.1200/JCO.2010.32.2685. [DOI] [PubMed] [Google Scholar]
- 5.Maitland ML, Hudoba C, Snider KL, et al. Analysis of the yield of phase II combination therapy trials in medical oncology. Clin Cancer Res. 2010;16:5296–5302. doi: 10.1158/1078-0432.CCR-10-0669. [DOI] [PMC free article] [PubMed] [Google Scholar]
- 6.Zia MI, Siu LL, Pond GR, et al. Comparison of outcomes of phase II studies and subsequent randomized control studies using identical chemotherapeutic regimens. J Clin Oncol. 2005;23:6982–6991. doi: 10.1200/JCO.2005.06.679. [DOI] [PubMed] [Google Scholar]
- 7.Sinha D, Ibrahim JG, Chen MH. A Bayesian justification of Cox's partial likelihood. Biometrika. 2003;90:629–641. [Google Scholar]
- 8.Cohen JD, McClure SM, Yu AJ. Should I stay or should I go? How the human brain manages the trade-off between exploitation and exploration. Philos Trans R Soc Lond B Biol Sci. 2007;362:933–942. doi: 10.1098/rstb.2007.2098. [DOI] [PMC free article] [PubMed] [Google Scholar]
- 9.Batchelor TT, Duda DG, di Tomaso E, et al. Phase II study of cediranib, an oral pan-vascular endothelial growth factor receptor tyrosine kinase inhibitor, in patients with recurrent glioblastoma. J Clin Oncol. 2010;28:2817–2823. doi: 10.1200/JCO.2009.26.3988. [DOI] [PMC free article] [PubMed] [Google Scholar]
- 10.Fine HA, Wen PY, Maher EA, et al. Phase II trial of thalidomide and carmustine for patients with recurrent high-grade gliomas. J Clin Oncol. 2003;21:2299–2304. doi: 10.1200/JCO.2003.08.045. [DOI] [PubMed] [Google Scholar]
- 11.Friedman HS, Prados MD, Wen PY, et al. Bevacizumab alone and in combination with irinotecan in recurrent glioblastoma. J Clin Oncol. 2009;27:4733–4740. doi: 10.1200/JCO.2008.19.8721. [DOI] [PubMed] [Google Scholar]
- 12.Kesari S, Schiff D, Doherty L, et al. Phase II study of metronomic chemotherapy for recurrent malignant gliomas in adults. Neuro Oncol. 2007;9:354–363. doi: 10.1215/15228517-2007-006. [DOI] [PMC free article] [PubMed] [Google Scholar]
- 13.Kreisl TN, Kim L, Moore K, et al. Phase II trial of single-agent bevacizumab followed by bevacizumab plus irinotecan at tumor progression in recurrent glioblastoma. J Clin Oncol. 2009;27:740–745. doi: 10.1200/JCO.2008.16.3055. [DOI] [PMC free article] [PubMed] [Google Scholar]
- 14.Wei LJ. Exact two-sample permutation tests based on the randomized play-the-winner rule. Biometrika. 1988;75:603–606. [Google Scholar]
- 15.Rosenberger WF, Hu F. Bootstrap methods for adaptive designs. Stat Med. 1999;18:1757–1767. doi: 10.1002/(sici)1097-0258(19990730)18:14<1757::aid-sim212>3.0.co;2-r. [DOI] [PubMed] [Google Scholar]
- 16.Grossman SA, Ye X, Piantadosi S, et al. Survival of patients with newly diagnosed glioblastoma treated with radiation and temozolomide in research studies in the United States. Clin Cancer Res. 2010;16:2443–2449. doi: 10.1158/1078-0432.CCR-09-3106. [DOI] [PMC free article] [PubMed] [Google Scholar]
- 17.Nass SJ, Moses HL, Mendelsohn J, editors. A National Cancer Clinical Trials System for the 21st Century: Reinvigorating the NCI Cooperative Group Program. Consensus Report. Washington, DC: National Academies Press; 2010. [PubMed] [Google Scholar]
- 18.Seymour L, Ivy SP, Sargent D, et al. The design of phase II clinical trials testing cancer therapeutics: Consensus recommendations from the clinical trial design task force of the national cancer institute investigational drug steering committee. Clin Cancer Res. 2010;16:1764–1769. doi: 10.1158/1078-0432.CCR-09-3287. [DOI] [PMC free article] [PubMed] [Google Scholar]
- 19.Tang H, Foster NR, Grothey A, et al. Comparison of error rates in single-arm versus randomized phase II cancer clinical trials. J Clin Oncol. 2010;28:1936–1941. doi: 10.1200/JCO.2009.25.5489. [DOI] [PMC free article] [PubMed] [Google Scholar]
- 20.Berry DA. Bayesian statistics and the efficiency and ethics of clinical trials. Stat Sci. 2004;19:175–187. [Google Scholar]
- 21.Gönen M. Bayesian clinical trials: No more excuses. Clin Trials. 2009;6:203–204. doi: 10.1177/1740774509105374. [DOI] [PubMed] [Google Scholar]
- 22.Thall PF, Wathen JK. Practical Bayesian adaptive randomisation in clinical trials. Eur J Cancer. 2007;43:859–866. doi: 10.1016/j.ejca.2007.01.006. [DOI] [PMC free article] [PubMed] [Google Scholar]
- 23.Berry DA. Statistics: A Bayesian perspective. Belmont, CA: Duxbury Press; 1996. [Google Scholar]
- 24.Freidlin B, Korn EL, Gray R, et al. Multi-arm clinical trials of new agents: Some design considerations. Clin Cancer Res. 2008;14:4368–4371. doi: 10.1158/1078-0432.CCR-08-0325. [DOI] [PubMed] [Google Scholar]
- 25.Biswas S, Liu DD, Lee JJ, et al. Bayesian clinical trials at the University of Texas M. D. Anderson Cancer Center. Clin Trials. 2009;6:205–216. doi: 10.1177/1740774509104992. [DOI] [PMC free article] [PubMed] [Google Scholar]
- 26.Kim ES, Herbst RS, Wistuba II, et al. The BATTLE Trial: Personalizing therapy for lung cancer. Cancer Discov. 2011;1:44–53. doi: 10.1158/2159-8274.CD-10-0010. [DOI] [PMC free article] [PubMed] [Google Scholar]
- 27.Barker AD, Sigman CC, Kelloff GJ, et al. I-SPY 2: An adaptive breast cancer trial design in the setting of neoadjuvant chemotherapy. Clin Pharmacol Ther. 2009;86:97–100. doi: 10.1038/clpt.2009.68. [DOI] [PubMed] [Google Scholar]