

Abstract
Both mammals and birds use the interaural time difference (ITD) for localization of sound in the horizontal plane. They may localize either real or phantom sound sources, when the signal consists of a narrow frequency band. This ambiguity does not occur with broadband signals. A plot of impulse rates or amplitude of excitatory postsynaptic potentials against ITDs (ITD curve) consists of peaks and troughs. In the external nucleus (ICX) of the owl's inferior colliculus, ITD curves show multiple peaks when the signal is narrow-band, such as tones. Of these peaks, one occurs at ITDi, which is independent of frequency, and others at ITDi ± T, where T is the tonal period. The ITD curve of the same neuron shows a large peak (main peak) at ITDi and no or small peaks (side peaks) at ITDi ± T, when the signal is broadband. ITD curves for postsynaptic potentials indicate that ICX neurons integrate the results of binaural cross-correlation in different frequency bands. However, the difference between the main and side peaks is small. ICX neurons further enhance this difference in the process of converting membrane potentials to impulse rates. Inhibition also appears to augment the difference between the main and side peaks.
Humans and owls may incorrectly localize a virtual sound source in the hemifield opposite to that of the real source when the signal is narrow-band, such as tones. This problem does not occur when the signal is broadband, such as noise (1, 2). We can explain the cause of this phenomenon by assuming that a process similar to cross-correlation measures the interaural time difference (ITD), which is the cue for sound localization in the horizontal plane (3–5). For example, suppose that the tone in the right ear leads its copy in the left ear by ¼ of the period (T). The auditory system delays the neural signals from the right ear by ¼T so that they coincide with those from the left ear, provided that this delay is within the physiological range given by the size of the head. The detection of this coincidence indicates to the brain that the sound is located in the direction encoded by the ITD in the right hemifield. However, a delay of the neural signals from the left ear by ¾T (which equals ¼T − T) also causes the two signals to coincide, indicating that the sound source is now in the left hemifield. Thus, narrow band signals may give ambiguous information about sound sources. This problem does not occur with broadband signals, because cross-correlation of them produces a single maximum or peak.
The auditory system does not directly cross-correlate broadband signals but performs this computation on their spectral components. The inner ear breaks down complex signals into their spectral components and encodes the amplitude and phase of each frequency component. Nerve impulses that occur at or near particular phase angles represent phase information. Specific brainstem circuits perform cross-correlation on left and right trains of phase-locked impulses in each frequency band (6–8). Cross-correlation of such signals produces peaks and troughs of impulse rates (e.g., refs. 7, 9, and 10). Connecting the mean discharge rates for different ITDs gives rise to a sinusoidal curve, which will be referred to as the ITD curve (Fig. 1A). It contains one peak at the time lag corresponding to the ITDi (i stands for frequency independent), which represents the source direction, and other peaks at ITDi ± T, where T is the period of the stimulus tone. This phenomenon is referred to as phase-ambiguity and ITDi ± T as the phase equivalents (of ITDi). Phase ambiguity occurs irrespective of signal bandwidth, if the neuron is narrowly tuned to frequency, as in brainstem neurons that perform cross-correlation (Fig. 1B). The question here is how the auditory system distinguishes ITDi from its phase equivalents.
Figure 1.

Phase ambiguity and signal bandwidth. (A) ITD-curve of a nucleus laminaris neuron for a 5.9-kHz tone showing phase ambiguity. (B) The response of the laminaris neuron in A to a broadband signal shows little difference from A. (C) ITD-curve of an ICX neuron for a 5.5-kHz tone. (D) The same neuron as in C stimulated with a broadband signal shows one large main peak and two small side peaks.
If the discrimination between ITDi and its phase equivalents is to take place at the level of single neurons, different frequency bands must converge on single neurons. The owl's auditory system contains such neurons in the external nucleus of the inferior colliculus (ICX) (11). The frequency tuning curves of ICX neurons are broad, spanning from 2 kHz to 8 kHz. These neurons show phase-ambiguity in response to ITDs contained in tones, mirroring the behavioral findings (Fig. 1C). Comparison of the ITD curves obtained for different frequencies clearly shows an ITD that is independent of frequency. Furthermore, when the signal is broadband, the same neurons respond to this ITD exclusively or much more strongly than to other ITDs (12) (Fig. 1D). Thus, in the ICX and other higher order neurons, such as those of the optic tectum that receive input from the ICX, the peak at ITDi (“main peak”) is clearly distinguishable from those (“side peaks”) at its phase equivalents, when the signal is broadband (2, 13). In addition, ICX neurons receive inputs from neurons that respond to a common ITD, although they are sensitive to different frequencies. These neurons occur in a tonotopic sequence in the central nucleus of the inferior colliculus and project to the ICX (14). These findings led to a hypothesis that accounts for the elimination of phase ambiguity by frequency convergence (14–16) (Fig. 2). In this model, a single ICX neuron receives inputs from lower order neurons that prefer a common ITD (i.e., ITDi). The phase equivalents of ITDi vary, however, because the neurons are tuned to different frequencies. Addition of the ITD curves across frequency with respect to ITDi gives rise to a tall peak at this ITD and deep troughs on both sides of it. Peaks at the phase equivalents are smaller, because these peaks do not coincide across different frequency bands. When peaks and troughs coincide, the resulting ITD curve shows elevated plateaus flanking the deep troughs on both sides of the main peak. The details of the distribution of these small peaks and the shape of the plateaus should vary according to the frequency preference of the neuron and the spectral composition of the signal. In general, the sum of the results of cross-correlation performed on the spectral components of a signal is equivalent to cross-correlating the whole signal. The efficacy of broadband signals for unambiguous localization of sound by humans has also been explained by across-frequency convergence of ITD information (e.g., refs. 1, 4, and 17–19). ICX neurons appear to use not only additive processes in frequency convergence but also nonlinear mechanisms to discriminate between the main peak and its phase equivalents. These neurons offer unique opportunities to study how these linear and nonlinear operations are carried out at the level of single neurons. We used intracellular methods to see the relationships between the input and output sides of these computations as they occur in these neurons.
Figure 2.

Model of frequency convergence for elimination of phase ambiguity. ICX neurons sum the results of cross-correlation performed in different frequency bands (F1–F4). Cross-correlation peaks occur at ITDi and at its phase equivalents ITDi ± T, where T is tonal period, which varies with frequency. Integration across frequency gives rise to a tall peak at ITDi. Dotted lines show how the peaks at ITDi line up across frequency, whereas the peaks at ITDi ± T diverge with frequency.
Materials and Methods
Surgery.
Data were obtained by in vivo intracellular recording of 59 inferior colliculus space-specific neurons in 14 adult barn owls. These neurons are tuned to combinations of ITD and interaural intensity difference and selective for the direction of sound sources. The protocol for this study followed the National Institutes of Health Guide for the Care and Use of Laboratory Animals and was approved by the Laboratory Animal Care and Use Committee. Owls were anesthetized by i.m. injection of ketamine hydrochloride (25 mg/kg; Ketaset; Phoenix Pharmaceutical, St. Joseph, MO) and diazepam (1.3 mg/kg; Diazepam; Steris, Mentor, OH). An adequate level of anesthesia was maintained with supplemental injections of ketamine. Body temperature was maintained with a heating pad. The skull was immobilized by placing the owl in a stereotaxic head holder such that the palatine ridge was inclined down by 90° with respect to the horizontal bars of the stereotaxic holder. We cemented an inverted T shaped metal plate on the skull to support the head during the experiment without obstructing the ear canals. Before we transferred owls to recovery cages, we injected another dose of diazepam to ensure a smooth recovery from anesthesia, an analgesic (buprenorphine hydrochloride, 0.03 mg, Buprenex; Reckitt & Colman Pharmaceuticals, Richmond, VA), and an antibiotic, (20 mg, Oxytetracycline, Phoenix Pharmaceutical) to protect owls from pains and infection.
Recording sessions began 7–10 days after the implantation of the headplate. Anesthesia was induced and maintained, and antibiotic was given as described above. Ten milliliters of lactated ringer was s.c. injected. All instruments were sterilized. The midbrain was approached through a hole made in the exoccipital bone through which the bony eminence containing the optic lobe is visible. We made a small hole on this bone to insert electrodes.
Acoustic Stimuli.
All experiments were performed in a double-walled sound-attenuating chamber. Acoustic stimuli were delivered by an earphone-assembly consisting of a Knowles ED-1914 receiver as a sound source, a Knowles (Electronics, Franklin Park, IL) BF-1743 damped coupling assembly for smoothing the frequency response of the receiver, and a calibrated Knowles 1939 microphone for monitoring sound pressure levels in the ear canal. The Knowles components were encased in an aluminum cylinder 7 mm in diameter and 8.1 mm in length. The cylinder was inserted into the ear, and the gaps between the earphone assembly and the ear canal were sealed with silicone impression material (Gold Velvet, Earmold and Research Laboratories, Wichita, KS). The calibration data contained the amplitudes and phase angles measures in steps of 100 Hz. Irregularities in the frequency response of each earphone were automatically smoothed by the computer from 2 kHz to 12 kHz.
Acoustic stimuli were digitally synthesized with a Dell Dimension XPS Pro200n computer and delivered by a stereo analog interface (DD1, Tucker-Davis Technologies, Gainesville, FL). ITDs were computed online, whereas interaural level differences were set by two digital attenuators (PA4, Tucker-Davis Technologies), which were controlled by the computer. Tonal stimuli 100 msec in duration, 5 msec linear rise/fall time, were presented once per second. ITD was varied in steps of 30 μsec. We used the same methods of decorrelating binaural signals that were used previously in this laboratory (16).
Intracellular Recording.
Sharp borosilicate glass electrodes filled with 2 M potassium acetate and 4% neurobiotin were used for intracellular recording of space-specific neurons. Analog signals were amplified (Axoclamp 2A, Axon Instruments, Foster City, CA) and stored in the computer.
To measure postsynaptic potentials (PSPs), we used a method of median filtering that eliminates action potentials by replacing each point of the trace by the median of all of the points within a surrounding 5-ms window (20). ITD and frequency tuning and intensity response curves of PSPs were made by custom software (matlab 5.3). We calculated the median membrane potential of the first 50 ms of the response and averaged it over five repetitions of the same stimulus. Intracellular best frequency was defined as the frequency that depolarized the cell most at a constant sound intensity 20–30 dB above threshold. Intracellular frequency tuning width was defined as the width of the PSP frequency tuning curve at 30% of the maximum amplitude.
We identified ICX neurons by labeling their axons, which, by definition, project to the optic tectum. The tracer, neurobiotin, was injected by iontophoresis (3 nA-positive, 300-ms current steps, 3 per second for 5 to 30 min). After the experiment, owls were overdosed with Nembutal and perfused with 2% paraformaldehyde. Brain tissue was cut in 60-μm-thick sections and processed according to standard protocols (21).
Results
The hypothesis of frequency convergence assumes that ICX neurons integrate ITD responses from different frequency bands with respect to ITDi. We examined whether the addition of ITD curves obtained separately for different frequencies predicts the ITD curve for a combination (stack) of the frequencies in 20 neurons. Plotting PSP amplitude against ITD produced a typical ITD curve with peaks and troughs. Fig. 3 A and B compares stack curves for impulse rates and PSPs for the same neuron and stimuli. In all neurons, stack curves of PSPs were equal to or larger than either of the ITD curves obtained separately for each frequency. However, the stack curve was always smaller than the addition of the three curves, and larger than their average, as in Fig. 3C. The addition of two or three curves was correlated with the stack curve in most neurons, although the slope of the regression line was small (Fig. 3D). In all cases, the main peak of the stack curve was always taller than the side peaks. Different frequencies appeared to contribute different amounts to the stack curve. The best frequency of a neuron contributed more than other frequencies, although the tuning curves of ICX neurons are broad.
Figure 3.

Frequency integration in an ICX neuron. (A) ITD curves for three different frequencies and one obtained for a combination (stack) of the three. Note the tall main peak and shorter side peaks in the stack curve. (B) Intracellular version of A, plotting evoked PSPs instead of impulse rates as a function of ITD. Note the small differences between the main and side peaks in contrast with A. Resting membrane potential is indicated by dotted line. (C) Neither addition nor average of the three ITD curves predicts the stack curve. (D) The addition of the three curves is correlated with the stack curve in terms of PSPs. (E) Nonlinear relation between impulse rates and PSPs. (F) The absence of correlation between stack and addition in impulse rates.
A broadband stimulus induced a large peak at the ITDi and slightly smaller peaks at its phase equivalents. Fig. 4 compares noise-induced ITD curves for PSPs and impulse rates for the same neuron. The presence of large side peaks in PSPs appears to contradict the fact that these neurons are broadly frequency tuned. This phenomenon did not result from any spectral biases in the broadband stimulus used, because the system was calibrated to produce a flat spectral distribution in the ear. Also, the distance between ITD peaks in these neurons was clearly correlated with the neurons' best frequency, which is the frequency that elicits a maximal discharge rate (Fig. 5). The best frequency does not necessarily occupy the midpoint in frequency tuning curve in ICX neurons. We found that the frequency at the midpoint was not as well correlated with the interpeak distance as the best frequency. Despite the apparent discrepancy between the broad frequency tuning and the size of the side peaks in individual neurons, the width of frequency tuning was correlated with the M−SP difference [100 × (main peak − side peak) ÷ main peak] in the sample of neurons studied; the broader the tuning width, the larger the M−SP difference. The slope of the regression line was larger with the M−SP difference measured with impulse rates than with PSPs (Fig. 6). Also, this correlation existed only when we used the width of frequency tuning measured in PSPs. It may be because tuning widths measured in impulse rates tended to be narrower and more variable (data not shown).
Figure 4.

Small differences between main and side peaks in postsynaptic potentials. (A) ITD curve in PSPs for broadband stimulus. Dotted line shows resting membrane potential. (B) ITD curve in impulse rates for broadband stimulus.
Figure 5.

Correlation between the interpeak interval and the period of best frequency calculated in terms of PSP amplitude (TBF). There is a significant correlation between the two. The solid line represents the linear regression. The number of dots appears smaller than 59 because of overlaps near 150 μsec corresponding to 6.45 kHz.
Figure 6.

Difference between main and side peaks (M−SP difference) and filter properties of neurons. Correlation between M−SP difference and frequency-tuning width. M−SP difference for impulse rate (solid circles) and PSP (empty circles) are compared.
Derivation of ITDs by cross-correlation works best if one signal is a time-shifted version of the other signal. Addition of random noise to one or both sides “decorrelates” such a pair of signals. This method can test whether a neuron (or its afferent) behaves as a cross-correlator or not (16). We tested this idea with five neurons for three different degrees of correlation (1, 0.5, and 0), and Fig. 7 shows an example. Decorrelation reduced the PSP amplitude of the main peak and the depths of the troughs. This trend was observed in all cases.
Figure 7.

Effects of decorrelation on ITD-curves. (A) PSP ITD-curves for BC = 0, 0.5, and 1. The main peak and one side peak are shown. The amplitude of peaks and troughs decreases with BC. (B) Corresponding impulse–ITD curves to the ones in A. The neuron responds only to the best ITD and BC = 1.
M−SP differences in PSPs are much smaller than those in impulse rates. The question here is how this translation occurs. One mechanism may be to set the threshold of firing between the main and side peaks. Although we saw this in some neurons, there were other neurons in which PSPs for both the main and side peaks exceeded the threshold. Furthermore, the M−SP differences obtained for PSPs and impulse rates were correlated (Fig. 8). The slope of the regression line was, however, steep, indicating that small differences in PSPs are generally translated into large differences in impulse rates. Although there was a sublinear correlation between the stack curve and the addition of the three curves in PSPs, a highly nonlinear relationship between PSPs and impulse rates was usually observed (cf. Fig. 3E). As a result, the addition of impulse-rate ITD curves for tones was sometimes nonlinearly correlated with the impulse-rate stack curve (cf. Fig. 3F). On the other hand, examples of this nonlinear type were less common than linear ones in which the addition of the two impulse-rate curves could predict the impulse-rate stack curve.
Figure 8.

Relationship between M−SP differences in PSPs and impulse rates. Small changes in M−SP differences in PSPs are associated with large changes in impulse M−SP differences. The solid line represents the linear regression.
In addition to the processes mentioned above, inhibition appears to suppress the side peaks more than the main peak. Fig. 9A shows the effects of increasing sound (noise) levels on impulse rates. Higher levels caused the main peak to increase more than the side peaks. Injection of depolarizing current caused sound-evoked discharge rates to increase. Stimulation with ITDi ± T increased this rate less than with ITDi, suggesting that inhibition suppresses the side peaks more than the main peak (Fig. 9B).
Figure 9.
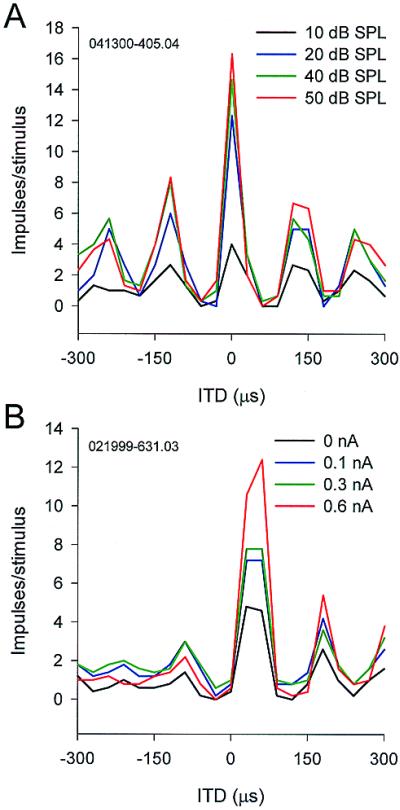
Differential inhibition on main and side peaks. (A) ITD-curves obtained for different sound levels. (B) ITD-curves during injection of depolarizing current. In both conditions, the main peak increased much more than the side peaks.
Discussion
The site of coincidence detection in owls is the nucleus laminaris (NL) in which neurons are narrowly tuned to frequency (7, 22, 23). The NL projects to the core of the central nucleus of the inferior colliculus directly and indirectly by way of one of the lemniscal nuclei. The NL also projects to a part of the superior olivary nucleus. The results of cross-correlation are conveyed upstream in parallel frequency bands (24). The core projects to the lateral shell of the central nucleus of the contralateral inferior colliculus (25). The convergence of different frequency bands appears to begin in the lateral shell and continues into the adjoining ICX. Both anatomical and physiological lines of evidence show a wide range of frequency convergence in the ICX (14).
ICX neurons integrate ITD-induced PSPs across frequency. The shape of stack curves resembles the addition of cross-correlation performed on its spectral components. This process alone can make the main peak taller than the side peaks, because the PSPs for ITDi coincide across frequency, whereas those for ITDi + T do not. Furthermore, the M−SP difference in impulse rates increases monotonically as a function of signal bandwidth in the ICX and the optic tectum (2, 13). Decorrelation of binaural signals also reduced the main peak in tectal and ICX neurons (ref. 26 and the present work). These findings are consistent with the idea that ICX neurons integrate the results of cross-correlation on separate frequency bands (cf. Fig. 2).
ITD curves of PSPs showed conspicuous periodicity despite the neuron's broadband responses to frequency. However, frequency-tuning curves obtained with tones do not necessarily predict how the neuron responds to broadband signals. The rate at which the side peaks decline with increasing distance from ITDi is a function of the neuron's bandwidth, if the neuron sums the results of cross-correlation in different frequency bands. The broader the width, the steeper the rate. The M−SP difference can represent this rate. The decline is much faster in spike rates than in membrane potential data. The M−SP difference is much larger in impulse rates than in membrane potentials. These changes in the M−SP difference involve nonlinear mechanisms such as inhibition and thresholding. Setting membrane potentials at critical levels for firing by inhibition is such a process. Bicuculline, a γ-aminobutyric acid type A (GABAA) blocker, raises the discharge level of the entire ITD curve, indicating the possible gain control function of inhibition. Interestingly, the effects of inhibition appear to be greater on the side peaks than on the main peak. Experiments also indicated that the side peaks increased more than the main peak in response to Bicuculline (27, 28). These results are consistent with our interpretation that inhibition reduces side peaks. Taken together, ICX neurons integrate across frequency the outputs of cross-correlation on separate frequency bands and, in addition, perform nonlinear operations on the results of the integration.
Derivation of ITDs by cross-correlation has been extensively studied in the central nucleus (ICC) of the cat. ICC neurons sum the ITD responses in different frequencies within their tuning ranges. The average of these curves can predict the shape of ITD curves for noise stimuli (29, 30). Also, the M−SP difference increase as a function of stimulus bandwidth (29, 31). The effects of decorrelation are also similar between owls and cats (29). In mammals, the medial superior olivary nucleus contains the primary coincidence detectors (9, 10). The question is whether ICC neurons receive input from medial superior olivary nucleus neurons that are tuned to different frequencies. Low frequency primary auditory nerve fibers in cats have a low mean Q10 (about 2) (32). This fact suggests that the range of frequency convergence that is observed in the ICC may be taking place in the auditory nerve and relayed to ICC neurons. Moreover, the ITD curves of the cat's medial superior olivary nucleus neurons obtained for broadband stimuli closely resemble those of ICC neurons in that the main peak is much taller than the side peaks (10). Thus, frequency convergence at the level of the ICC need not be assumed to explain the ITD curves of ICC neurons for noise. In contrast, the ITD responses of the owl's NL neurons to noise do not resemble those of ICX neurons at all (cf. Fig. 1), because the latter are much more broadly tuned to frequency.
The broad tuning curves of the owl's ICX neurons may be related to the high frequency range in which the owl extracts both ITDs for azimuth and interaural intensity differences for elevation. ICX neurons selectively respond to combinations of ITD and interaural intensity difference. In this frequency range, the side peaks occur at ITDs that are well within the physiological range of 200 μsec. In contrast, the side peaks are seldom within the physiological range of ITDs in humans and other mammals that use low frequencies for ITD-based sound localization. The largest M−SP difference (80–100%) achieved by the owl's ICX neurons is perhaps larger than that achieved by the cat's ICC neurons, although quantitative data are not available for the cat. This presumed difference is partly due to the nonlinear processes that ICX neurons perform on the results of frequency integration. This fact does not mean that mammals lack a stage that covers a broader range of frequencies. The ICX of Guinea pigs contains arrays of neurons that are selective for the direction of sound sources (33). Although they require binaural stimuli, their frequency and ITD sensitivity are not known. Study of these neurons with dichotic stimuli would be interesting.
Acknowledgments
We thank Teresa Nick and Ben Arthur for critically reading the manuscript, Kourosh Saberi for information about human psychoacoustics, Gene Akutagawa for histological assistance, and Chris Malek for computer matters. This work was supported by National Institutes of Health Grant DC00134.
Footnotes
This paper was presented at the National Academy of Sciences colloquium “Auditory Neuroscience: Development, Transduction, and Integration,” held May 19–21, 2000, at the Arnold and Mabel Beckman Center in Irvine, CA.
Abbreviation footnote: ITD, interaural time difference; ITDi, interaural time difference, frequency independent; ICC, central nucleus of the inferior colliculus; ICX, external nucleus of the inferior colliculus; M−SP, main-side peak; NL, nucleus laminaris; PSP, postsynaptic potential.
References
- 1.Stern R M, Zeiberg A S, Trahiotis C. J Acoust Soc Am. 1988;84:156–165. doi: 10.1121/1.396982. [DOI] [PubMed] [Google Scholar]
- 2.Saberi K, Takahashi Y, Farahbod H, Konishi M. Proc Natl Acad Sci USA. 1998;95:6465–6468. doi: 10.1073/pnas.95.11.6465. [DOI] [PMC free article] [PubMed] [Google Scholar]
- 3.Jeffress L A. J Comp Physiol Psych. 1948;41:35–39. doi: 10.1037/h0061495. [DOI] [PubMed] [Google Scholar]
- 4.Jeffress L. In: Foundations of Modern Auditory Theory. Tobias J V, editor. II. New York: Academic; 1972. pp. 349–368. [Google Scholar]
- 5.Sayers B M, Cherry E C. J Acoust Soc Am. 1957;29:973–987. [Google Scholar]
- 6.Young S R, Rubel E W. J Comp Neurol. 1986;254:425–459. doi: 10.1002/cne.902540402. [DOI] [PubMed] [Google Scholar]
- 7.Carr C E, Konishi M. J Neurosci. 1990;10:3227–3246. doi: 10.1523/JNEUROSCI.10-10-03227.1990. [DOI] [PMC free article] [PubMed] [Google Scholar]
- 8.Smith P H, Joris P X, Yin T C. J Comp Neurol. 1993;331:245–260. doi: 10.1002/cne.903310208. [DOI] [PubMed] [Google Scholar]
- 9.Goldberg J M, Brown P B. J Neurophysiol. 1969;32:613–636. doi: 10.1152/jn.1969.32.4.613. [DOI] [PubMed] [Google Scholar]
- 10.Yin T C T, Chan C K. J Neurophysiol. 1990;64:465–487. doi: 10.1152/jn.1990.64.2.465. [DOI] [PubMed] [Google Scholar]
- 11.Knudsen I E, Konishi M. J Neurophysiol. 1978;41:870–884. doi: 10.1152/jn.1978.41.4.870. [DOI] [PubMed] [Google Scholar]
- 12.Takahashi T, Konishi M. J Neurosci. 1986;6:3413–3422. doi: 10.1523/JNEUROSCI.06-12-03413.1986. [DOI] [PMC free article] [PubMed] [Google Scholar]
- 13.Mazer J A. Proc Natl Acad Sci USA. 1998;95:10932–10937. doi: 10.1073/pnas.95.18.10932. [DOI] [PMC free article] [PubMed] [Google Scholar]
- 14.Wagner H, Takahashi T, Konishi M. J Neurosci. 1987;7:3105–3116. doi: 10.1523/JNEUROSCI.07-10-03105.1987. [DOI] [PMC free article] [PubMed] [Google Scholar]
- 15.Konishi M, Takahashi T, Wagner H, Sullivan W E, Carr C E. In: Auditory Function: Neurobiological Bases of Hearing. Edelman G, Gall W E, Cowan W M, editors. New York: Wiley; 1988. pp. 721–745. [Google Scholar]
- 16.Albeck Y, Konishi M. J Neurophysiol. 1995;74:1689–1700. doi: 10.1152/jn.1995.74.4.1689. [DOI] [PubMed] [Google Scholar]
- 17.Colburn H S. J Acoust Soc Am. 1973;54:1458–1470. doi: 10.1121/1.1914445. [DOI] [PubMed] [Google Scholar]
- 18.Trahiotis C, Stern R M. J Acoust Soc Am. 1994;96:3804–3806. doi: 10.1121/1.410570. [DOI] [PubMed] [Google Scholar]
- 19.Shackleton T M, Meddis R, Hewitt M J. J Acoust Soc Am. 1992;91:2276–2279. doi: 10.1121/1.403696. [DOI] [PubMed] [Google Scholar]
- 20.Jagadeesh B, Wheat H S, Kontsevich L L, Tyler C W, Ferster D. J Neurophysiol. 1997;78:2772–2789. doi: 10.1152/jn.1997.78.5.2772. [DOI] [PubMed] [Google Scholar]
- 21.Kita H, Armstrong W. J Neurosci Methods. 1991;37:141–150. doi: 10.1016/0165-0270(91)90124-i. [DOI] [PubMed] [Google Scholar]
- 22.Peña J L, Viete S M, Albeck Y, Konishi M. J Neurosci. 1997;17:1815–1824. doi: 10.1523/JNEUROSCI.17-05-01815.1997. [DOI] [PMC free article] [PubMed] [Google Scholar]
- 23.Viete S M, Peña J L, Konishi M. J Neurosci. 1997;17:1815–1824. doi: 10.1523/JNEUROSCI.17-05-01815.1997. [DOI] [PMC free article] [PubMed] [Google Scholar]
- 24.Takahashi T, Konishi M. J Comp Neurol. 1988;274:190–211. doi: 10.1002/cne.902740206. [DOI] [PubMed] [Google Scholar]
- 25.Takahashi T, Wagner H, Konishi M. J Comp Neurol. 1989;281:545–554. doi: 10.1002/cne.902810405. [DOI] [PubMed] [Google Scholar]
- 26.Saberi K, Takahashi Y, Konishi M, Albeck Y, Arthur B J, Farahbod H. Neuron. 1998;21:789–798. doi: 10.1016/s0896-6273(00)80595-4. [DOI] [PubMed] [Google Scholar]
- 27.Fujita I, Konishi M. J Neurosci. 1991;11:722–739. doi: 10.1523/JNEUROSCI.11-03-00722.1991. [DOI] [PMC free article] [PubMed] [Google Scholar]
- 28.Mori K. Hearing Res. 1997;111:22–30. doi: 10.1016/s0378-5955(97)00090-7. [DOI] [PubMed] [Google Scholar]
- 29.Yin T C T, Chan C K. In: Auditory Function: Neurobiological Bases of Hearing. Edelman G, Gall W E, Cowan W M, editors. New York: Wiley; 1986. pp. 385–430. [Google Scholar]
- 30.Yin T C T, Chan C K, Irvine D R F. J Neurophysiol. 1986;55:280–300. doi: 10.1152/jn.1986.55.2.280. [DOI] [PubMed] [Google Scholar]
- 31.Chan J C K, Yin T C T, Musicant A D. J Neurophysiol. 1987;58:543–561. doi: 10.1152/jn.1987.58.3.543. [DOI] [PubMed] [Google Scholar]
- 32.Kiang N Y-S. Discharge Patterns of Single Fibers in the Cat's Auditory Nerve. Cambridge, MA: MIT Press; 1965. [Google Scholar]
- 33.Binns K E, Grant S, Whithington D J, Keating M J. Brain Res. 1992;589:231–242. doi: 10.1016/0006-8993(92)91282-j. [DOI] [PubMed] [Google Scholar]