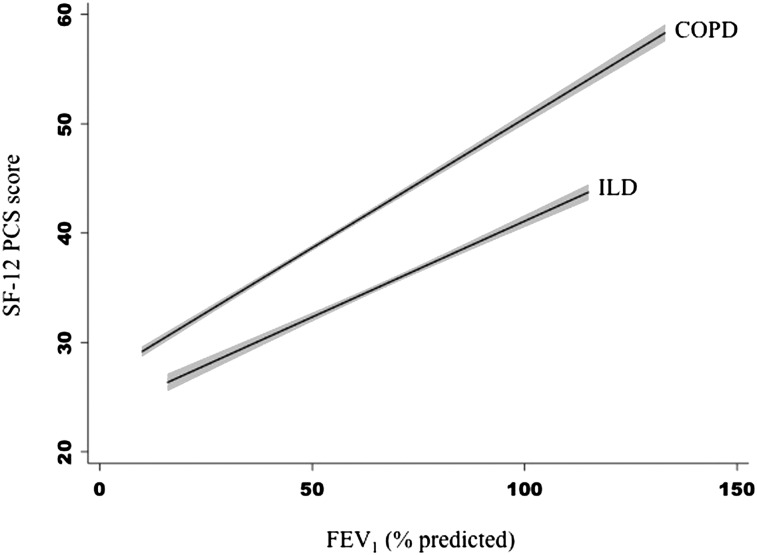
Figure 2.
Slope of the adjusted relationship between FEV1 % predicted and SF-12 PCS score varies by diagnosis. Participants with ILD on average had lower SF-12 PCS scores, indicating worse HRQL compared with those with COPD with similar degrees of ventilatory impairment. However, the slope of the relationship between SF-12 PCS score and FEV1 % predicted was steeper in COPD, indicating greater differences in HRQL for similar differences in FEV1 % in COPD compared with ILD. The gray area around the fitted lines indicates the 95% CI around the estimate. SF-12 = Short Form-12. See Figure 1 legend for expansion of other abbreviations.

