

Abstract
Phase images obtained with gradient echo MRI provide image contrast distinct from T1- and T2-weighted images. It is commonly assumed that the local contribution to MRI signal phase directly relates to local bulk tissue magnetic susceptibility. Here, we use Maxwell’s equations and Monte Carlo simulations to provide theoretical background to the hypothesis that the local contribution to MRI signal phase does not depend on tissue bulk magnetic susceptibility but tissue magnetic architecture—distribution of magnetic susceptibility inclusions (lipids, proteins, iron, etc.) at the cellular and subcellular levels. Specifically, we show that the regular longitudinal structures forming cylindrical axons (myelin sheaths and neurofilaments) can be locally invisible in phase images. Contrary to an expectation that the phase contrast in multiple sclerosis lesions should always increase in degree along with worsening of lesion severity (which happens for all known MR magnitude-based contrast mechanisms), we show that phase contrast can actually disappear with extreme tissue destruction. We also show that the phase contrast in multiple sclerosis lesions could be altered without loss of nervous system tissue, which happens in mild injury to the myelin sheaths or axonal neurofilaments. Moreover, we predict that the sign of phase contrast in multiple sclerosis lesions indicates the predominant type of tissue injury—myelin damage (positive sign) vs. axonal neurofilament damage (negative sign). Therefore, our theoretical and experimental results shed light on understanding the relationship between gradient echo MRI signal phase and multiple sclerosis pathology.
Keywords: CNS, neuronal integrity, phase imaging, demyelination, generalized lorentzian approach
MRI has played a revolutionary role in enhancing knowledge in biology and medicine. Numerous MRI techniques have been developed over the years to aid physicians and scientists in understanding tissue structure and function in health and disease. One MRI technique that has been of increasing interest in recent years relies on phase images obtained by gradient echo (GE) MRI. It was shown that phase images provide image contrast distinct from T1-weighted (T1W) and T2-weighted (T2W) images (1–6). However, the sources of phase contrast have not been completely understood and are a subject of intense debate. Myelin was proposed as one of the main contributors to MR signal phase in white matter (7), and it was shown that demyelination leads to a loss of phase contrast between white matter (WM) and gray matter (GM) (8, 9). This finding could have been explained by the difference in tissue cellular/molecular content (iron, lipids, and proteins) between GM and WM. However, it was also reported that phase contrast is practically absent between WM and CSF (cerebrospinal fluid) (3, 6), despite substantial differences in their molecular content. Iron was shown to play an important role in formation of phase contrast in iron-rich areas, such as caudate, putamen, and globus pallidus (10–13). However, experimental data on the role of iron in WM is controversial; although a decrease of the phase contrast after iron extraction from the fixed brain tissue was reported in the work in ref. 7, this effect was not seen in the work in ref. 9. It was also concluded in the work in ref. 14 that the MR phase contrast between cortical GM and WM can be mainly attributed to variations in myelin content but not iron concentration. Similar uncertainty exists in the study of multiple sclerosis using phase imaging, one of its emerging applications. In initial publications (12, 15, 16), a variety of manifestations of multiple sclerosis lesions (MSLs) in phase images was reported. It was noted that some lesions seen on phase images were also seen on T1W and T2W images, but some alterations were unique to phase images. Also, some lesions detected on T1W and T2W images were not seen on phase images. One hypothesis proposed to explain phase contrast is based on an assumed mechanism that relates MR signal phase/frequency shift to iron content in the tissue (12, 15, 16). However, this mechanism does not take into account the hallmarks of MSLs—the loss of axons and myelin (17).
Bridging the gap between these controversial findings is one of the main goals of this article. To this end, we provide theoretical background to the hypothesis that the local contribution to the MRI signal phase does not depend on bulk tissue content but does depend on tissue magnetic architecture—distribution of magnetic susceptibility inclusions (lipids, proteins, iron, etc.) at the cellular and subcellular levels (6). This finding allowed us not only to shed light on the above-mentioned controversies but also propose a theory of MRI phase contrast in multiple sclerosis. We show herein that, according to this mechanism, phase contrast in MSLs could appear simply because of injury to the myelin sheath, even without its removal from the affected area, thus preserving bulk tissue magnetic susceptibility. Our theoretical concept indicates that phase contrast is sensitive to mild lesions and thus, may appear abruptly at lesion onset when damage is still minimal. Our preliminary data in several human subjects show abnormalities seen only on phase and not magnitude images within the areas with borderline abnormal tissue damage, which can be explained by our theoretical prediction that the phase contrast in MSLs could be altered with mild injury to the myelin sheath or axonal neurofilaments. Hence, these phase abnormalities may represent mild or early MSLs. Contrary to a common sense expectation that the phase contrast in MSLs should always increase in degree along with worsening of lesion severity (which happens for all known MR magnitude-based contrast mechanisms), we show that phase contrast can actually disappear in situations of medium to severe tissue destruction. Moreover, we predict that the sign of phase contrast in MSLs indicates the predominant type of tissue injury—myelin damage (positive sign) vs. axonal neurofilament damage (negative sign). In the current paper, we provide theoretical and experimental evidence supporting these mechanisms of phase contrast in MSL. Our findings have potential to expand the information provided by CNS imaging both for understanding multiple sclerosis pathophysiology and as an endpoint in clinical trials (18).
Results and Discussion
Theory and Monte Carlo Simulations of Phase Contrast.
Tissue magnetic architecture at the global (organ or body part) and cellular/subcellular levels depends on the structural (geometric) arrangement of the main tissue components (proteins, lipids, iron, etc.) that, as far as MRI is concerned, act as magnetic susceptibility inclusions. In an external magnetic field B0, magnetic susceptibility inclusions become magnetized and induce their own magnetic fields that affect (shift) Larmor resonance frequencies of water molecules. WM structure can be described as mainly comprised of quasicylindrical myelinated axons. The induced magnetic field in these axonal bundles (tracts) is generated by several sources: (i) longitudinally arranged myelin sheaths and intraaxonal neurofilaments that run mostly parallel to the axonal tract axis, (ii) isotropically distributed free-floating organelles, proteins, lipids, etc., and (iii) the interface between the WM tract and the surrounding tissue.
In a GE experiment, the contribution of each water molecule, diffusing in the inhomogeneous magnetic field, to the MR signal at GE time TE (time of echo) can be represented as  , where
  is the phase accumulated by the diffusing molecule along its trajectory
  ;
;  is a projection of the local magnetic field created by all of the sources of magnetic field inhomogeneities at point
  on the external magnetic field B0. According to well-known results from Maxwell’s equations, the distribution of magnetic fields in the cylinder-like structures depends mostly on the position in the transverse plane. Because water molecules in WM are confined to either intracellular or extracellular spaces, with the transverse sizes about or less than 1 μm, it requires less than 1 ms to sample the whole distribution of the magnetic field within a given compartment (water diffusion coefficient is about 1 μm2/ms). Thus, for GE time TE greater than 1 ms used in experiments, all diffusing nuclei in the same compartment sample the whole distribution of magnetic fields within a given compartment and therefore, accumulate similar phases (motional averaging regimen). Effectively, a diffusing water molecule feels an average magnetic field
  in the compartment where it resides; therefore,
  , where
  is an average frequency shift in the mth compartment. Based on this consideration, only an average magnetic field in each compartment should be calculated. In what follows, we will use this equation and computer Monte Carlo simulations to quantify influence of WM microstructure on MR signal phase.
Structural Disordering as a Mechanism of the Phase Contrast.
Fig. 1A represents a schematic structure of an intact myelinated axon (intracellular water, myelin sheath, and extracellular water). Computer Monte Carlo simulations of the MR signal frequency shift were performed in the intact myelinated axon and an axon undergoing demyelination typical of multiple sclerosis (Fig. 1 B and C). The latter was modeled by fragmenting the cylindrical structure of the myelin sheath to different degrees. The fragments were modeled as spheres with positive magnetic susceptibility with respect to water (because lipids and iron each provide a positive magnetic susceptibility, whereas proteins have a primarily negative contribution) (6). The phase accumulated by diffusing water molecules was calculated based on the well-known expressions using Maxwell’s equations for magnetic field created by cylinders and spheres (19). The calculations revealed that, for all of the structures in Fig. 1, the water MR frequency shift could be described as follows (Eq. 1):
Fig. 1.

Effect of increasing myelin sheath damage on phase/frequency of MR signal derived from computer Monte Carlo simulations. (A) Schematic of an intact axon (internal cylinder) covered by a myelin sheath (bold outline of cylinder) in an extracellular space (between bold and outer cylinder) with radius R0. (B) Mildly damaged myelin sheath: fragments of the original structure are slightly scattered. (C) Severely damaged myelin sheath: fragments of initial structure are scattered randomly. (Lower) Dependence of the LF in the MR signal frequency shift on the level of destruction (δR is the average fragments’ displacement). The shaded zone (0–0.2) indicates minor injury to tissue, where even a small increase in the disorder parameter δR (horizontal axis) will rapidly and dramatically change the LF and hence, also change signal phase/frequency.
In this equation (and the equations that follow), we define the magnetic susceptibility χ as a product of  − volume magnetic susceptibility of magnetic susceptibility inclusions (myelin sheath and/or its fragments) and their volume fraction
  (Eq. 2):
Throughout this paper, we define all magnetic susceptibilities relative to magnetic susceptibility of water. The proportionality coefficient Lorenzian factor (LF) varies with different levels of damage to the myelin sheath. Note that the LF is equal to  only for randomly scattered fragments; this case is usually referred to as a Lorentzian sphere approach (20). For all other cases, LF is less than
  , approaching zero for the intact axon. Therefore, as previously suggested (6), the Lorentzian sphere approach is not valid for describing the magnetic susceptibility frequency shift in normal WM, which is highly directional. An additional factor that contributes to the frequency shift is the object’s (axonal) general external shape:
  . For the structure in Fig. 1, where B0 is parallel to the axonal axis, the shape factor (SF) is zero, and the frequency shift is completely determined by the LF (Eq. 1).
The results of Monte Carlo simulations for an oblique direction of an axon with respect to magnetic field B0 confirmed a theoretical prediction of zero frequency shift for the intact axon, regardless of axonal orientation (6). This important result is caused by cancellation of contributions from LF characteristic for longitudinal structures,  (6), and the SF for circular cylinder,
  . At the same time, for a scattered case (Fig. 1C), the LF is equal to
  and does not depend on axonal orientation, whereas the SF does depend on axonal orientation.
Fig. 1 presents results for a simplified case where only intact or damaged myelin sheath contributes to susceptibility induced MR signal phase shift. The true situation is more complicated because of the presence of components in addition to myelin, and it will be discussed below. However, the contribution from proteinaceous neurofilaments is qualitatively similar (although with the opposite sign), because they are also organized in longitudinal structures.
Frequency Shift Between Intact Axon and Surrounding Tissue: Effect of WM Darkness.
To understand phase contrast in injured multiple sclerosis tissue, we first need to understand phase contrast in a normal brain. In general, the intact myelinated axon can be described as comprised of longitudinal structures with magnetic susceptibility  (myelin and neurofilaments) aligned along the axonal axis and isotropic components (free-floating organelles, proteins, lipids, etc.) with magnetic susceptibility
  . Hence, the total Lorentzian contribution to the MR signal frequency shift is a combination of the two:
 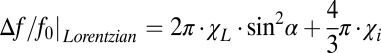 . For a circular cylindrical myelinated axonal bundle (tract) surrounded by an isotropic media (like CSF or GM) with magnetic susceptibility
  , the contribution from the interface (tract SF) between the tract and the media is equal to
 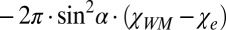 , where
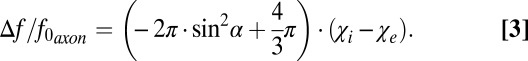
 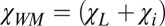 is the total susceptibility of WM. Thus, the total frequency difference between a circular cylindrical axonal tract and the external media can be written as (Eq. 3)
 |
Note that, for noncircular cylindrical tracts, this dependence is more complicated (6).
The fact that the longitudinal structures (myelin sheaths, neurofilaments, etc.) do not contribute to the total frequency shift of the cylindrical axon when magnetic field B0 is parallel to the axonal axis is a direct consequence of Maxwell’s equations: the induced magnetization of long cylindrical structures parallel to B0 does not create any magnetic field outside the structures themselves. This finding is not true when B0 forms an angle with the axonal axis. However, the average magnetic field contributing to the frequency shift around the intact myelin sheath (or neurofilaments) is zero for an arbitrary orientation of B0 with respect to the axonal axis.
One of the important consequences of Eq. 3 is that the terms proportional to  cancel each other for circular cylindrical axonal bundles (i.e., the longitudinal structures do not contribute to frequency contrast between such a bundle and any adjacent isotropic media). Therefore, in the regions of the brain, such as the cortex, where gyri and sulci abut one another, the intact cylindrical axons in gyri should have very small frequency shifts relative to CSF in the sulci. This effect, first predicted in the work by He and Yablonskiy (6), is counterintuitive, because there is a substantial difference between the total magnetic susceptibility of WM (
 ) and the total magnetic susceptibility of CSF (
 ). One could, therefore, expect a substantial phase contrast between WM and CSF. However, according to Eq. 3, the frequency shift is determined not by the difference
  but the difference
  , where
  comprises a small fraction of the total magnetic susceptibility of WM
  , leading to very little contrast between WM and CSF (6). A slight deviation from axonal circularity should not have much effect on phase signal, because it is counteracted by a distribution of axonal shapes in WM bundles that, on average, can be considered as circular cylinders. For WM structures that are not circular cylinders (e.g., corpus callosum), frequency shift does depend on the structure global shape, the total magnetic susceptibilities of WM, and the surrounding environment (6).
In the same manner, Eq. 3 also explains negative WM/GM contrast, which is also counterintuitive, because WM has higher magnetic susceptibility than GM (6). However, according to Eq. 3, the phase/frequency contrast between WM and GM is proportional to  , which is essentially magnetic susceptibility of GM (with the negative sign), because
  comprises only a small fraction of the total magnetic susceptibility of WM. These results are in agreement with previous observations (3, 6), where the dominant bright regions in phase images belong to GM, whereas WM and CSF are usually dark. Exceptions are areas of high concentrations of iron (e.g., caudate nuclei) (12). Such a dark background provides a convenient display for MSLs that have mostly (but not always) positive phases (see examples below) caused by the effect of myelin disordering in multiple sclerosis described above.
Phase Contrast in Multiple Sclerosis Tissue: Theoretical Predictions.
An essential feature of the plot in Fig. 1 generated by computer simulations is the steep growth of the LF predicted to occur with only minor damage to the myelin sheath (shaded zone). Thus, even small abnormalities in multiple sclerosis-affected CNS may cause substantial (positive in sign) changes in MR signal phase. A theoretical consideration for axonal damage (destruction of neurofilaments) leads to a similar scenario with one important difference—phase/frequency as a function of neurofilament destruction experiences negative changes. This result is because neurofilaments are formed from proteins that have a negative magnetic susceptibility with respect to water, whereas myelin is >70% lipid and also contains relatively more iron (lipids and iron both have positive susceptibility with respect to water) (6). Because frequency shift in Eq. 1 is a product of two factors—LF and tissue magnetic susceptibility ( in this case)—one can expect that, with tissue destruction, phase will experience major changes for mildly damaged longitudinal structures because of the steep increase in LF. However, decrease in tissue magnetic susceptibility (i.e., volume fraction of susceptibility inclusions) (Eq. 2) because of tissue removal from the damaged area may lead to reduction of phase/frequency changes for severely damaged tissue. To characterize tissue damage in multiple sclerosis, we used a previously introduced (21) quantitative parameter—tissue damage score (TDS). TDS around zero corresponds to normal tissue, and TDS = 1 corresponds to severely injured tissue (black holes). Both TDS and MRI signal frequency/phase are obtained herein using the GE plural contrast imaging (GEPCI) technique (22), which is described in Materials and Methods.
Importantly, the sign of phase/frequency changes depends on the type of injured tissue (axonal filaments vs. myelin). With myelin damage and intact neurofilaments, the change is positive, whereas in the case of damage to proteinaceous neurofilaments within intact myelin, the change is negative. This scenario is depicted in Fig. 2. However, the latter case would typically occur in the setting of myelin destruction with possible additional components of lipids and iron, which would offset the negative phase change. This finding is consistent with our observation and the observations of others (16) that negative phase changes in MSLs are very rare.
Fig. 2.

Schematic structure of the MR signal phase/frequency change with MSL severity for two types of tissue destruction. (Left) Pure myelin injury. (Right) Pure injury to neurofilaments. Minimal myelin injury, which may not be apparent on standard T2W and T1W images, will appear positive by phase, corresponding to the initial ascending portion of Left (also in Fig. 1). For moderately severe lesions with predominant myelin injury (center of the left figure has a medium TDS score), phase will also be positive. However, axon destruction is often also present, and the relative degree of myelin and neurofilament destruction will affect the sign of the phase change. Severe lesions, such as persistent black holes, with a high TDS score and significant destruction of both myelin and axons might disappear on phase images.
Based on the above consideration, the following scenario describes MRI phase/frequency behavior according to the type and severity of multiple sclerosis tissue damage.
i) Normal WM, having mostly longitudinal structure, has little local effect on MR signal phase.
ii) At the initial stages of MSL development with demyelination, small alterations in this longitudinal structure would become visible on phase images. This alteration might happen even before detection using other techniques. Hence, MR signal phase might serve as a very sensitive biomarker for minimal abnormalities or early MSL development. Importantly, damage to myelin would cause an increase in signal phase (positive contrast), whereas damage to axons would cause a decrease of signal phase (negative contrast). When axons degenerate, the surrounding myelin is also subsequently lost because of Wallerian degeneration. Thus, one would expect negative phase contrast to be relatively uncommon. If both myelin and axons are damaged, the phase contrast would be reduced (or may even disappear), because myelin and protein-based neurofilaments have opposite magnetic susceptibilities.
iii) For severely injured tissue, when cellular components (macromolecules) are removed from the site, magnetic susceptibility becomes small, leading to decreased phase contrast. Hence, for many cases with medium and severe damage, one can expect very small phase contrast. These scenarios can explain previous reports of phase changes being detected only for a subset of MSLs (12, 15). Images of active MSL pathology often reveal the entire width of the myelin sheath to be disrupted (23), but a small phase contrast can also be expected if demyelination were to proceed by gradual loss, layer by layer, of the myelin sheath.
Phase Contrast in Multiple Sclerosis Tissue: Experimental Results.
The example in Fig. 3 shows one MSL that has a range of TDSs from normal on periphery to severe damage at the lesion center. On FLAIR (Fluid Attenuated Inversion Recovery) image, it manifests itself as a bright ring with a dark core. The appearance on the GEPCI frequency map is similar to the appearance on FLAIR, although the abnormality is bigger in size and is surrounded by two dark strips. The sign (positive frequency indicates myelin damage) and pattern of phase changes compared with GEPCI TDS score are in agreement with our prediction that phase/frequency becomes abnormal for mildly damaged tissue (blue TDS), grows with the level of tissue injury, and disappears for highly destroyed tissue (lesion core indicated by red TDS). Dark areas on the GEPCI frequency map might correspond to predominantly axonal damage, whereas bright areas correspond to predominantly myelin damage.
Fig. 3.

Example of an MSL (marked by a blue rectangle) that has a range of TDS represented by the colors on the vertical bar. TDS is overlaid on T1f image. Data were obtained from a subject with relapsing remitting multiple sclerosis disease (female, age 42 y, EDSS 2.0).
Examples of changes in phase image in MSLs with no or very small TDS scores are shown in Fig. 4, orange and blue rectangles. These examples might represent changes in tissue microstructure that are not observed with conventional imaging techniques. The positive phase contrast indicates myelin damage.
Fig. 4.

Example of data obtained from a subject with secondary progressive multiple sclerosis (female, age 49, EDSS 6.5). Note the prominent contrast between GM and WM on the GEPCI T1f image compared with other images. Rectangles outline abnormalities observed on FLAIR or frequency (phase) maps. Orange rectangles denote an alteration seen in phase images (bright contrast) but not T1W, FLAIR, or GEPCI FST2*. This alteration may represent a very mild lesion with damaged myelin, and it is also seen on GEPCI T1f image as negative dark contrast. Blue rectangles outline a small MSL that is barely seen on FLAIR and GEPCI FST2*, and it is also visible on the phase image. Red rectangles outline a severe MSL (very high TDS score) that is seen on T1W, FLAIR, and GEPCI FST2* but does not have a footprint on the phase image. A magnified view of this lesion is shown in Inset with overlaid GEPCI TDS score in color according to the color bar.
According to Figs. 1 and 2, the phase contrast in severe lesions (black holes and high TDS score) can disappear, although these lesions would have substantially different magnetic susceptibility from the surrounding normal WM. An example of such a lesion is shown in Fig. 5, red rectangle. The absence of phase contrast, together with high TDS in this case, suggests that myelin and axonal debris are mostly removed from the lesion area.
Fig. 5.

Example of data obtained from a subject with relapsing remitting multiple sclerosis disease (male, age 52 y, EDSS 3.5) showing multiple lesions (red rectangles) with intermediate TDS scores (overlaid on GEPCI T1f image). Here, lesions seen on FLAIR are also seen on GEPCI T1W, GEPCI FST2* (GEPCI analog of FLAIR) and GEPCI frequency map. The area within the orange ovals also corresponds to intermediate TDS with low phase contrast.
Lesions of intermediate severity (intermediate GEPCI TDS score) appear on GEPCI T1W (hypointense), FLAIR, GEPCI FST2* (hyperintense), and phase/frequency maps. Several examples are shown in Fig. 5, red rectangles. The combination of TDS and phase appearance suggests that myelin is damaged but has myelin debris still present in the lesion area. At the same time, the lesion denoted by in Fig. 5, orange oval has similar TDS but very little phase contrast, suggesting damage to both myelin and axon that offset one another.
The theory of MSL manifestations on phase/frequency images proposed herein should be complemented by considerations of lesion shape and not only the internal lesion structure. Development of lesions of varying severity might lead to multiple appearances on phase images, because phase is a combination of multiple factors that include not only the change in tissue content and structure but also the shape and structure of the surrounding tissue. One potential approach to overcoming this problem is quantitative susceptibility mapping (QSM) (8, 24–27), where nonlocal effects of magnetic fields on phase image are removed by solving Maxwell’s equations for field distribution on a global level. The current state of this approach, however, assumes that MR signal phase relates to tissue magnetic susceptibility by means of a Lorentzian sphere approximation, which is not the case for WM in general and MSLs in particular as shown in the present study. Thus, the QSM technique, as a tool for analyzing WM structure and MSLs, awaits incorporation of a nonspherical Lorentzian relationship between MR signal phase and local magnetic field.
In this paper, we focus our attention on the most pronounced injuries to tissue in multiple sclerosis—myelin and axonal damage (17). Other components of the MSL (e.g., inflammatory cell infiltration, gliosis, and edema/increased extracellular space) can also be incorporated in our model. These components will be a subject of our future research. Other hypotheses of phase contrast that were also discussed previously include frequency shifts induced by water–macromolecule exchange in the tissue (4, 28, 29) and possible tissue magnetic susceptibility dependence on orientation with respect to the magnetic field B0 (30, 31), although their roles are not yet clear.
Conclusion
In this study, we propose a theory of phase contrast in multiple sclerosis and provide experimental and Monte Carlo simulated results supporting our theoretical predictions. Our theory is based on the newly introduced concept—the Generalized Lorentzian Approach—that allows relating MRI signal phase not to tissue bulk magnetic susceptibility but tissue magnetic architecture, the distribution of magnetic susceptibility inclusions (lipids, proteins, iron, etc.) at the cellular and subcellular levels (6). Our theory predicts that the phase contrast in MSLs could appear because of multiple sclerosis pathology affecting WM integrity, such as mild injury to the myelin sheath or neurofilaments, even with preserved tissue magnetic susceptibility. Also, contrary to a common sense expectation that the phase contrast in MSLs should always increase in magnitude with lesion worsening (which happens for all known MR magnitude imaging contrast mechanisms), our theory and experimental results indicate that phase contrast can actually disappear with extreme tissue destruction. We also show that the change in the phase contrast might be specific to a type of tissue injury—myelin (positive change) vs. neurofilaments (negative change). The GEPCI approach, providing simultaneous information on tissue signal phase, T2* and T1, shows unique potential to decipher the mechanisms underlying phase contrast. Our approach not only aids in understanding changes seen by phase imaging but opens a door to better understanding biological underpinnings of multiple sclerosis brain pathology; additionally, it has the potential to assist in optimizing design of clinical trials.
Materials and Methods
GEPCI.
A convenient way to study phase contrast in multiple sclerosis is by means of a GEPCI (21, 22, 32)—an MRI imaging technique that, based on multi-GE sequence, generates high-quality, high-resolution images with multiple contrasts from a single in vivo scan in <10 min. In a GE experiment, MR signal evolution from a voxel at a GE time TE is described by the equation (Eq. 4)
where function F(TE) is responsible for signal decay because of the effects of macroscopic magnetic field inhomogeneities (33). This equation is fitted to multi-GE data on a voxel-by-voxel basis, allowing simultaneous generation of  maps, T1W images (S0), and frequency maps (Δf) that were subsequently high pass-filtered. Previously, we applied the GEPCI technique to study multiple sclerosis, and based on the quantitative nature of the GEPCI method, we introduced GEPCI scores to measure multiple sclerosis tissue damage in lesions (21).
  values in the WM of multiple sclerosis subjects are distributed in a central quasi-Gaussian manner (comprising normal-appearing and diffusely abnormal WM) with a tail corresponding to low
  values in MSLs (21). The tissue
  relaxation rate constant was determined as a reflection of tissue damage in MSLs. Multiple sclerosis tissue damage results in the loss of macromolecules—mainly myelin sheaths and proteins in axons—leading to reduction in tissue
  relaxation rate constant. Thus, for each voxel in an MSL with a given
  value, the tissue damage can be characterized by TDS (21) (Eq. 5):
where  is the
  value characterizing the position of the peak in the distribution of
  values across WM for a given subject. Hence, TDS around zero corresponds to normal tissue, and TDS = 1 corresponds to severely injured tissue (black holes). In the present studies, we use this lesion classification for better understanding of the relationship between tissue damage in multiple sclerosis and phase contrast.
Image Acquisition.
Brain images were collected using a Siemens 3T Trio MRI scanner (Erlangen) and a 12-channel phased-array head coil. GEPCI data were obtained using a 3D version of the multi-GE sequence with a resolution of 1 × 1 × 3 mm3, field of view of 256 × 192 mm, and 11 GEs (repetition time = 50 ms, first TE = 4 ms, δTE = 4 ms, flip angle = 30°). To generate GEPCI images, raw data were reconstructed using Eq. 4. The frequency maps were high pass-filtered to remove effects of macroscopic field inhomogeneities using a 7 × 7 (of 256 × 256) in-plane averaging matrix. Image reconstruction and postprocessing were performed using a standard PC computer and Matlab software (MathWorks Inc). The automatic shimming procedure available on the Siemens scanner allowed substantial minimization of macroscopic field inhomogeneity effects. With our 3D high-resolution GEPCI approach, the deviation of the function F(TE) from unity was negligible in most parts of the brain important for multiple sclerosis. Hence, a simple fitting of the monoexponential function in Eq. 4 with F(TE) = 1 to the GEPCI signal was sufficient to generate GEPCI T2* and T1W images. GEPCI-FST2Star images that are R2* maps with suppressed signal from CSF and GEPCI T1f images (a combination of GEPCI T1W and frequency maps) with enhanced GM/WM contrast (22) were also created.
Standard Clinical Images Were also Obtained.
Forty-four contiguous 3-mm axial imaging sections were obtained with a 24-cm field of view, a matrix size of 256 × 192, and two types of Turbo SE sequences: (i) T2W images with repetition time = 6,800 ms and TE = 95 ms, bandwidth = 151 Hz/pixel, and turbo factor = 7; (ii) FLAIR images with inversion time = 2,310 ms, repetition time = 10,000 ms, and TE = 83 ms, bandwidth = 219 Hz/pixel, and turbo factor = 13; and (iii) T1W images using a standard SE sequence with repetition time = 600 ms and TE = 12 ms and bandwidth = 130 Hz/pixel. Total time for these three standard sequences was 16 min.
Human Subjects.
The human studies were approved by the Washington University Institutional Review Board, and all subjects provided written informed consent. One normal healthy subject, four subjects with relapsing remitting multiple sclerosis disease [sex/age/EDSS (Expanded Disability Status Scale) = male/42/1.5, male/52/3.5, male/39/2.5, and female/42/2.0], and one subject with secondary progressive disease (sex/age/EDSS = female/49/6.5) (34, 35) entered the study. Sixty lesions were studied by GEPCI magnitude and phase and standard imaging.
Acknowledgments
We thank Dr. Robert T. Naismith for review of the article. This work was supported by National Institutes of Health Grants R01NS55963 and UL1 RR024992, Department of Defense Grant MS090031, and the Manny and Rosalyn Rosenthal—Dr. John L. Trotter Chair in Neuroimmunology of Barnes–Jewish Hospital Foundation (A.H.C.).
Footnotes
Conflict of interest statement: A.H.C. was a consultant for Teva Pharmaceutical Industries Ltd., Biogen Idec Inc., F. Hoffmann–La Roche Ltd., MedImmune, and Coronado Biosciences. A.H.C. also discloses support from Novartis Research, F. Hoffmann–La Roche Ltd Research, and the Sanofi-aventis Group.
†This Direct Submission article had a prearranged editor.
References
- 1.Abduljalil AM, Schmalbrock P, Novak V, Chakeres DW. Enhanced gray and white matter contrast of phase susceptibility-weighted images in ultra-high-field magnetic resonance imaging. J Magn Reson Imaging. 2003;18:284–290. doi: 10.1002/jmri.10362. [DOI] [PubMed] [Google Scholar]
- 2.Rauscher A, Sedlacik J, Barth M, Mentzel HJ, Reichenbach JR. Magnetic susceptibility-weighted MR phase imaging of the human brain. AJNR Am J Neuroradiol. 2005;26:736–742. [PMC free article] [PubMed] [Google Scholar]
- 3.Duyn JH, et al. High-field MRI of brain cortical substructure based on signal phase. Proc Natl Acad Sci USA. 2007;104:11796–11801. doi: 10.1073/pnas.0610821104. [DOI] [PMC free article] [PubMed] [Google Scholar]
- 4.Zhong K, Leupold J, von Elverfeldt D, Speck O. The molecular basis for gray and white matter contrast in phase imaging. Neuroimage. 2008;40:1561–1566. doi: 10.1016/j.neuroimage.2008.01.061. [DOI] [PubMed] [Google Scholar]
- 5.Marques JP, Maddage R, Mlynarik V, Gruetter R. On the origin of the MR image phase contrast: An in vivo MR microscopy study of the rat brain at 14.1 T. Neuroimage. 2009;46:345–352. doi: 10.1016/j.neuroimage.2009.02.023. [DOI] [PubMed] [Google Scholar]
- 6.He X, Yablonskiy DA. Biophysical mechanisms of phase contrast in gradient echo MRI. Proc Natl Acad Sci USA. 2009;106:13558–13563. doi: 10.1073/pnas.0904899106. [DOI] [PMC free article] [PubMed] [Google Scholar]
- 7.Fukunaga M, et al. Layer-specific variation of iron content in cerebral cortex as a source of MRI contrast. Proc Natl Acad Sci USA. 2010;107:3834–3839. doi: 10.1073/pnas.0911177107. [DOI] [PMC free article] [PubMed] [Google Scholar]
- 8.Liu C, Li W, Johnson GA, Wu B. High-field (9.4 T) MRI of brain dysmyelination by quantitative mapping of magnetic susceptibility. Neuroimage. 2011;56:930–938. doi: 10.1016/j.neuroimage.2011.02.024. [DOI] [PMC free article] [PubMed] [Google Scholar]
- 9.Lodygensky GA, et al. In vivo assessment of myelination by phase imaging at high magnetic field. Neuroimage. 2012;59:1979–1987. doi: 10.1016/j.neuroimage.2011.09.057. [DOI] [PubMed] [Google Scholar]
- 10.Haacke EM, et al. Imaging iron stores in the brain using magnetic resonance imaging. Magn Reson Imaging. 2005;23:1–25. doi: 10.1016/j.mri.2004.10.001. [DOI] [PubMed] [Google Scholar]
- 11.Pfefferbaum A, Adalsteinsson E, Rohlfing T, Sullivan EV. MRI estimates of brain iron concentration in normal aging: Comparison of field-dependent (FDRI) and phase (SWI) methods. Neuroimage. 2009;47:493–500. doi: 10.1016/j.neuroimage.2009.05.006. [DOI] [PMC free article] [PubMed] [Google Scholar]
- 12.Hammond KE, et al. Quantitative in vivo magnetic resonance imaging of multiple sclerosis at 7 Tesla with sensitivity to iron. Ann Neurol. 2008;64:707–713. doi: 10.1002/ana.21582. [DOI] [PubMed] [Google Scholar]
- 13.Bilgic B, Pfefferbaum A, Rohlfing T, Sullivan EV, Adalsteinsson E. MRI estimates of brain iron concentration in normal aging using quantitative susceptibility mapping. Neuroimage. 2012;59:2625–2635. doi: 10.1016/j.neuroimage.2011.08.077. [DOI] [PMC free article] [PubMed] [Google Scholar]
- 14.Langkammer C, et al. Susceptibility induced gray-white matter MRI contrast in the human brain. Neuroimage. 2012;59:1413–1419. doi: 10.1016/j.neuroimage.2011.08.045. [DOI] [PMC free article] [PubMed] [Google Scholar]
- 15.Haacke EM, et al. Characterizing iron deposition in multiple sclerosis lesions using susceptibility weighted imaging. J Magn Reson Imaging. 2009;29:537–544. doi: 10.1002/jmri.21676. [DOI] [PMC free article] [PubMed] [Google Scholar]
- 16.Yao B, et al. Chronic multiple sclerosis lesions: Characterization with high-field-strength MR imaging. Radiology. 2012;262:206–215. doi: 10.1148/radiol.11110601. [DOI] [PMC free article] [PubMed] [Google Scholar]
- 17.Trapp BD, et al. Axonal transection in the lesions of multiple sclerosis. N Engl J Med. 1998;338:278–285. doi: 10.1056/NEJM199801293380502. [DOI] [PubMed] [Google Scholar]
- 18.Barkhof F, et al. MRI monitoring of immunomodulation in relapse-onset multiple sclerosis trials. Nat Rev Neurol. 2012;8:13–21. doi: 10.1038/nrneurol.2011.190. [DOI] [PubMed] [Google Scholar]
- 19.Yablonskiy DA, Haacke EM. Theory of NMR signal behavior in magnetically inhomogeneous tissues: The static dephasing regime. Magn Reson Med. 1994;32:749–763. doi: 10.1002/mrm.1910320610. [DOI] [PubMed] [Google Scholar]
- 20.Chu SC, Xu Y, Balschi JA, Springer CS., Jr Bulk magnetic susceptibility shifts in NMR studies of compartmentalized samples: Use of paramagnetic reagents. Magn Reson Med. 1990;13:239–262. doi: 10.1002/mrm.1910130207. [DOI] [PubMed] [Google Scholar]
- 21.Sati P, Cross AH, Luo J, Hildebolt CF, Yablonskiy DA. In vivo quantitative evaluation of brain tissue damage in multiple sclerosis using gradient echo plural contrast imaging technique. Neuroimage. 2010;51:1089–1097. doi: 10.1016/j.neuroimage.2010.03.045. [DOI] [PMC free article] [PubMed] [Google Scholar]
- 22.Luo J, Jagadeesan BD, Cross AH, Yablonskiy DA. Gradient echo plural contrast imaging—signal model and derived contrasts: T2*, T1, phase, SWI, T1f, FST2*and T2*-SWI. Neuroimage. 2012;60:1073–1082. doi: 10.1016/j.neuroimage.2012.01.108. [DOI] [PMC free article] [PubMed] [Google Scholar]
- 23.Frohman EM, Racke MK, Raine CS. Multiple sclerosis—the plaque and its pathogenesis. N Engl J Med. 2006;354:942–955. doi: 10.1056/NEJMra052130. [DOI] [PubMed] [Google Scholar]
- 24.de Rochefort L, Brown R, Prince MR, Wang Y. Quantitative MR susceptibility mapping using piece-wise constant regularized inversion of the magnetic field. Magn Reson Med. 2008;60:1003–1009. doi: 10.1002/mrm.21710. [DOI] [PubMed] [Google Scholar]
- 25.Shmueli K, et al. Magnetic susceptibility mapping of brain tissue in vivo using MRI phase data. Magn Reson Med. 2009;62:1510–1522. doi: 10.1002/mrm.22135. [DOI] [PMC free article] [PubMed] [Google Scholar]
- 26.Schweser F, Deistung A, Lehr BW, Reichenbach JR. Differentiation between diamagnetic and paramagnetic cerebral lesions based on magnetic susceptibility mapping. Med Phys. 2010;37:5165–5178. doi: 10.1118/1.3481505. [DOI] [PubMed] [Google Scholar]
- 27.de Rochefort L, et al. Quantitative susceptibility map reconstruction from MR phase data using bayesian regularization: Validation and application to brain imaging. Magn Reson Med. 2010;63:194–206. doi: 10.1002/mrm.22187. [DOI] [PubMed] [Google Scholar]
- 28.Luo J, He X, d’Avignon DA, Ackerman JJ, Yablonskiy DA. Protein-induced water 1H MR frequency shifts: Contributions from magnetic susceptibility and exchange effects. J Magn Reson. 2010;202:102–108. doi: 10.1016/j.jmr.2009.10.005. [DOI] [PMC free article] [PubMed] [Google Scholar]
- 29.Shmueli K, Dodd SJ, Li TQ, Duyn JH. The contribution of chemical exchange to MRI frequency shifts in brain tissue. Magn Reson Med. 2011;65:35–43. doi: 10.1002/mrm.22604. [DOI] [PMC free article] [PubMed] [Google Scholar]
- 30.Lee J, et al. Sensitivity of MRI resonance frequency to the orientation of brain tissue microstructure. Proc Natl Acad Sci USA. 2010;107:5130–5135. doi: 10.1073/pnas.0910222107. [DOI] [PMC free article] [PubMed] [Google Scholar]
- 31.Liu C. Susceptibility tensor imaging. Magn Reson Med. 2010;63:1471–1477. doi: 10.1002/mrm.22482. [DOI] [PMC free article] [PubMed] [Google Scholar]
- 32.Yablonskiy DA. 2000. Gradient echo plural contrast imaging (GEPCI): New fast magnetic resonance imaging technique for simultaneous acquisition of T2, T1 (or spin density) and T2*-weighted images. Radiology 217(Suppl):204.
- 33.Yablonskiy DA. Quantitation of intrinsic magnetic susceptibility-related effects in a tissue matrix. Phantom study. Magn Reson Med. 1998;39:417–428. doi: 10.1002/mrm.1910390312. [DOI] [PubMed] [Google Scholar]
- 34.Lublin FD, Reingold SC. National Multiple Sclerosis Society (USA) Advisory Committee on Clinical Trials of New Agents in Multiple Sclerosis Defining the clinical course of multiple sclerosis: Results of an international survey. Neurology. 1996;46:907–911. doi: 10.1212/wnl.46.4.907. [DOI] [PubMed] [Google Scholar]
- 35.McDonald WI, et al. Recommended diagnostic criteria for multiple sclerosis: Guidelines from the International Panel on the diagnosis of multiple sclerosis. Ann Neurol. 2001;50:121–127. doi: 10.1002/ana.1032. [DOI] [PubMed] [Google Scholar]