Abstract
Between November 2009 and September 2011, temporary seismographs deployed under the EarthScope USArray program were situated on a 70-km grid covering the Barnett Shale in Texas, recording data that allowed sensing and locating regional earthquakes with magnitudes 1.5 and larger. I analyzed these data and located 67 earthquakes, more than eight times as many as reported by the National Earthquake Information Center. All 24 of the most reliably located epicenters occurred in eight groups within 3.2 km of one or more injection wells. These included wells near Dallas–Fort Worth and Cleburne, Texas, where earthquakes near injection wells were reported by the media in 2008 and 2009, as well as wells in six other locations, including several where no earthquakes have been reported previously. This suggests injection-triggered earthquakes are more common than is generally recognized. All the wells nearest to the earthquake groups reported maximum monthly injection rates exceeding 150,000 barrels of water per month (24,000 m3/mo) since October 2006. However, while 9 of 27 such wells in Johnson County were near earthquakes, elsewhere no earthquakes occurred near wells with similar injection rates. A plausible hypothesis to explain these observations is that injection only triggers earthquakes if injected fluids reach and relieve friction on a suitably oriented, nearby fault that is experiencing regional tectonic stress. Testing this hypothesis would require identifying geographic regions where there is interpreted subsurface structure information available to determine whether there are faults near seismically active and seismically quiescent injection wells.
Keywords: induced earthquakes, triggered earthquakes, unconventional gas development, seismic hazards, domestic energy policy
It has been recognized since the 1960s that fluid injection into the subsurface can trigger earthquakes (1, 2). Injection-triggered earthquakes have accompanied injection projects undertaken for various purposes, including the production of geothermal energy (3), secondary recovery in oil and gas fields (4), the disposal of fluid wastes, and (very rarely) hydrofracturing (5, 6).
Recently several widely publicized earthquake sequences have occurred near injection wells disposing of fluid wastes in Texas (7–9), Arkansas (10), West Virginia, Ohio, and elsewhere. These fluid wastes are a byproduct of hydrofracturing; hydrofracturing has been an essential technology contributing to the development of unconventional gas resources ongoing in several locations in the United States including the Barnett and Eagle Ford Shales in Texas, the Haynesville Shale of Texas and Louisiana, the Bakken Shale in North Dakota, and the Marcellus Shale in Pennsylvania, New York, and West Virginia. Although this development has enormously increased domestic energy reserves, it may have contributed to an observed increase since 2009 in the number of small-magnitude earthquakes in the central and eastern United States (11). It has also raised policy concerns about possible seismic hazards associated with the practice of disposing of hydrofracture flowback fluids in injection wells (12).
Most investigations of induced or triggered earthquakes take place only after an earthquake occurs that is severe enough to be felt by nearby residents and receive media attention. Such events usually have magnitudes of approximately 3 or greater and occur in populated areas. Limiting research only to these events doesn’t help us understand why some injection wells trigger seismic activity and others do not. I am unaware of any previous investigation comparing the properties of injection wells that do and do not induce earthquakes.
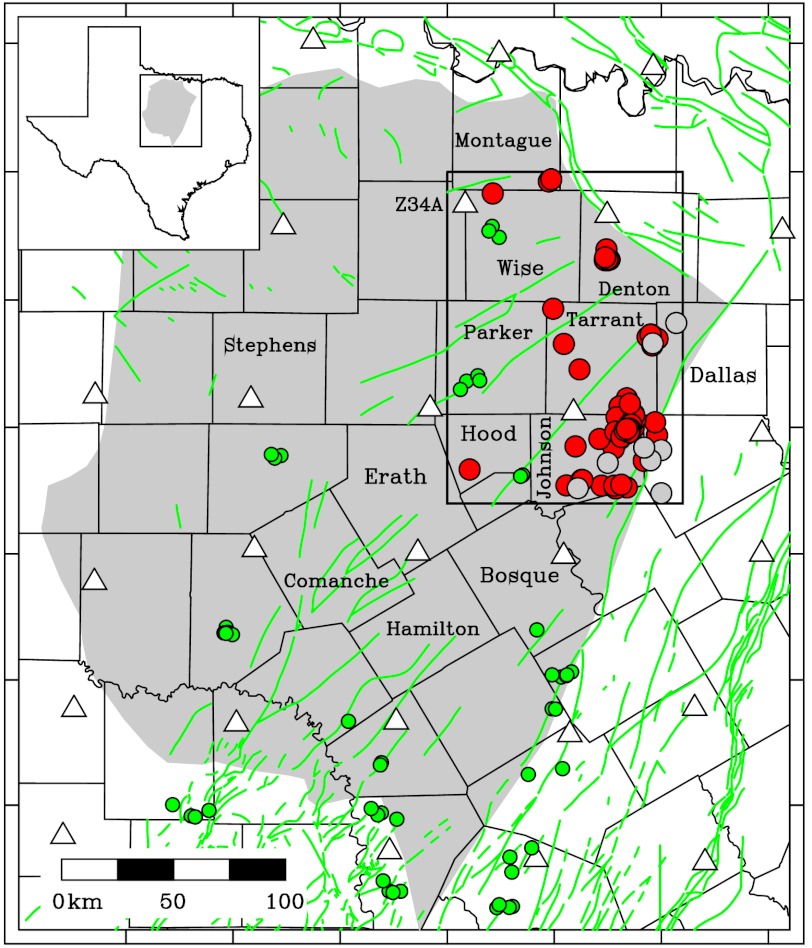
In the present study I evaluate seismic activity occurring between November 15, 2009 and September 15, 2011 within the Barnett Shale of Texas (Fig. 1). During this interval the National Science Foundation (NSF)-funded USArray program emplaced several hundred continuously recording, three-component broadband seismometers on a 70-km grid covering a 400-km-wide swath extending from the Canadian border to the Gulf of Mexico. In Texas, about 25 stations from this network were in or near the Barnett Shale recording data, allowing me to locate small regional earthquakes.
Fig. 1.
Map of Barnett Shale study area; the inset and rectangle at upper left show the area in Texas included in this map. Triangles are locations of USArray temporary seismic stations, red circles are earthquakes located in this study (Table S1), green circles are quarry blasts located in this study, and white circles are epicenters reported by the NEIC during study interval (Nov 15, 2009 to Sept 15, 2011). The gray shaded area is approximate extent of the Barnett Shale; green lines are mapped faults (18); black lines are boundaries of Texas counties; labels indicate names of counties mentioned in the text. Dallas and Fort Worth are situated in Dallas and Tarrant Counties, respectively; the town of Cleburne is in Johnson County. The rectangle in the Upper Right of figure indicates region mapped in Fig. 2.
An important objective of this study is to assess the relationship between the presence/absence of earthquakes and the characteristics of nearby injection wells. In Texas, the vast majority of injection wells are Class II wells used to stimulate oil or gas production or to dispose of wastes associated with petroleum production such as hydrofracture fluids; the Texas Railroad Commission (RRC), which no longer regulates railroads, is responsible for regulating activity related to petroleum production. The RRC issues permits for drilling wells, and by law petroleum producers also provide the RRC with certain information concerning fluid injection, both when it is used to stimulate production and also when it used to dispose of fluid wastes.
Results
Seismic Data: Quarry Blasts and Earthquakes.
Using a method to identify seismic phase arrivals by comparing short-term to long-term amplitude ratios, over the two-year study period I found 1,330 seismic events with arrivals at four or more USArray stations. Of these, 319 were events occurring outside the study area, often because their arrival times were within a few seconds of predicted arrivals for National Earthquake Information Center (NEIC)-reported distant earthquakes, or because the shear wave–compressional wave (S–P) intervals or other features of their seismograms indicated they weren’t local.
I identified an additional 507 events as quarry blasts. The appearance of seismograms for quarry blasts and earthquakes is different, as quarry blasts typically have much larger, more prominent surface waves, and relatively weaker P and S arrivals except at the closest stations (distances of 30 km or less). Most quarries blast repeatedly, and thus the characteristic appearance of their seismic signals becomes familiar to an analyst (Fig. S1). In some cases seismograms at the nearest USArray station exhibited an unusual, high-frequency, radially polarized arrival that traveled at 300 m/s, undoubtedly an airwave. Moreover, inspecting occurrence times for any characteristic group reveals that the events never occur at night or on weekends. I located representative events for 52 blasts from about a dozen groups (Fig. 1). In most cases, inspecting the locations on Google Maps revealed a quarry nearby; all quarry blast epicenters that had azimuthal gaps of 120° or smaller (all the “A”-quality locations, and some “B”-quality locations) were situated within 1.5 km from a visible quarry.
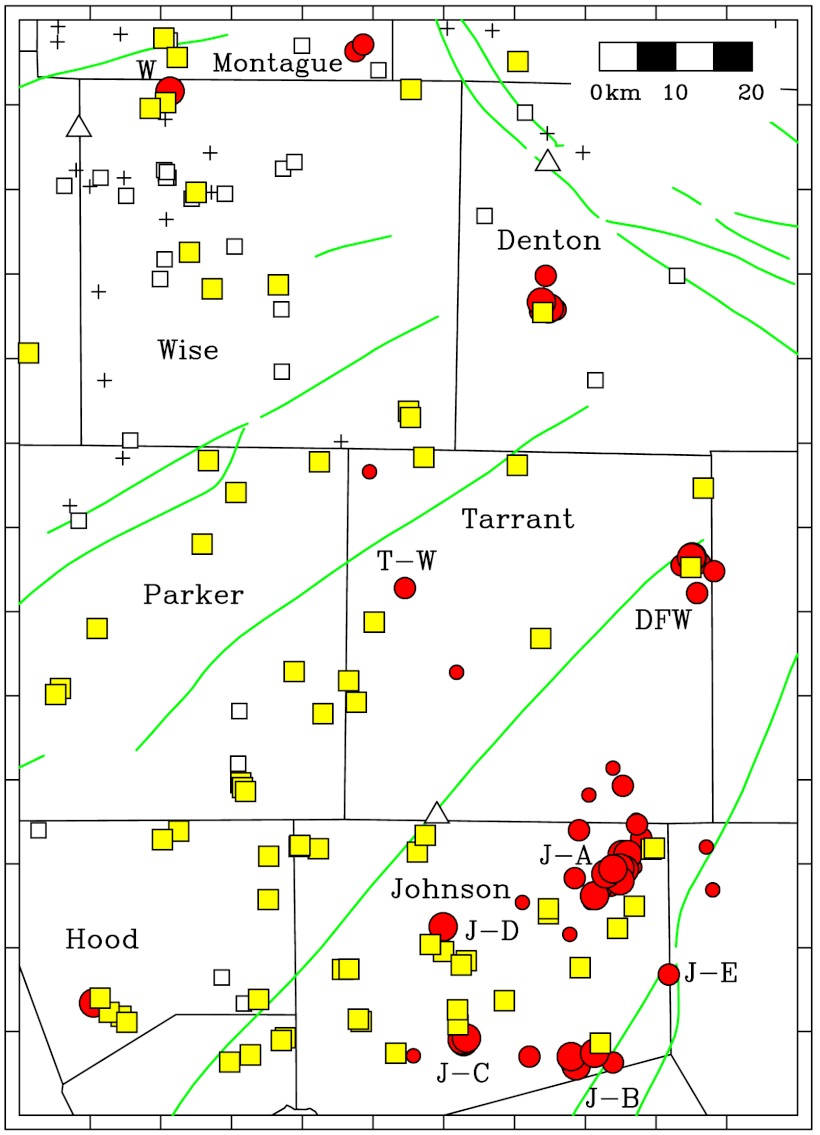
Among the remaining approximately 500 events, I was able to identify pickable P and S arrivals and determine epicenters for 67 earthquakes occurring within the study area (Figs. 1 and 2, Table 1 and Table S1). Of these, 46 were in Johnson County; most within three clusters (J-A, J-B, and J-Cleburne). In addition, there was a tightly clustered group of eight earthquakes in Denton County, and a cluster of six near the Dallas–Fort Worth airport between Tarrant and Dallas Counties. Finally, there were three isolated earthquakes in western Tarrant County, two events in Montague County, and single earthquakes in Wise and Hood Counties.
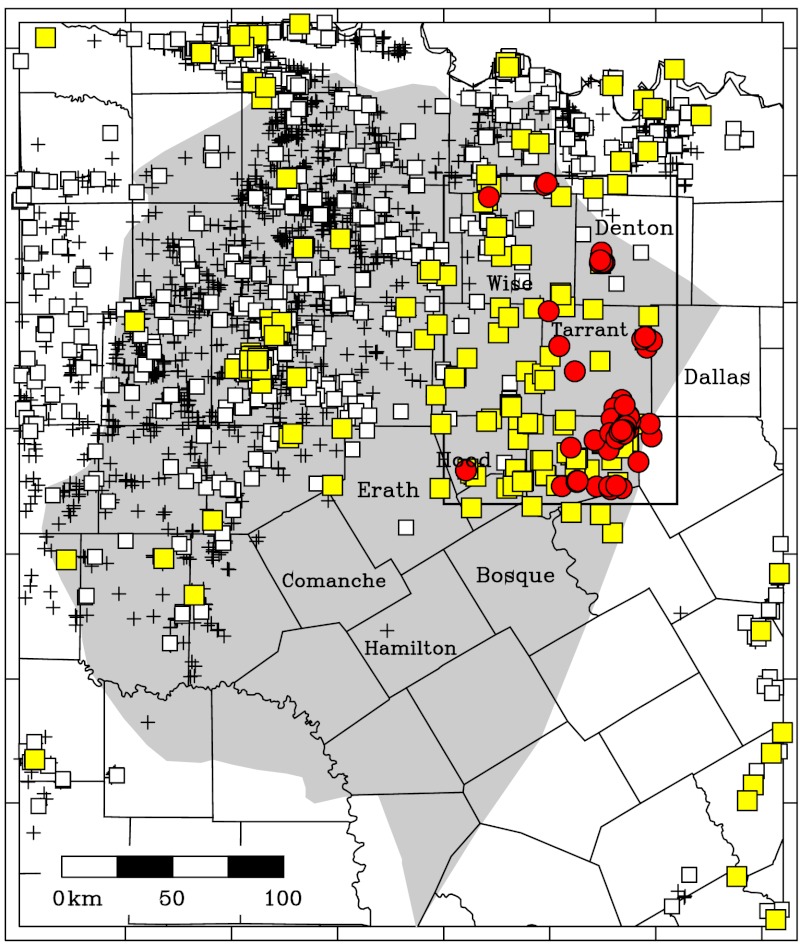
Fig. 2.
Map showing earthquake epicenters determined in this study (red circles), injection wells (squares and + symbols) in use since October 2006, seismograph stations (white triangles), and mapped faults (green lines, from ref. 16). Circle sizes indicate quality of epicentral location, with large, medium and small sizes indicating qualities A, B, and C. Labels designate events or clusters in Table 1. For injection wells, yellow squares are wells with maximum monthly injection rates exceeding 150,000 BWPM (24,000 m3/mo); white squares, exceeding 15,000 BWPM (2,400 m3/mo); + symbols, exceeding 1,500 BWPM (240 m3/mo).
Table 1.
Earthquake groups as located in this study and as reported by the NEIC and the ANF. Reports the number of earthquakes in each group and quality category. Quality is assigned considering number and geographic distribution of seismic data used for location, with A indicating best locations. Distances listed are for all injection wells within 5 km, if such exist, from closest A-quality epicenter in each group, if such exists
| County and Fig. 2 label of group | Quakes rept. by NEIC | Quakes rept. by ANF | Quakes identified in this study |
Distance: nearest wells (km) |
|||
| Quality A |
Quality B |
Quality C |
Cross-correlation |
||||
| Wise W | - | 1 | 1 | - | - | 1 | 1.6, 3.4, 4.5 |
| Montague | - | 1 | - | 2 | - | 2 | 3.9 |
| Denton | - | 4 | 3 | 4 | 1 | 40 | 0.9 |
| Tarrant T-W | - | 2 | - | 1 | 2 | 3 | 5.5 |
| Tarrant DFW | 2 | 3 | 2 | 4 | - | 3 | 1.3 |
| Hood | - | 1 | 1 | - | - | - | 1.1, 2.4, 4.0 |
| Johnson J-A | 3 | 6 | 8 | 15 | 9 | 24 | 3.2, 3.6, 5.0 |
| Johnson J-B | - | - | 3 | 4 | 0 | 3 | 1.6 |
| Johnson J-C (Cleburne) | 2 | 3 | 5 | - | 1 | 6 | 1.8, 3.8 |
| Johnson J-D | - | - | 1 | - | - | - | 2.9*, 2.9, 3.3 |
| Johnson J-E | 1 | 1 | - | 1 | - | - | 9.2 |
| totals | 8 | 22 | 24 | 31 | 13 | 82 | |
*All listed injection wells are Class II wells except for one Class I well 2.9 km from the J-D epicenter; this well’s location and injection history is virtually identical to a the Class II well near J-D (Fig. S2).
Only eight of these 67 located earthquakes were reported by the US Geological Survey’s National Earthquake Information Center (NEIC); only 22 are in the catalog compiled by the USArray’s Array Network Facility (ANF), the organization that manages USArray seismograph stations (SI Text). The differences between NEIC epicenters and those determined in this study ranged between 4 and 32 km, with five of the eight differences being between 9 and 16 km.
A reasonable estimate of location accuracy for the A-quality epicenters in this study is 1.5 km. This is consistent with the identification of quarries near A-quality blasts as mentioned above. And my locations for the five A-quality epicenters in the J-Cleburne group were all within 1.0 km of 2009 Cleburne epicenters located using a five-station temporary local network (8, 9).
Using signals recorded at the stations closest to several of the earthquake groups described above, I performed an autocorrelation analysis to search for additional unlocatable events too small to provide pickable P and S arrivals at three or more USArray stations. This search identified an additional 82 earthquakes (Table 1), with 40 of these associated with the Denton group.
The analysis of USArray data allowed me to locate more than eight times as many earthquakes are reported by the NEIC. For the earthquakes in Fig. 1, the eight events reported by the NEIC had magnitudes between 2.1 and 3.0 with a median of 2.5; the 59 additional earthquakes located using USArray data had magnitudes between 1.4 and 2.5 with a median of 2.0; and the 82 earthquakes identified by cross-correlation analysis had magnitudes between 1.4 and 1.8 with a median of 1.6.
Injection-Well Locations and Characteristics.
Within the Barnett Shale neighborhood mapped in Fig. 1 there are 2,458 injection wells reporting maximum monthly injection rates of 1,500 barrels of water per month (BWPM; 1,500 BWPM is 240 m3/mo) or greater since October 2006 (Table 2). Of these, 125 are within the seismically active area mapped in Fig. 2.
Table 2.
Characteristics of injection wells/leases in selected regions. Table values are number of permitted wells/leases; values in the “near earthquake (EQ)” column are number of wells where this study identified A-quality earthquake epicenters within 5 km; remaining columns are number of wells where maximum monthly injection rate between October 2006 and September 2011 exceeded specified value. Units for injection rates are barrels of water per month (BWPM); 1500 BWPM is 240 m3/mo
Most of the earthquakes identified in this study are situated close to injection wells. Eight of the epicenter groups possess A-quality epicenters (Table 1). All eight of these better-located groups have epicenters situated within 3.2 km of one or more of these injection wells, and six of these groups include epicenters within 2.0 km.
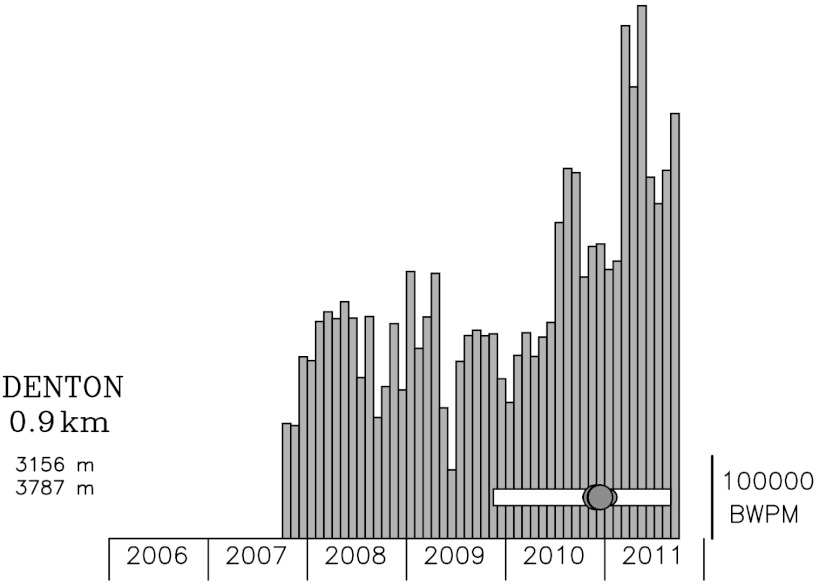
Injection had been ongoing at the wells near all eight of these epicentral groups prior to the known occurrence of earthquakes. Injection at all but one of these wells was at depths between 2 km and 4 km (Fig. 3 and Figs. S2 and S3). All had maximum monthly injection rates exceeding 150,000 BWPM (24,000 m3/mo), and generally these injection rates had been maintained for a year or more prior to the onset of earthquake activity (Figs. 3 and 4). The Dallas–Fort Worth (DFW) group is an exception: Earthquake activity began in October 2008 after only six weeks of injection at a nearby well (7); DFW earthquakes have continued into 2011 even although injection ceased in August 2009.
Fig. 3.
Monthly injection rates at the injection well near the Denton earthquake group identified in this study. Scale bar at right of histogram is 100,000 BWPM (16,000 m3/mo). The rectangle shows the time period of study; dark circles indicate earthquakes located in this study. Labels at Left indicate distance to epicenter and depth interval of injection. Injection rates for all other wells within 5 km of A- and B-quality epicenters are plotted in Figs. S2 and S3.
Fig. 4.
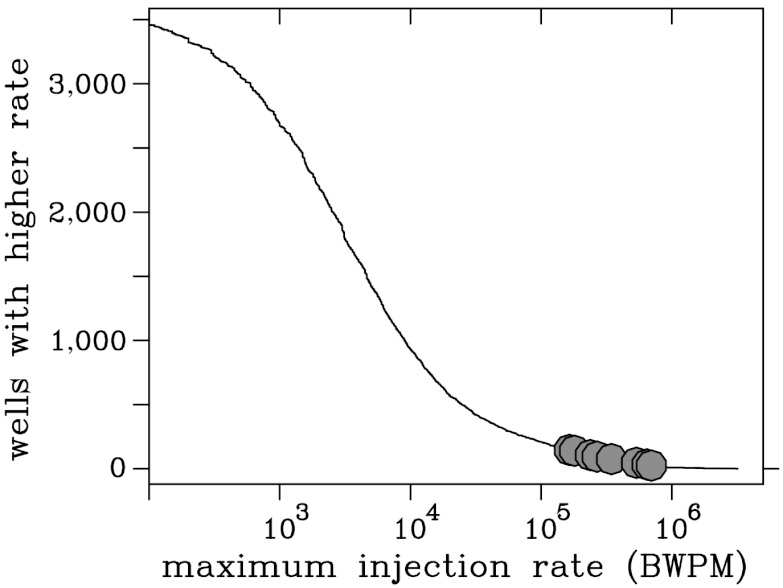
Cumulative distribution of highest monthly injection rates for wells in the region mapped in Fig. 5. The horizontal axis is the highest monthly injection rate between October 2006 and September 2011; the vertical axis is the number of wells exceeding plotted value. Dark circles correspond to maximum values for wells closest to the eight earthquake groups with A-quality epicenters identified in Fig. 2 and Table 1. Note that all eight have maximum injection rates exceeding 150,000 BWPM (24,000 m3/mo), a value exceeded by 160 wells in the mapped region (Figs. 1 and 5).
However, wells having sustained injection rates of 150,000 BWPM (24,000 m3/mo) are common; there were 161 such wells in the region mapped in Fig. 1, and almost 90% of these had no locatable earthquakes nearby (Table 2). For example, there are 14 such wells in Parker County with no nearby earthquakes, and 24 in Stephens County (Fig. 5). In Wise County there are nine such wells and only one locatable earthquake.
Fig. 5.
Map of Barnett Shale area as in Fig. 1, showing earthquakes located in this study (red circles) and injection wells in use since 2006 (squares and + symbols). Yellow squares are wells reporting maximum monthly injection rates exceeding 150,000 BWPM (24,000 m3/mo); white squares, exceeding 15,000 BWPM (2,400 m3/mo); + symbols, exceeding 1,500 BWPM (240 m3/mo).
Discussion
Discovery of Previously Unknown Triggered Earthquakes.
The most significant result of this investigation is that all of the better-located epicenters were situated within a few kilometers of one or more injection wells. This is important because it suggests that small triggered earthquakes, magnitude about 2 and smaller, occur more often than reported previously. Most of these wells associated with earthquakes were not suspected of triggering earthquakes prior to this study: The NEIC had reported no earthquakes near Denton, Hood, J-B, and Wise groups. And for the J-A and J-D groups, the NEIC locations had too-large uncertainties to identify individual wells; this study’s more accurate locations are essential for identifying the responsible wells. Only the DFW and J-Cleburne groups had been confidently associated with particular wells prior to this study (7, 8); in both areas this association had been confirmed only because temporary local seismograph networks had been installed.
It is possible that some of these earthquakes have a natural origin, but it is implausible that all are natural. The strongest candidate for a natural event is J-E in Fig. 2, a single earthquake that occurred on 0530 h UT on December 5, 2009, and was situated approximately 9 km from the nearest injection well. Although the NEIC reported this earthquake and assigned it magnitude 2.9, this study assigned the location a B-quality because the earthquake occurred early in the study period and at that time USArray stations to the east had not yet been installed. Nevertheless it seems unlikely the location is inaccurate by more than a few kilometers.
Characteristics of Earthquake-Triggering Wells.
A second significant result of this study is that maximum injection rates exceeded 150,000 BWPM (24,000 m3/mo) at the wells nearest all of the eight earthquake groups described above. Although this suggests that earthquakes are more likely to be triggered if injection reaches a critical rate, this critical rate may well depend on local subsurface conditions and thus vary in different geographic regions. In the Barnett Shale fluids are injected into the highly permeable Ellenburger formation; critical rates might be different under conditions where the permeability and other subsurface properties are different.
Moreover, it is unclear why earthquakes occur near some high-rate injection wells and not near other wells having apparently similar characteristics. Within the Barnett Shale there are more than 100 similar wells with injection rates exceeding 150,000 BWPM (24,000 m3/mo) that experienced no nearby identifiable earthquakes during the study period (Figs. 4 and 5).
A plausible explanation is that injection-triggering only occurs if fluids reach suitably oriented, nearby faults (7). Surveys of crustal stress and observations from deep boreholes at several locations worldwide indicate that: (i) stress in continental interiors is fairly uniform within regional provinces having dimensions of hundreds of kilometers (13); (ii) the brittle crust is in a state of failure equilibrium (14); with (iii) the stress levels being controlled by networks of pervasive naturally-occurring faults; (iv) where failure, enhanced by fluid flow, occurs according to Coulomb frictional failure theory along optimally oriented, critically stressed faults (15). Thus fluid injection may trigger earthquakes if pressures, rates, and permeability are sufficient to allow fluid to reach a favorably oriented fault and reduce the normal stress, decreasing fault strength.
There is evidence supporting this hypothesis for the DFW earthquakes (7). Here the relocated epicenters were situated along a northeast–southwest (NE–SW) trend, and both proprietary seismic data and regional tectonic maps (16) indicated a NE–SW trending subsurface fault within 1 km of the epicentral region (Fig. 2). Studies of regional stress (17, 18) find that the present-day regional stress system favors normal-faulting motion along NE–SW trending faults.
Some of the nonproprietary fault map data (16) is consistent with this hypothesis. It shows NE–SW trending faults in the area where earthquakes occur (Fig. 2). And where no earthquakes occur there is: (i) an absence of mapped faults in Stephens County where there are high-rate wells; (ii) an absence of high-rate wells in Comanche and Hamilton County, where there are NE-SW-trending faults; and (iii) an absence of both in Bosque County. However, there are no mapped faults near several of the earthquake groups in Fig. 2 (the Denton, Hood, J-A, J-C, and J-Cleburne groups).
Unfortunately, the quality of the available nonproprietary fault information is variable, and was collected well before the present development in the Barnett Shale. Thus near both seismically active and inactive wells, faults may exist that are absent in Figs. 1 and 2. What is desirable would be collaborative investigations with industry allowing a more thorough evaluation of the presence/absence of faulting near active and inactive injection wells.
Within the study area, the fraction of wells associated with earthquakes depends on the geographical region chosen. For wells having maximum injection rates exceeding 150,000 BWPM (24,000 m3/mo) in Johnson County, this fraction is 0.33 (9 of 27 high-rate wells; Table 2); within the seismically active area of Fig. 2, it is 0.23 (17 of 74); within the Barnett Shale neighborhood of Figs. 1 and 5, the fraction is 0.11 (17 of 161).
Utility and Limitations of USArray Data.
This study is an apt example of a positive but unanticipated benefit of the USArray Temporary Array, part of the NSF-funded EarthScope program. EarthScope was conceived and funded prior to most of the recent development of unconventional gas resources, and before the public realization that this development might trigger seismic activity. The present study’s success at identifying previously unreported seismicity in the Barnett Shale suggests that an analysis of USArray data could provide similar information about triggered earthquakes elsewhere, as in the Bakken, Eagle Ford, and Haynesville Shales.
However, for analyzing triggered seismicity the USArray data does have limitations, and it doesn’t replace the need for additional, focused monitoring efforts. The deployment of USArray stations is ephemeral, lasting only two years in any one location. While this interval provides a snapshot of seismic activity, its duration and timing isn’t optimal for investigating the before, during, and after phases of an injection program. Moreover, the 70-km station spacing makes it difficult to accurately assess the depths of triggered earthquakes. In the present study I fixed earthquakes depths at 5 km to stabilize the determination of epicenters; this depth is arbitrary although plausible, considering the differing appearance of earthquakes and quarry blasts.
Materials and Methods
Deep injection wells are categorized as Class I, which are used to dispose of hazardous, industrial, or municipal wastes, or Class II, which inject fluids associated with oil and gas production. In Texas Class I injection wells are regulated by the Texas Commission on Environmental Quality, who provides information about wells upon request. Information about Class II injection well locations, depth, permitting history, and monthly injection rates is archived by the Texas Railroad Commission (RRC). The RRC issues permits for individual wells and for leases having numerous wells; these include injection wells used for waste disposal as well as for waterflooding and secondary recovery. The RRC’s database is publically available online and includes monthly injection information for individual wells and leases, which is mostly complete for the past two decades. This study also utilized RRC data as compiled by the company IHS Inc.
All USArray-station seismograms analyzed for this investigation are archived at the IRIS Data Management Center and freely available. To identify seismic events, I identified candidate phase arrivals by comparing short-term and long-term averages at all seismic stations, inspecting arrivals for events identified at four or more network stations, then eliminating teleseisms and nonregional seismic events. For the remaining regional events, I picked P and S arrival times and/or identified events as quarry blasts. I then located events using a standard iterated least-square method using a flat-layered velocity model (7). Depths for quarry blasts were fixed at 300 m; earthquake depths were fixed at 5 km, the depth determined for DFW hypocenters using temporary local network data (7). All earthquake and quarry blast locations mapped in Figs. 1, 2, and 5 were determined using arrival picks from at least three nearby stations, including one or more stations with both P and S picks. I graded all locations as “A,” “B,” or “C,” with the A grade given to epicenters determined using numerous impulsive P and S arrivals and with an azimuthal gap of 120° or less. To estimate magnitudes for regional earthquakes, I fit the magnitudes MNEIC for events reported by the NEIC to the equation:
where AMax is maximum signal amplitude and D is event-to-station distance. I then used the coefficients a and b to calculate M for events not reported by the NEIC.
Greater detail concerning this investigation is provided in the SI Text file linked to the online version of this paper. This file provides a list of earthquake epicenters determined in this investigation, figures corresponding to Fig. 3 showing monthly injection volumes for all injection wells within 5 km of epicenters, and a discussion comparing epicenters determined in this study to those reported by the ANF.
Supplementary Material
ACKNOWLEDGMENTS.
This project benefitted from collaboration with scientists in the State of Texas Advanced Oil and Gas Resource Recovery (STARR) program at the University of Texas Bureau of Economic Geology. I especially thank Eric Potter for encouragement and valuable discussions and David Smith for helping me access Texas Railroad Commission data. This research was partially supported by the US Geological Survey (USGS), Department of the Interior, under USGS award number G12AP20001. The views and conclusions contained in this document are those of the author and should not be interpreted as representing the official policies, either expressed or implied, of the US government.
Footnotes
The author declares no conflict of interest.
This article is a PNAS Direct Submission.
This article contains supporting information online at www.pnas.org/lookup/suppl/doi:10.1073/pnas.1207728109/-/DCSupplemental.
References
- 1.Suckale J. Induced seismicity in hydrocarbon fields. Adv Geophys. 2009;51:55–106. [Google Scholar]
- 2.Nicholson C, Wesson RL. Earthquake hazard associated with deep well injection: A Report to the US Environmental Protection Agency. Washington, DC: US Geological Survey Bulletin 1951; 1990. [Google Scholar]
- 3.Majer EL, et al. Induced seismicity associated with enhanced geothermal systems. Geothermics. 2007;36:185–222. [Google Scholar]
- 4.Davis SD, Pennington WD. Induced seismic deformation in the Cogdell oil field of West Texas. Bull Seismol Soc Am. 1989;79:1477–1495. [Google Scholar]
- 5.Holland A. Examination of Possibly Induced Seismicity from Hydraulic Fracturing in the Eola Field, Garvin County, Oklahoma. Oklahoma: Oklahoma Geological Survey; 2011. p. 28. Open File Rept. OF1-2011. [Google Scholar]
- 6.Kanamori H, Hauksson E. A slow earthquake in the Santa Maria Basin, California. Bull Seismol Soc Am. 1992;82:2087–2096. [Google Scholar]
- 7.Frohlich C, Hayward C, Stump B, Potter E. The Dallas–Fort Worth earthquake sequence: October 2008 through May 2009. Bull Seismol Soc Am. 2011;101:327–340. [Google Scholar]
- 8.Howe AM, Hayward CT, Stump BW, Frohlich C. Analysis of recent earthquakes in Cleburne, Texas. Seismol Res Lett. 2010;81:379. [Google Scholar]
- 9.Howe AM. Dallas: Southern Methodist University; 2012. Analysis of Cleburne earthquakes from June 2009 to June 2010. MS thesis. [Google Scholar]
- 10.Horton S. Disposal of hydrofracking waste fluid by injection into subsurface aquifers triggers earthquake swarm in central Arkansas with potential for damaging earthquake. Seismol Res Lett. 2012;83:250–260. [Google Scholar]
- 11.Ellsworth WL, et al. Are seismicity rate changes in the midcontinent natural or manmade? Seismol Res Lett. 2012;83:403. [Google Scholar]
- 12.National Research Council. Induced Seismicity Potential in Energy Technologies. Washington, DC: National Academies Press; 2012. [Google Scholar]
- 13.Zoback ML, Zoback MD. State of stress in the conterminus United States. J Geophys Res. 1980;85:6113–6156. [Google Scholar]
- 14.Zoback MD, Townend J. Implications of hydrostatic pore pressure and high crustal strength for the deformation of intraplate lithosphere. Tectonophysics. 2001;336:19–30. [Google Scholar]
- 15.Barton CA, Zoback MD, Moos D. Fluid flow along potentially active faults in crystalline rock. Geology. 1995;23:683–686. [Google Scholar]
- 16.Ewing T. Tectonic Map of Texas. Austin, TX: University of Texas Bureau of Economic Geology; 1990. [Google Scholar]
- 17.Sullivan EC, Marfurt KJ, Lacazette A, Ammerman M. Application of new seismic attributes to collapse chimneys in the Fort Worth Basin. Geophysics. 2006;71:B111–B119. [Google Scholar]
- 18.Tingay MRP, Muller B, Reinecker J, Heidbach O. State and origin of the present-day stress field in sedimentary basins: New results from the World Stress Map Project; Proceedings of the 41st US Symposium on Rock Mechanics: 50 Years of Rock Mechanics: Landmarks and Future Challenges; Colorado: Golden; 2006. p. 14. CD-ROM ARMA/USRMS06-1049. [Google Scholar]
Associated Data
This section collects any data citations, data availability statements, or supplementary materials included in this article.


