Abstract
The functional relevance of brain-derived neurotrophic factor (BDNF) is beginning to be well appreciated not only in mice, but also in humans. Because reduced levels typically correlate with impaired neuronal function, increasing BDNF levels with well-tolerated drugs diffusing into the central nervous system may help in ameliorating functional deficits. With this objective in mind, we used the sphingosine-1 phosphate receptor agonist fingolimod, a drug that crosses the blood–brain barrier. In addition, fingolimod has recently been introduced as the first oral treatment for multiple sclerosis. In cultured neurons, fingolimod increases BDNF levels and counteracts NMDA-induced neuronal death in a BDNF-dependent manner. Ongoing synaptic activity and MAPK signaling is required for fingolimod-induced BDNF increase, a pathway that can also be activated in vivo by systemic fingolimod administration. Mice lacking Mecp2, a gene frequently mutated in Rett syndrome, show decreased levels of BDNF, and fingolimod administration was found to partially rescue these levels as well as the size of the striatum, a volumetric sensor of BDNF signaling in rodents. These changes correlate with increased locomotor activity of the Mecp2-deficient animals, suggesting that fingolimod may improve the functional output of the nervous system, in addition to its well-documented effects on lymphocyte egress from lymph nodes.
Keywords: electrophysiology, transcription
Brain-derived neurotrophic factor (BDNF) is a secreted growth factor present in all major areas of the adult central nervous system (CNS), the tissue used for its purification (1). Conditional deletions of the corresponding gene have revealed that it is required for many aspects of postnatal brain function (2), and a potentially useful role for BDNF administration has been discussed in a wide range of CNS pathologies (3). Although much of the evidence linking BDNF with CNS dysfunction has been obtained with rodent models, some is based on human genetics (4, 5). BDNF is increasingly viewed as an endogenous “neuroprotectant,” and attempts have already been made to increase its levels both by protein application and virus-mediated delivery—for example, in animal models of Alzheimer’s disease (6). Another promising approach involves the administration of tropomyosin receptor kinase B (TrkB) agonists (7), the receptor mediating the trophic effects of BDNF.
In the absence of lesion, the Bdnf gene is primarily expressed in neurons, and its transcription is activated by excitatory input in a cAMP- and calcium-response element-binding protein (CREB)-dependent fashion (8, 9). These and related observations have led to the suggestion that activating neurotransmission by administering AMPA receptor agonists such as Ampakine may help in correcting CNS dysfunction by increasing BDNF levels—for example, in animal models of Huntington disease and Rett syndrome (10, 11). Rett syndrome is a neurodevelopmental disease usually caused by a mutation in the DNA binding protein MeCP2 (12), and the administration of both Ampakine and of TrkB agonists improves symptoms in mice lacking MeCP2 (7, 11). These experiments were prompted by the observation that, in these mutants, BDNF levels fail to robustly increase in the first weeks after birth (13), as is normally the case in wild-type animals (14). In addition, manipulations of BDNF levels achieved by breeding MeCP2-null mice with lines either lacking one BDNF allele or, conversely, overexpressing BDNF in the forebrain led to the conclusion that BDNF levels influence the course of the disease (13). Given this background, mice lacking MeCP2 represent an attractive model to test substances that may increase the levels of BDNF and improve some of their symptoms, such as reduced and impaired motor behavior (13). In addition, similarities have been noted between mice lacking MeCP2 and BDNF in neurons, such as a hind-limb clasping phenotype, obesity in females, and an anxiety type of behavior (15).
Here we examine the ability of the sphingosine-1 phosphate analog fingolimod, also designated FTY720, to increase BDNF levels. Sphingosine is a natural breakdown product of ceramide that, after its phosphorylation typically in the liver, binds to S1P receptors expressed by a large variety of cell types (16). The work leading to the approval of fingolimod for the treatment of relapsing forms of multiple sclerosis concentrated on cells of the immune system, with a key feature being its ability to decrease the egress of lymphocytes from lymph nodes and their release into the circulation (16). Given the fact that fingolimod crosses the blood–brain barrier (17), it is surprising that comparatively little has been done so far with regard to its possible role in brain cells, including neurons. Previous reports indicating that fingolimod activates the MAPK pathway in cultured astrocytes and oligodendrocytes (18) and that its in vivo administration reduces infarct size after blood vessel occlusion (19) prompted us to explore whether it increases BDNF levels and may help to ameliorate some of the symptoms of mice lacking MeCP2.
Results
Fingolimod Activates the MAPK Pathway in Cultured Neurons.
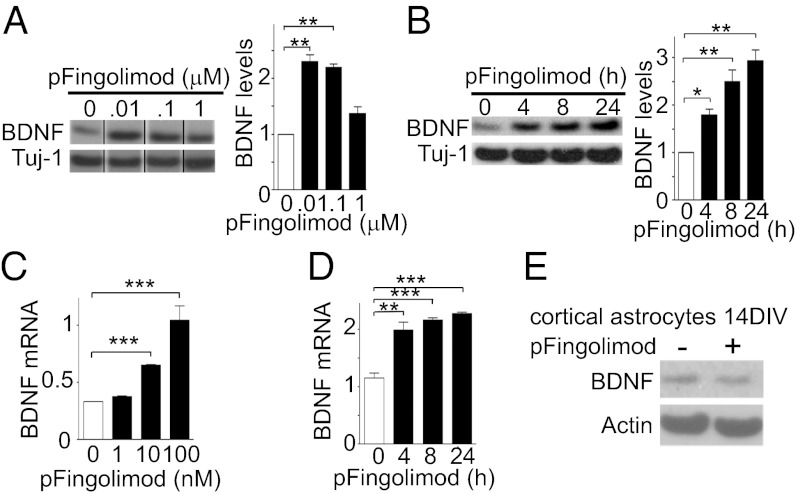
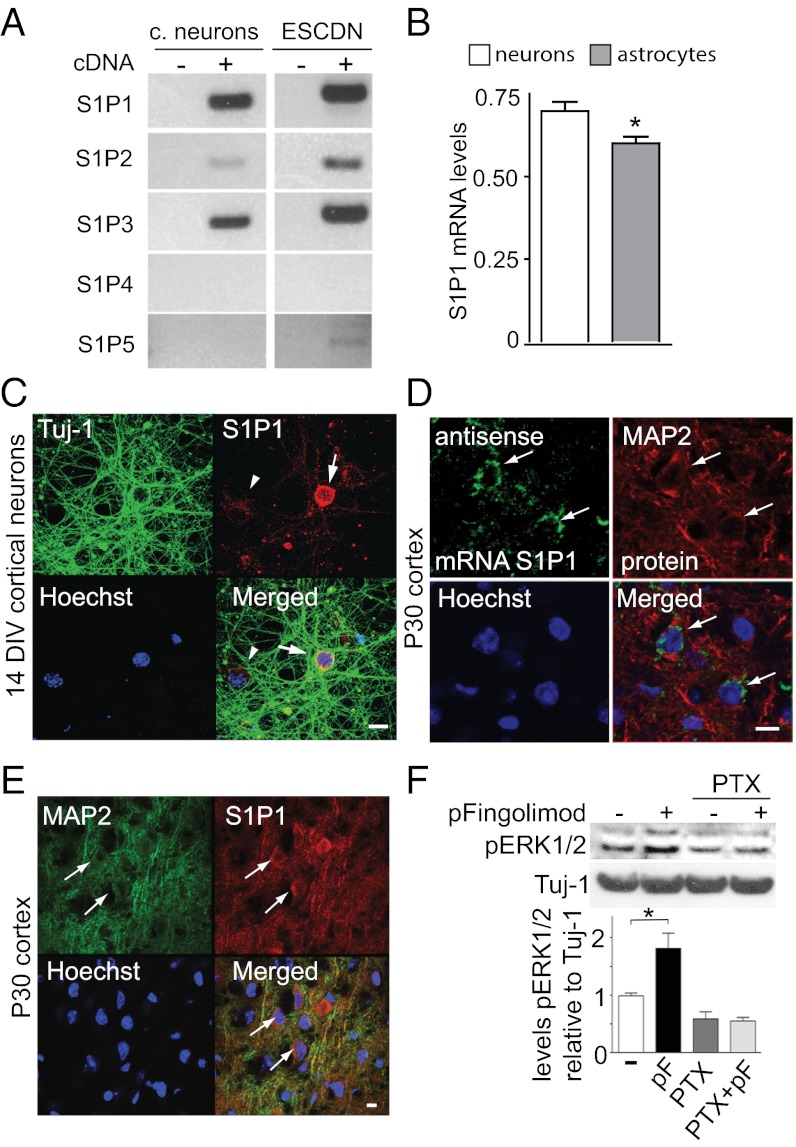
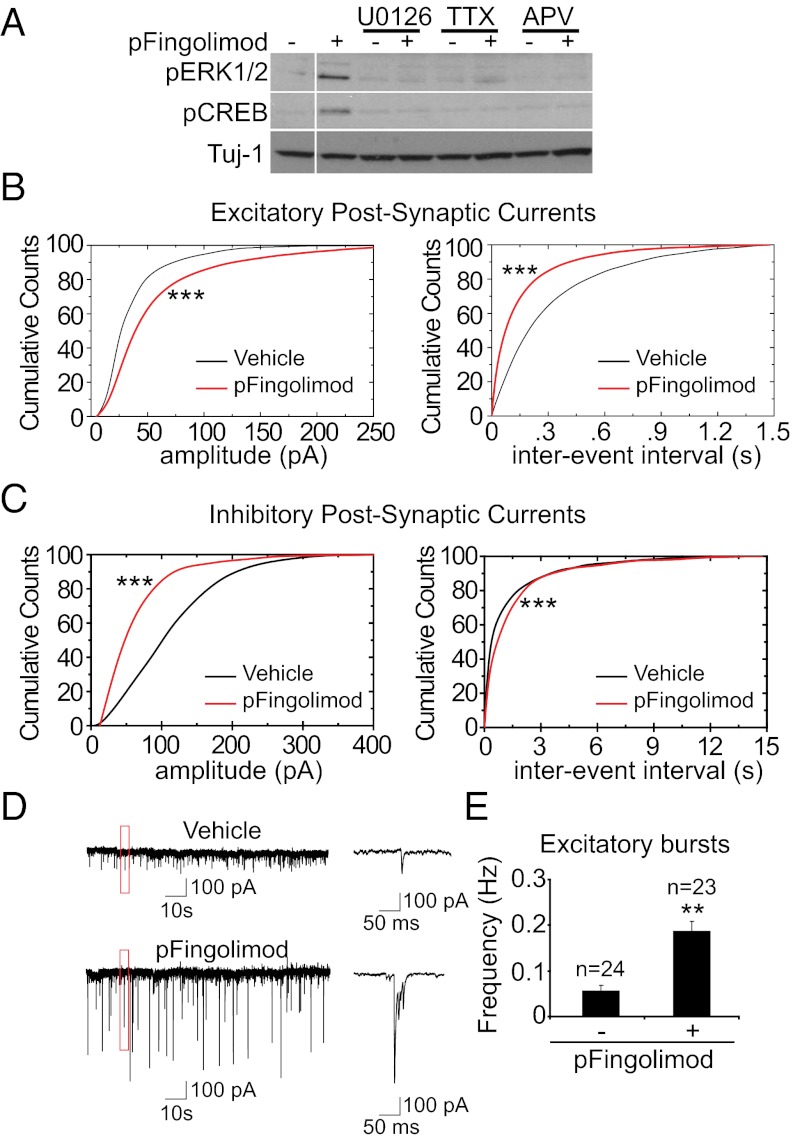
The addition of phosphorylated fingolimod (phospho-fingolimod) to cultured cortical neurons increases BDNF mRNA and protein levels in a dose- and time-dependent manner (Fig. 1 A–D). No increase was observed with cultured astrocytes (Fig. 1E). Fingolimod has been reported to preferentially bind to the sphingosine-1 phosphate receptors S1P1 and S1P5—and to a lesser extend to S1P3 (16)—but whether these receptors are expressed by neurons is still unclear (20, 21). We detected mRNA transcripts for the receptors S1P1, 2, and 3 in cultured neurons (Fig. 2A) with somewhat lower S1P1 receptor levels in astrocytes (Fig. 2B). S1P5 transcripts were also detected in essentially pure neuronal cultures derived from embryonic stem (ES) cells (Fig. 2A). Moreover, S1P1 transcripts were detected by in situ hybridization in the cerebral cortex of postnatal day (P) 30 mice (Fig. 2D), whereas S1P1 receptors were detected by immunocytochemistry in cultured neurons (Fig. 2C), as well as in the P30 cortex (Fig. 2E), where the specificity of the signal was validated by in utero electroporation using miRNAs targeting the S1P1 receptor (Fig. S1 A–C). Colabeling experiments revealed that S1P1 expression is not restricted to a specific subtype of glutamatergic or GABAergic neurons (Fig. S1D). A 30-min treatment with 10 nM phospho-fingolimod led to an increase in extracellular signal-regulated kinase 1/2 (ERK1/2) phosphorylation in cortical cultured neurons (Fig. 2F and Fig. S2A), as was reported in HEK293 cells and cultured astrocytes (22, 23). Similar results were obtained with the S1P1-specific agonists pKRP203 (100 nM) and SEW2871 (100 nM) (Fig. S2B). Unlike the S1P3 receptor, the S1P1 receptor is a Gi protein-coupled receptor, and the addition of pertussis toxin (10 μM) (24) abolished phospho-fingolimod–induced ERK1/2 phosphorylation (Fig. 2F). In addition, phospho-fingolimod led to the phosphorylation of the prosurvival kinase AKT/PKB, which was reported to act downstream of the S1P1, but not of S1P3, receptor (23). After ERK1/2 activation, phospho-fingolimod led to phosphorylation of the transcription factor CREB, which could be prevented by using the MAPK inhibitor U0126 (Fig. 3A and Fig. S2C). With regard to receptor specificity, we also found that S1P1 modulation by the specific agonists SEW2871 and pKRP203 led to BDNF increase (Fig. S2E), whereas the presence of the S1P1 antagonist W123, but not of the S1P3 receptor antagonist CAY10444, abolished this increase (Fig. S2F).
Fig. 1.
Phospho-fingolimod increases BDNF levels of cultured neurons. (A) At 24 h, fingolimod at a concentration of 10 or 100 nM, but not at 1 μM, increased BDNF protein levels. (B) The increase (10 nM) is time-dependent. (A and B) Western blots and their quantification (bar graphs). (C and D) mRNA levels were determined by quantitative real-time PCR (qPCR) assays using the same dose range and time points as for protein determinations (mean ± SEM; n = 3; Student t test). *P < 0.05; **P < 0.01; ***P < 0.001. (E) BDNF levels were not increased in astrocytes culture for 14 d (14 DIV) following a 24-h exposure with 10 nM phospho-fingolimod (Western blot).
Fig. 2.
Expression of S1P1 receptors and ERK1/2 activation following phospho-fingolimod addition. (A) mRNA expression levels (RT-PCR) of S1P receptors 1–5 in primary cultures of neurons from the cortex and in neurons derived from ES cells (ESCDN) at 14 DIV. (B) S1P1 mRNA levels relative to GAPDH mRNA levels in cultured cortical neurons as well as in astrocytes at DIV14. *P < 0.05 (qPCR; mean ± SEM, n = 3; Student’s t test). (C) S1P1 expression in cultured cortical neurons using antibodies against the C-terminal fragment of the S1P1 receptor (red) and Tuj1 antibodies (green). (D) In situ hybridization using an antisense riboprobe detecting S1P1 (green) in MAP2-positive neurons (red). (E) S1P1 immunoreactivity colocalizes with the neuronal marker MAP2 in the cortex of P30 mice. (F) Pertussis toxin (PTX) exposure of cultured cortical neurons prevents the ERK1/2 phosphorylation increase observed following a 30-min stimulation with 10 nM phospho-fingolimod (pF). *P < 0.05 (mean ± SEM; n = 3; Student t test). (Scale bar: 10 μm.)
Fig. 3.
Phospho-fingolimod increases CREB phosphorylation and neuronal activity. (A) The inhibitors U0126 (10 μM), TTX (10 μM), and APV (100 μM) abolish the phospho-fingolimod–dependent ERK1/2 and CREB phosphorylation observed in cortical cultures. (B) In electrophysiological recordings of spontaneous activity, phospho-fingolimod treatment increases the amplitude of EPSCs and reduces the interevent interval. ***P < 0.001 (Kolmogorov–Smirnov test; cells recorded: vehicle, n = 24; phospho-fingolimod, n = 23). (C) The IPSC amplitude is decreased after phospho-fingolimod treatment, whereas the interevent interval is increased. ***P < 0.001 (Kolmogorov–Smirnov test). (D) Sample traces from these recordings, showing the presence of excitatory bursts. (E) Excitatory bursts frequency increases after treatment with phospho-fingolimod. **P < 0.01 (Student t test).
Phospho-Fingolimod Increases the Network Activity of Cultured Neurons.
To evaluate the possibility that the fingolimod activation of the MAPK/CREB pathway may be a result of increased synaptic activity, we tested the effect of the voltage-gated sodium channel inhibitor TTX (10 μM) and the NMDA receptor antagonist 2-amino-5-phosphonovaleric acid (APV) (200 μM). Both were found to reduce fingolimod-induced ERK1/2 and CREB phosphorylation (Fig. 3A), suggesting that ongoing neuronal activity is required for the drug to deploy its effects. To directly test the possibility that fingolimod affects the electrophysiological properties of cortical neurons, we determined spontaneous activity using whole-cell patch-clamp recordings on cortical cultures [14–16 days in vitro (DIV)]. Both frequency and amplitude of excitatory postsynaptic currents (EPSCs) were increased upon phospho-fingolimod treatment (Fig. 3B), whereas the amplitude and frequency of inhibitory postsynaptic currents (IPSCs) were reduced (Fig. 3C). In addition, treatment with phospho-fingolimod altered the pattern of activity, leading to bursts of EPSCs (Fig. 3 D and E). The observed increase in the average amplitude of the miniature EPSCs upon phospho-fingolimod addition (Fig. S3A) suggests that it acts at least in part postsynaptically. By contrast, fingolimod treatment did not affect the paired-pulse ratio in field recordings on acute hippocampal slices (Fig. S3B), arguing against a presynaptic enhancement of neurotransmitter release. The effect of fingolimod began to be observable 30 min after bath application of the drug (Fig. S3 C and D). To test whether the release of BDNF is involved, we measured spontaneous activity levels in the presence of a monoclonal BDNF-blocking antibody mAb#9 (14). Neither the effect of phospho-fingolimod on the frequencies of IPSCs, EPSCs, and bursts nor its effect on the amplitude of the IPSCs was affected by the presence of mAb#9 (Fig. S3 E–G). However, the increase in the amplitude of the EPSCs was reversed by blocking BDNF—indicating that this effect is secondary to the increased release of BDNF after phospho-fingolimod addition (Fig. S3F).
Phospho-Fingolimod Protects Neurons from NMDA-Induced Death.
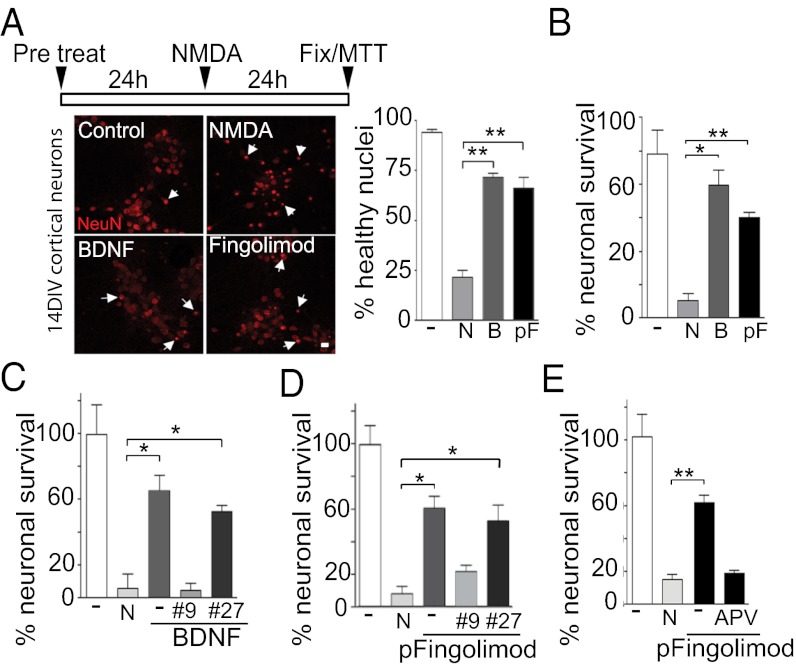
Because BDNF is known to prevent NMDA-induced excitotoxicity (25) (Fig. 4A), cortical cultures were exposed to phospho-fingolimod 24 h before stimulation with a high concentration of NMDA. This treatment resulted in an increase in BDNF secretion (Fig. S4A) and in the phosphorylation of its receptor TrkB (Fig. 4B), resulting in a significant increase in neuronal survival (Fig. 4 A and B). This rescue was decreased by the addition of the BDNF antibody mAb#9, but not by the NGF antibody mAb#27/21 (14) (Fig. 4 C and D). In line with the notion that neuronal activity is required for the action of phospho-fingolimod, the concomitant addition of APV during pretreatment abolished the neuroprotective effect of the drug (Fig. 4E).
Fig. 4.
Phospho-fingolimod prevents excitotoxic neuronal death in a BDNF-dependent fashion. (A) Quantification of pycnotic neuronal nuclei stained using anti-NeuN antibodies. (Scale bar: 10 μm.) (B) Both BDNF (40 ng/mL) as well phospho-fingolimod (pF; 10 nM) pretreated cultures show higher numbers of healthy nuclei compared with non-pretreated cultures after 24 h of high NMDA (N) used at 20 μM (n = 160 from two different experiments, mean ± SEM, Student t test). (C–E) Using 3-(4,5-dimethylthiazol-2-yl)-2,5-diphenyltetrazolium bromide (MTT) assays on neuronal cultures (DIV14), we found that 24 h of pretreatment with BDNF (40 ng/mL) or phospho-fingolimod (10 nM) protect against toxic concentrations of NMDA (20 μM). This effect is abolished by the presence of the BDNF blocking antibody mAb#9 (#9; 12 μg/mL) or the NMDA receptor antagonist APV (200 μM), but not by the NGF blocking antibody mAb#27/21 (#27; 12 μg/mL). *P < 0.05; **P < 0.01; ***P < 0.001 (n = 3; mean ± SEM; Student t test) (C and D).
Fingolimod Injections Activate the MAPK Pathway and Increase BDNF Levels in Vivo.
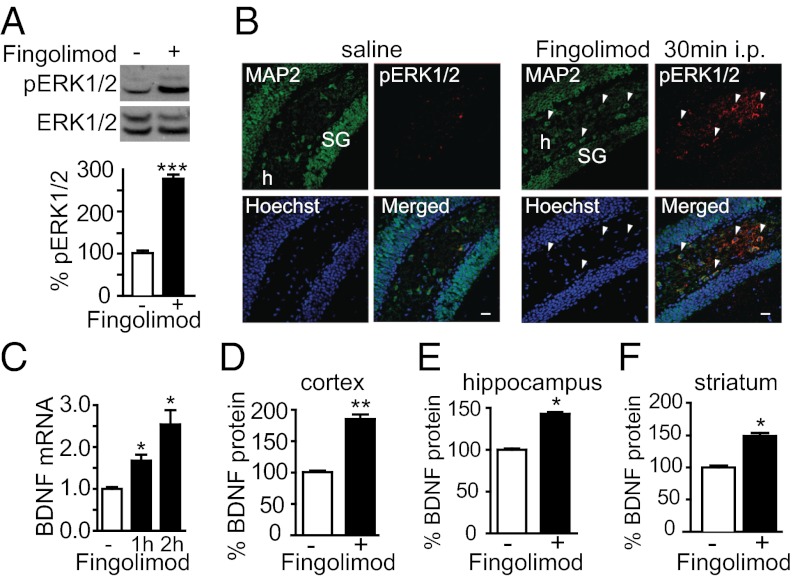
Because fingolimod is known to cross the blood–brain barrier, we next explored the possibility that fingolimod increases BDNF levels in vivo. As early as 30 min after i.p. injection of fingolimod (0.1 mg per kg of body weight), the levels of phosphorylated ERK1/2 (pERK1/2) were significantly increased in hippocampal neurons (Fig. 5 A and B). After an additional 30 min (Fig. 5C), BDNF mRNA levels were elevated, and protein levels were significantly increased in the hippocampus, the cortex, and the striatum after 48 h (Fig. 5 D–F).
Fig. 5.
Fingolimod injection increases ERK1/2 phosphorylation and BDNF levels in cortical neurons. (A) Fingolimod injections (0.1 mg/kg; i.p.) in P30 animals increase phospho-ERK1/2 levels after 30 min as revealed by Western blot analyses of the hippocampus. (B) Fingolimod injections (0.1 mg/kg; i.p.) in P30 animals increase pERK1/2 in neurons 30 min after injection as revealed by immunohistochemistry of the hippocampus. SG, Stratum Granulosum; h, hilus. (C) BDNF mRNA levels are increased in the hippocampus 30 min after fingolimod injection as determined by qPCR. (D–F) BDNF protein levels determined by ELISA in cortex, hippocampus and striatum 48 h after fingolimod injections (0.1 mg/kg; i.p). *P < 0.05; **P < 0.01; ***P < 0.001 (n = 3; mean ± SEM; Student t test). (Scale bar: 20 μm.)
Fingolimod also Increases BDNF Levels in Mice Lacking Mecp2 and Improves Their Symptoms.
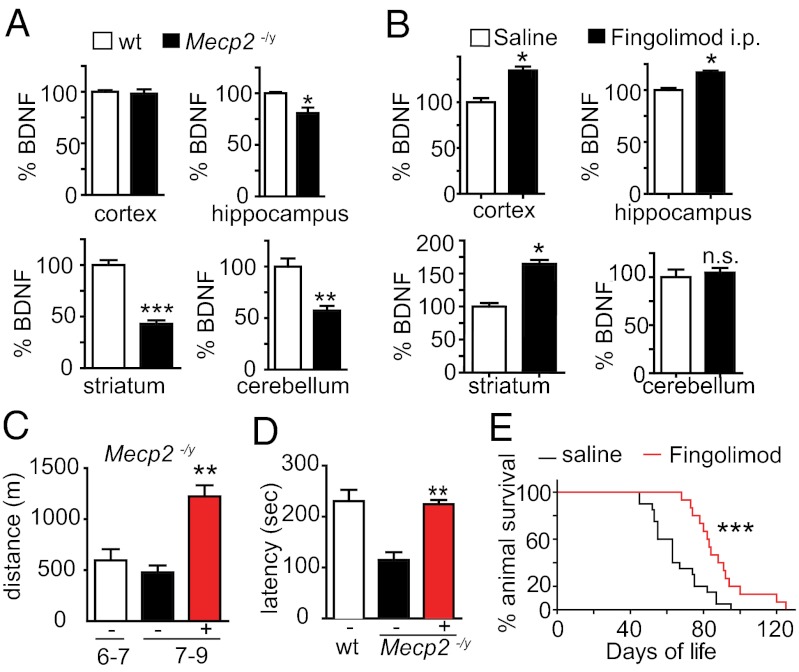
To test the possibility that fingolimod injections may contribute to restore CNS function, we injected fingolimod in male mice lacking MeCP2 (26). In line with previous reports (13), we confirmed a significant reduction of BDNF levels in several brain areas of adult Mecp2−/y mice (Fig. 6A). To test whether fingolimod could also increase BDNF levels in neurons lacking MeCP2, we used neurons derived from mutant ES cells. After 2 wk of culture, these Mecp2-null neurons expressed significantly lower levels of BDNF mRNA compared with wild-type neurons. The addition of fingolimod rescued BDNF mRNA and protein to levels comparable with those seen in wild-type neurons. Mutant mice treated for 4 wk with i.p. injections of fingolimod (0.1 mg/kg every 4 d) also showed increased BDNF levels in the cortex, hippocampus, and striatum, but not in the cerebellum (Fig. 6B). In addition, the wet weight of the striatum of the treated Mecp2−/y mice was higher compared with controls receiving saline (saline, 13.6 ± 0.7 mg vs. fingolimod, 18.0 ± 0.6 mg; ***P < 0.0001; n = 14; Mann–Whitney test). Furthermore, we noticed that treatment of Mecp2−/y animals with fingolimod improved motor deficits, including a very marked reduction in the hind-limb clasping phenotype, a typical feature of animals lacking either MeCP2 or BDNF (15) (saline, 100% with clasping vs. fingolimod, 30%; n = 20 and n = 14 for saline and fingolimod, respectively). Moreover, after a 2-wk treatment, the performance of mutant animals injected with fingolimod was significantly improved, both in the running-wheel and the rotarod tests (Fig. 6 C and D). Finally, injections with fingolimod extended the average lifespan of Mecp2−/y mice (Fig. 6E).
Fig. 6.
Fingolimod increases BDNF levels in Mecp2−/y mice and improves their symptoms. (A) BDNF levels determined by ELISA are reduced in various brain areas of P30 Mecp2−/y mice compared with wild-type animals. (B) Fingolimod treatment (0.1 mg/kg; i.p.) for 4 wk increases BDNF levels in the cortex, hippocampus, and striatum, but not in the cerebellum of Mecp2−/y mice. *P < 0.05 (ELISA determination; mean ± SEM; n = 3; two-way ANOVA; Bonferroni post hoc test). (C) Fingolimod injections significantly increase the locomotor activity of Mecp2−/y mice as determined by the running wheel assay. (D) The same treatment also increased the motor coordination as determined by rotarod test. **P < 0.01 (Student’s t test). (E) Fingolimod treatment of Mecp2−/y mice with fingolimod from P42 onwards significantly prolongs the life of the animals, compared with vehicle-treated animals. ***P < 0.001 (saline, 63 d on average; n = 22; fingolimod, 88 d; n = 17; log-rank test).
Discussion
Our results indicate that fingolimod increases BDNF levels in neurons in an activity-dependent fashion through the MAPK pathway (27). Both in vitro and in vivo, neurons express S1P receptors—including the S1P1 receptor, the primary target of fingolimod. Recently, the cellular sites of receptor expression were examined by in situ hybridization using CNS sections of adult mice engineered to expressed floxed S1P1 receptor and crossed with transgenic deleter lines expressing Cre either under a nestin or a human glial fibrillary acidic protein (GFAP) or a synapsin promoter (20). Although the results established that astrocytes, as well as occasional endothelial cells, are major sites of S1P1 receptor expression, the Cre-deleter lines used do not exclude the possibility that CNS neurons also express this receptor: The human GFAP promoter is expressed by most radial glial cells early in CNS development, with the progeny of these cells consisting of both astrocytes and large populations of CNS neurons (28). Likewise, the synapsin–Cre line fails to target floxed constructs in significant numbers of Purkinje cells (29). Upon phospho-fingolimod treatment, we found that cultured neurons exhibit an increase in postsynaptic responsiveness and in excitatory activity, as well as a clustering of excitatory events. The occurrence of burst firing typically depends on the developmental stage (30), and the number of intrinsically active neurons in the culture (31). However, the way in which burst firing is initiated is not well understood, and increased afferent excitation and an altered excitatory/inhibitory balance have been proposed as possible causes (32, 33). Both possibilities are compatible with the effect of phospho-fingolimod on spontaneous activity in cultured neurons (34). In line with the notion that addition of phospho-fingolimod efficiently stimulates neurons, we found robust increases in ERK and CREB phosphorylation and in BDNF mRNA and protein levels. These effects all depend on ongoing neuronal activity. Functionally relevant synaptic activity takes more than a week to develop in cultures of embryonic neurons, which explains why previous reports did not detect fingolimod-induced ERK1/2 phosphorylation in immature neurons (22). Although increased ERK1/2 phosphorylation has been described in astrocytes after phospho-fingolimod addition (22)—and our experiments confirm S1P1 receptor expression in cultured astrocytes—phospho-fingolimod did not increase the levels of BDNF in these cells, indicating that the increase in BDNF is neuron-specific. Nevertheless, we cannot exclude the possibility that in vivo, astrocytes may also be involved in the regulation of BDNF expression by neurons after stimulation of S1P1 receptors.
Our in vitro results indicate a neuroprotective effect of fingolimod as it reduces the NMDA-induced cytotoxicity in a BDNF-dependent manner, in line with recent observations indicating that fingolimod administration significantly reduces the infarct volume caused by ischemia (19). As BDNF levels are decreased in the brains of mice lacking MeCP2 and correlate with symptom progression (13), this mouse model of Rett syndrome represents an attractive model to test the in vivo effects of fingolimod because our results also show that MeCP2 is not required for fingolimod to increase BDNF (Fig. S5). This mouse model is all the more relevant because parallels have previously been noted between the phenotypes of Bdnf conditional mutations and mice lacking Mecp2, including decreased motor activity, obesity in female animals, and hind-limb clasping (13, 15). At the morphological level, the lack of BDNF severely impacts the development of GABAergic neurons in the striatum (15, 35), which may in part explain the clasping phenotype. The striatum consists mainly of GABAergic neurons that seem to be particularly dependent on BDNF, not for their survival in the postnatal weeks but for their growth and arborization (15, 35). As is the case with Bdnf conditional mutations (15), the striatum of Mecp2−/y animals is ∼30% smaller than wild-type controls at ∼1 mo of age (36).
Recently, it was shown that deletion of Mecp2 in GABAergic neurons mimics several aspects of the disease in mice, revealing an important contribution of these neurons to the etiology of Rett syndrome (37). We found that fingolimod administration not only increases the BDNF content of the striatum, but also its wet weight. Because the levels of BDNF mRNA are very low in the striatum (35), it seems likely that the reduced BDNF levels observed in the Mecp2 mutant result from decreased anterograde transport of BDNF in striatal afferents. The fingolimod-induced increase of striatal BDNF levels presumably helps in restoring the function of striatal neurons affected by the lack of MeCP2, thus contributing to improving the symptoms of Mecp2-deficient mice. In vitro work has demonstrated that striatal neurons show a marked growth response to the addition of BDNF (15, 38), in line with the notion that the decreased weight of the striatum observed in mice lacking Mecp2 may in part result from decreased levels of BDNF delivered by anterograde transport from other brain areas. Our results indicate that fingolimod increases BDNF levels in several brain areas, but not in the cerebellum. Although Purkinje cells express the S1P1 receptor, these neurons, like many GABAergic neurons, do not express the Bdnf gene at significant levels (39). By contrast, most granule cells do express the Bdnf gene, but we could not detect significant levels of S1P1 receptor expression in these cells.
Our results raise the possibility that, in addition to its effects on T lymphocyte egress from lymph nodes, fingolimod may contribute to accelerate neuronal repair and improve CNS function in diseases that have been linked with a decrease of BDNF levels. Given the expression of a large variety of 7-transmembrane receptors in the CNS, it may be interesting in the future to target selected receptors of this class with the goal of increasing BDNF levels and its delivery onto postsynaptic neurons (40) likely to benefit from increased TrkB signaling.
Materials and Methods
Neuronal and Astrocytic Cultures.
Embryonic day (E) 16.5 cortical neurons (3 × 10⁵ cells per cm2) were grown in Neurobasal medium containing 2% (vol/vol) B27, 0.2 mM glutamine, and 10 mM Hepes. ES cell-derived neurons were cultured as described (41). P1–P2 cortical astrocytes were grown in DMEM with 20% FCS and 2 mM glutamine.
Western Blot Assays.
Total protein extracts were analyzed in Bis⋅Tris Novex gels by using the following antibodies: BDNF (N-20; Santa Cruz), Mecp2 (Upstate), β-III-Tubulin (Covance), phospho-CREB, and phospho-p44/42 (Chemicon).
Immunoprecipitation.
BDNF was precipitated with mAb#9 and detected with the N-20 antibody (Santa Cruz). TrkB was precipitated with pan-Trk antibodies (Santa Cruz) and detected either with phospho-tyrosine or TrkB antibodies (Santa Cruz).
Immunohistochemistry.
Cryosectioned brain slices (30 μm) were analyzed by using the following antibodies: EDG1 (Abcam), MAP2 (Calbiochem), and phospho-p44/42 (Cellsignal).
Immunocytochemistry.
Fixed cells were analyzed by using antibodies against phospho-CREB and phospho-p44/42 (Cellsignal), β-III-Tubulin (Covance), MAP2 (Calbiochem), EDG1 (Abcam), and GAD67 (Calbiochem).
In Utero Electroporation.
In utero electroporation was performed in E14.5 embryos as described (42). Electroporation was carried out by applying five pulses of 40 V per 50 ms during 950 ms. Pups expressing eGFP in the cortex were selected at P1, and brains were fixed in 4% paraformaldehyde–PBS at 4 °C overnight. Immunohistochemistry was performing as described before.
Quantitative Real-Time PCR (qPCR).
Specific oligonucleotides and TaqMan probes for BDNF and GAPDH were used. Relative BDNF levels compared with GAPDH levels were determined by the Ct method.
Assessment of Neuronal Death.
We performed 3-(4,5-dimethylthiazol-2-yl)-2,5-diphenyltetrazolium bromide (MTT) assays as described (43). Pycnotic-condensed neuronal nuclei were stained by using NeuN antibodies (Chemicon).
In Situ Hybridization.
In situ hybridization was performed as described (44). Ap-conjugated anti-digoxigenin (anti-DIG) Fab fragments (Roche) were used to visualized the DIG signal by using a mixture of nitroblue tetrazolium/5-bromo-4-chloro-3-indolyl phosphate solution (Roche) and 5% PVA. Later, slices were processed for immunohistochemistry by using MAP2 (Cellsignal) antibodies and Hoechst.
BDNF ELISA.
BDNF sandwich ELISA was performed as described (14, 45), except that bovine serum albumin was omitted from the extraction buffer.
Animals.
All of the experiments using animals were conducted with permission from the Basel Cantonal Veterinary Office. MeCP2 mutant mice (26) were maintained by mating heterozygote females (MeCP2+/−) with wild-type C57BL/6J mice.
Running Wheel Assay.
Three days before starting the experiment, mice (n = 4) were placed in the cages containing the running wheel to get used to the environment. Data on the running distances were automatically calculated and saved, and the Student t test was used for the statistical analysis.
Rotarod Assay.
Motor performance was assessed with 30-d-old mice (n = 4 for each type) trained for 1 wk by using a rotarod apparatus. The mice were subsequently tested at 20 rpm with the time of stay on the rotarod measured 48 h after fingolimod injection.
Electrophysiology.
The external solution for patch clamp contained 69 mM NaCl, 26 mM NaHCO3, 1.25 mM NaH2PO4, 2.5 mM KCl, 1 mM MgSO4, 11 mM glucose, and 2.5 mM CaCl2 (pH 7.3) plus solvent or fingolimod in a concentration of 10 nM. Internal solution contained 5 mM NaCl, 105 mM K gluconate, 1 mM EGTA, 10 mM Hepes, 5 mM Mg⋅ATP, and 0.5 mM GTP Tris salt (pH 7.3). For the minirecordings, the external solution contained 300 nM TTX, and the internal solution contained 5 mM NaCl, 105 mM CsCl, 1 mM EGTA, 10 mM Hepes, 5 mM Mg⋅ATP, and 0.5 mM GTP Tris⋅salt (pH 7.3).
Supplementary Material
Acknowledgments
This work was supported by Rett Syndrome Research Trust and International Rett Syndrome Foundation Research Grant 2809 and by Swiss National Foundation Grant 31003A_124902.
Footnotes
The authors declare no conflict of interest.
*This Direct Submission article had a prearranged editor.
This article contains supporting information online at www.pnas.org/lookup/suppl/doi:10.1073/pnas.1206093109/-/DCSupplemental.
References
- 1.Barde YA, Edgar D, Thoenen H. Purification of a new neurotrophic factor from mammalian brain. EMBO J. 1982;1:549–553. doi: 10.1002/j.1460-2075.1982.tb01207.x. [DOI] [PMC free article] [PubMed] [Google Scholar]
- 2.Autry AE, Monteggia LM. Brain-derived neurotrophic factor and neuropsychiatric disorders. Pharmacol Rev. 2012;64:238–258. doi: 10.1124/pr.111.005108. [DOI] [PMC free article] [PubMed] [Google Scholar]
- 3.Nagahara AH, Tuszynski MH. Potential therapeutic uses of BDNF in neurological and psychiatric disorders. Nat Rev Drug Discov. 2011;10:209–219. doi: 10.1038/nrd3366. [DOI] [PubMed] [Google Scholar]
- 4.Egan MF, et al. The BDNF val66met polymorphism affects activity-dependent secretion of BDNF and human memory and hippocampal function. Cell. 2003;112:257–269. doi: 10.1016/s0092-8674(03)00035-7. [DOI] [PubMed] [Google Scholar]
- 5.Gray J, et al. Hyperphagia, severe obesity, impaired cognitive function, and hyperactivity associated with functional loss of one copy of the brain-derived neurotrophic factor (BDNF) gene. Diabetes. 2006;55:3366–3371. doi: 10.2337/db06-0550. [DOI] [PMC free article] [PubMed] [Google Scholar]
- 6.Nagahara AH, et al. Neuroprotective effects of brain-derived neurotrophic factor in rodent and primate models of Alzheimer’s disease. Nat Med. 2009;15:331–337. doi: 10.1038/nm.1912. [DOI] [PMC free article] [PubMed] [Google Scholar]
- 7.Schmid DA, et al. A TrkB small molecule partial agonist rescues TrkB phosphorylation deficits and improves respiratory function in a mouse model of Rett syndrome. J Neurosci. 2012;32:1803–1810. doi: 10.1523/JNEUROSCI.0865-11.2012. [DOI] [PMC free article] [PubMed] [Google Scholar]
- 8.Lonze BE, Ginty DD. Function and regulation of CREB family transcription factors in the nervous system. Neuron. 2002;35:605–623. doi: 10.1016/s0896-6273(02)00828-0. [DOI] [PubMed] [Google Scholar]
- 9.Greer PL, Greenberg ME. From synapse to nucleus: calcium-dependent gene transcription in the control of synapse development and function. Neuron. 2008;59:846–860. doi: 10.1016/j.neuron.2008.09.002. [DOI] [PubMed] [Google Scholar]
- 10.Simmons DA, et al. Up-regulating BDNF with an ampakine rescues synaptic plasticity and memory in Huntington’s disease knockin mice. Proc Natl Acad Sci USA. 2009;106:4906–4911. doi: 10.1073/pnas.0811228106. [DOI] [PMC free article] [PubMed] [Google Scholar]
- 11.Ogier M, et al. Brain-derived neurotrophic factor expression and respiratory function improve after ampakine treatment in a mouse model of Rett syndrome. J Neurosci. 2007;27:10912–10917. doi: 10.1523/JNEUROSCI.1869-07.2007. [DOI] [PMC free article] [PubMed] [Google Scholar]
- 12.Amir RE, et al. Rett syndrome is caused by mutations in X-linked MECP2, encoding methyl-CpG-binding protein 2. Nat Genet. 1999;23:185–188. doi: 10.1038/13810. [DOI] [PubMed] [Google Scholar]
- 13.Chang Q, Khare G, Dani V, Nelson S, Jaenisch R. The disease progression of Mecp2 mutant mice is affected by the level of BDNF expression. Neuron. 2006;49:341–348. doi: 10.1016/j.neuron.2005.12.027. [DOI] [PubMed] [Google Scholar]
- 14.Kolbeck R, Bartke I, Eberle W, Barde YA. Brain-derived neurotrophic factor levels in the nervous system of wild-type and neurotrophin gene mutant mice. J Neurochem. 1999;72:1930–1938. doi: 10.1046/j.1471-4159.1999.0721930.x. [DOI] [PubMed] [Google Scholar]
- 15.Rauskolb S, et al. Global deprivation of brain-derived neurotrophic factor in the CNS reveals an area-specific requirement for dendritic growth. J Neurosci. 2010;30:1739–1749. doi: 10.1523/JNEUROSCI.5100-09.2010. [DOI] [PMC free article] [PubMed] [Google Scholar]
- 16.Aktas O, Küry P, Kieseier B, Hartung HP. Fingolimod is a potential novel therapy for multiple sclerosis. Nat Rev Neurol. 2010;6:373–382. doi: 10.1038/nrneurol.2010.76. [DOI] [PubMed] [Google Scholar]
- 17.Foster CA, et al. Brain penetration of the oral immunomodulatory drug FTY720 and its phosphorylation in the central nervous system during experimental autoimmune encephalomyelitis: Consequences for mode of action in multiple sclerosis. J Pharmacol Exp Ther. 2007;323:469–475. doi: 10.1124/jpet.107.127183. [DOI] [PubMed] [Google Scholar]
- 18.Dev KK, et al. Brain sphingosine-1-phosphate receptors: Implication for FTY720 in the treatment of multiple sclerosis. Pharmacol Ther. 2008;117:77–93. doi: 10.1016/j.pharmthera.2007.08.005. [DOI] [PubMed] [Google Scholar]
- 19.Hasegawa Y, Suzuki H, Sozen T, Rolland W, Zhang JH. Activation of sphingosine 1-phosphate receptor-1 by FTY720 is neuroprotective after ischemic stroke in rats. Stroke. 2010;41:368–374. doi: 10.1161/STROKEAHA.109.568899. [DOI] [PMC free article] [PubMed] [Google Scholar]
- 20.Choi JW, et al. FTY720 (fingolimod) efficacy in an animal model of multiple sclerosis requires astrocyte sphingosine 1-phosphate receptor 1 (S1P1) modulation. Proc Natl Acad Sci USA. 2011;108:751–756. doi: 10.1073/pnas.1014154108. [DOI] [PMC free article] [PubMed] [Google Scholar]
- 21.Gonzalez-Cabrera PJ, et al. S1P(1) receptor modulation with cyclical recovery from lymphopenia ameliorates mouse model of multiple sclerosis. Mol Pharmacol. 2012;81:166–174. doi: 10.1124/mol.111.076109. [DOI] [PMC free article] [PubMed] [Google Scholar]
- 22.Osinde M, Mullershausen F, Dev KK. Phosphorylated FTY720 stimulates ERK phosphorylation in astrocytes via S1P receptors. Neuropharmacology. 2007;52:1210–1218. doi: 10.1016/j.neuropharm.2006.11.010. [DOI] [PubMed] [Google Scholar]
- 23.Sanchez T, Hla T. Structural and functional characteristics of S1P receptors. J Cell Biochem. 2004;92:913–922. doi: 10.1002/jcb.20127. [DOI] [PubMed] [Google Scholar]
- 24.Ancellin N, Hla T. Differential pharmacological properties and signal transduction of the sphingosine 1-phosphate receptors EDG-1, EDG-3, and EDG-5. J Biol Chem. 1999;274:18997–19002. doi: 10.1074/jbc.274.27.18997. [DOI] [PubMed] [Google Scholar]
- 25.Tremblay R, et al. Evidence that brain-derived neurotrophic factor neuroprotection is linked to its ability to reverse the NMDA-induced inactivation of protein kinase C in cortical neurons. J Neurochem. 1999;72:102–111. doi: 10.1046/j.1471-4159.1999.0720102.x. [DOI] [PubMed] [Google Scholar]
- 26.Guy J, Hendrich B, Holmes M, Martin JE, Bird A. A mouse Mecp2-null mutation causes neurological symptoms that mimic Rett syndrome. Nat Genet. 2001;27:322–326. doi: 10.1038/85899. [DOI] [PubMed] [Google Scholar]
- 27.West AE, et al. Calcium regulation of neuronal gene expression. Proc Natl Acad Sci USA. 2001;98:11024–11031. doi: 10.1073/pnas.191352298. [DOI] [PMC free article] [PubMed] [Google Scholar]
- 28.Malatesta P, et al. Neuronal or glial progeny: regional differences in radial glia fate. Neuron. 2003;37:751–764. doi: 10.1016/s0896-6273(03)00116-8. [DOI] [PubMed] [Google Scholar]
- 29.Zhu Y, et al. Ablation of NF1 function in neurons induces abnormal development of cerebral cortex and reactive gliosis in the brain. Genes Dev. 2001;15:859–876. doi: 10.1101/gad.862101. [DOI] [PMC free article] [PubMed] [Google Scholar]
- 30.Kamioka H, Maeda E, Jimbo Y, Robinson HP, Kawana A. Spontaneous periodic synchronized bursting during formation of mature patterns of connections in cortical cultures. Neurosci Lett. 1996;206:109–112. doi: 10.1016/s0304-3940(96)12448-4. [DOI] [PubMed] [Google Scholar]
- 31.Latham PE, Richmond BJ, Nelson PG, Nirenberg S. Intrinsic dynamics in neuronal networks. I. Theory. J Neurophysiol. 2000;83:808–827. doi: 10.1152/jn.2000.83.2.808. [DOI] [PubMed] [Google Scholar]
- 32.Harris KD, Hirase H, Leinekugel X, Henze DA, Buzsáki G. Temporal interaction between single spikes and complex spike bursts in hippocampal pyramidal cells. Neuron. 2001;32:141–149. doi: 10.1016/s0896-6273(01)00447-0. [DOI] [PubMed] [Google Scholar]
- 33.Barker JL, MacDonald JF. Picrotoxin convulsions involve synaptic and nonsynaptic mechanisms on cultured mouse spinal neurons. Science. 1980;208:1054–1056. doi: 10.1126/science.7375918. [DOI] [PubMed] [Google Scholar]
- 34.Norman E, Cutler RG, Flannery R, Wang Y, Mattson MP. Plasma membrane sphingomyelin hydrolysis increases hippocampal neuron excitability by sphingosine-1-phosphate mediated mechanisms. J Neurochem. 2010;114:430–439. doi: 10.1111/j.1471-4159.2010.06779.x. [DOI] [PMC free article] [PubMed] [Google Scholar]
- 35.Baquet ZC, Gorski JA, Jones KR. Early striatal dendrite deficits followed by neuron loss with advanced age in the absence of anterograde cortical brain-derived neurotrophic factor. J Neurosci. 2004;24:4250–4258. doi: 10.1523/JNEUROSCI.3920-03.2004. [DOI] [PMC free article] [PubMed] [Google Scholar]
- 36.Stearns NA, et al. Behavioral and anatomical abnormalities in Mecp2 mutant mice: a model for Rett syndrome. Neuroscience. 2007;146:907–921. doi: 10.1016/j.neuroscience.2007.02.009. [DOI] [PubMed] [Google Scholar]
- 37.Chao HT, et al. Dysfunction in GABA signalling mediates autism-like stereotypies and Rett syndrome phenotypes. Nature. 2010;468:263–269. doi: 10.1038/nature09582. [DOI] [PMC free article] [PubMed] [Google Scholar]
- 38.Vicario-Abejón C, Collin C, McKay RD, Segal M. Neurotrophins induce formation of functional excitatory and inhibitory synapses between cultured hippocampal neurons. J Neurosci. 1998;18:7256–7271. doi: 10.1523/JNEUROSCI.18-18-07256.1998. [DOI] [PMC free article] [PubMed] [Google Scholar]
- 39.Hofer M, Pagliusi SR, Hohn A, Leibrock J, Barde YA. Regional distribution of brain-derived neurotrophic factor mRNA in the adult mouse brain. EMBO J. 1990;9:2459–2464. doi: 10.1002/j.1460-2075.1990.tb07423.x. [DOI] [PMC free article] [PubMed] [Google Scholar]
- 40.Dieni S, et al. BDNF and its pro-peptide are stored in presynaptic dense core vesicles in brain neurons. J Cell Biol. 2012;196:775–788. doi: 10.1083/jcb.201201038. [DOI] [PMC free article] [PubMed] [Google Scholar]
- 41.Bibel M, et al. Differentiation of mouse embryonic stem cells into a defined neuronal lineage. Nat Neurosci. 2004;7:1003–1009. doi: 10.1038/nn1301. [DOI] [PubMed] [Google Scholar]
- 42.Saito T. In vivo electroporation in the embryonic mouse central nervous system. Nat Protoc. 2006;1:1552–1558. doi: 10.1038/nprot.2006.276. [DOI] [PubMed] [Google Scholar]
- 43.Gascon S, et al. Transcription of the NR1 subunit of the N-methyl-D-aspartate receptor is down-regulated by excitotoxic stimulation and cerebral ischemia. The Journal of biological chemistry. 2005;280(41):35018–35027. doi: 10.1074/jbc.M504108200. [DOI] [PubMed] [Google Scholar]
- 44.Pringle NP, et al. Fgfr3 expression by astrocytes and their precursors: Evidence that astrocytes and oligodendrocytes originate in distinct neuroepithelial domains. Development. 2003;130:93–102. doi: 10.1242/dev.00184. [DOI] [PubMed] [Google Scholar]
- 45.Heyden A, et al. Hippocampal enlargement in Bassoon-mutant mice is associated with enhanced neurogenesis, reduced apoptosis, and abnormal BDNF levels. Cell Tissue Res. 2011;346:11–26. doi: 10.1007/s00441-011-1233-3. [DOI] [PubMed] [Google Scholar]
Associated Data
This section collects any data citations, data availability statements, or supplementary materials included in this article.


