

Abstract
Understanding the genetic basis of gene regulatory variation is a key goal of evolutionary and medical genetics. Regulatory variation can act in an allele-specific manner (cis-acting) or it can affect both alleles of a gene (trans-acting). Differential allele-specific expression (ASE), in which the expression of one allele differs from another in a diploid, implies the presence of cis-acting regulatory variation. While microarrays and high-throughput sequencing have enabled genome-wide measurements of transcriptional ASE, methods for measurement of protein ASE (pASE) have lagged far behind. We describe a flexible, accurate, and scalable strategy for measurement of pASE by liquid chromatography-coupled mass spectrometry (LC-MS). We apply this approach to a hybrid between the yeast species Saccharomyces cerevisiae and Saccharomyces bayanus. Our results provide the first analysis of the relative contribution of cis-acting and trans-acting regulatory differences to protein expression divergence between yeast species.
Keywords: allele specific, divergence, mass spectrometry, protein expression, proteomics
Introduction
Genetic variation that alters the regulation of gene expression contributes to phenotypic variation within and between species (Wray et al, 2003; Rockman and Kruglyak, 2006; Gilad et al, 2008). Identifying the genetic differences that underlie regulatory variation remains a challenging problem as variation in gene expression results from a complex network of regulatory interactions. Regulatory variation can act in an allele-specific manner (cis-acting) or it can affect both alleles of a gene through the action of external regulators (trans-acting). Differentiating between these two types of regulatory variation provides molecular information that is useful in elucidating the genetic basis of phenotypic variation.
Measurement of differential allele-specific expression (ASE), in which the expression of one allele in a diploid differs from that of the other, implies the presence of regulatory variation that acts in cis, as both alleles are subject to the same trans-regulatory environment (Pastinen, 2010). Transcriptional ASE, as measured by RNA-seq and gene expression microarrays, has revealed widespread differential gene expression due to cis-acting regulatory variation in yeast (Ronald et al, 2005; Gagneur et al, 2009; Tirosh et al, 2009; Bullard et al, 2010; Emerson et al, 2010), fly (Wittkopp et al, 2004, 2008; McManus et al, 2010), mouse (Cowles et al, 2002; Gregg et al, 2010; Wang et al, 2010), and human (Yan et al, 2002; Pastinen and Hudson, 2004; Pant et al, 2006; Serre et al, 2008; Pickrell et al, 2010; Wagner et al, 2010).
In contrast to transcriptional ASE, protein ASE (pASE) promises to detect both translational and post-transcriptional cis-acting regulatory variation. Therefore, measurement of pASE is expected to provide biological insights that cannot be captured by measurement of the mRNA levels alone. However, measurements of pASE have been significantly limited by existing approaches and technologies. One specialized experimental approach uses large-format, two-dimensional gel electrophoresis (2D-GE) to measure pASE. The design relies on the identification and quantification of shifted spots that are mutually exclusive in parental samples, both present in F1 hybrids, and segregate in F2 or backcross progeny (Damerval et al, 1994; Klose et al, 2002). However, identifying such patterns is difficult due to technical variability between gels and due to the computational challenges associated with aligning large numbers of gels for spot identification. Moreover, the limited resolution of 2D-GE limits allele-specific measurements to proteins with extensive sequence length variation or variation that alters protein isoelectric points, and the requirement for excision and in-gel digestion of varying spots for identification by mass spectrometry renders data collection a labor intensive process.
Liquid chromatography-coupled mass spectrometry (LC-MS) overcomes many of the limitations of 2D-GE proteomics. Bottom-up LC-MS relies on an approach in which proteolytic digestion of a protein sample precedes automated chromatographic separations and analysis by mass spectrometry (Figure 1A). Computational analysis of parent mass spectra to detect and quantify extracted ion chromatogram peak areas and database search of fragmentation spectra against a predicted proteome of a sequenced individual or species enables identification and quantification of thousands of peptides and proteins (Aebersold and Mann, 2003). Unfortunately, amino-acid sequence variation changes the chemical composition of a peptide, altering its mass and ionization efficiency. These differences significantly complicate accurate and direct measurement of pASE by LC-MS. The intensity information obtained from chromatographic peak areas of two differing peptides cannot be compared directly. Therefore, measurement of pASE requires an approach that circumvents these intensity differences or measures a pASE ratio indirectly.
Figure 1.

Measuring protein allele-specific expression (pASE) by liquid chromatography-coupled mass spectrometry (LC-MS). (A) Main experimental steps of protein sample analysis by LC-MS. Protein alleles are extracted from a heterozygous diploid. These alleles may have amino-acid subsequences that are in common (cyan) and subsequences that allow allele A (green) and allele B (red) to be distinguished. The extracted proteins are proteolytically digested by an enzyme such as trypsin. The resulting peptides originate from allele A or allele B (red or green, variant peptides), or they will originate from shared amino-acid sequence (cyan, shared peptides). These three classes of peptides are separated by chromatography. Last, they are analyzed by quantitative mass spectrometry strategies that allow accurate measurement of ratios between a stable isotope labeled, heavy (H), and an unlabeled, light (L) sample through peptides with the same underlying sequence. (B) Our experimental strategy for measuring protein ASE in an AB heterozygous diploid by LC-MS relies on the availability of protein samples from AA and BB homozygotes for the protein of interest. After proteolytic digestion, peptides can be classified as follows: A variant peptides (green), B variant peptides (red), and shared peptides (cyan). Our approach assures that only peptides with the same sequence are compared to derive a ratio between peptides with differing sequence. The approach is based on the observation that variant peptides and shared peptides in the homozygous samples are in a one-to-one ratio. A and B designate the expression level of each allele. The corresponding subscript designates the expression level of each allele under each protein genotype. Note that AAA and BBB terms cancel in the right of the equation, leaving only the protein ASE ratio. Colors of the bar plots below designate which peptide is used to compute the ratio. (C) We used a quantitative proteomics strategy where the interspecies hybrid (yellow) was heavy isotope labeled (heavy, H) and each of the parental species S. cerevisiae (Scer, green) and S. bayanus (Sbay, red) were not labeled (light, L). The hybrid sample was split and combined one-to-one with each parental sample to generate two LC-MS data sets. To the right are example spectra for two protein alleles with both variant peptides (red and green) and shared peptides (cyan). Heavy and light doublets, with an expected isotope shift, are always present for shared peptides, but they are present for variant peptides only when the corresponding allele matches the parental species sample. The peak heights, quantified through LC-MS chromatographic peak areas, are used to derive the protein ASE ratio. (D) The mass spectra provide the necessary ratios for the computation of an interspecies expression ratio and, subsequently, a within hybrid pASE ratio (compare with B in this figure).
Results and discussion
Measuring protein ASE by LC-MS
We have developed an experimental design that enables the measurement of allele-specific protein expression in a diploid organism from ratios that can be measured directly and accurately by LC-MS. The method relies on the availability of two internal standards, one from an AA homozygote and another from a BB homozygote, to measure the allele-specific ratio in an AB heterozygote for each individual protein. The approach is based on the observation that after proteolytic digestion, peptides can be classified into three groups: variant peptides unique to allele A, variant peptides unique to allele B, and peptides shared between the two alleles (Figure 1B, left). In the homozygotes, the variant peptides and the shared peptides exist in a one-to-one ratio. Therefore, the product of the shared ratio between the homozygotes and the product of the two variant peptide ratios between the heterozygote and each homozygote equals the pASE ratio (Figure 1B, right). The key feature of this design is that all calculations involve ratios of intensities only for peptides with identical amino-acid sequences, thus circumventing the central problem of pASE measurement by LC-MS (see also Materials and methods). Isotopic labeling is used to differentiate the peptides originating from the homozygotes from those originating from the heterozygous sample. The use of isotopic labeling also assures accurate and robust ratio measurements (Ong and Mann, 2005).
We applied this design to an interspecies hybrid between two yeast species: Saccharomyces cerevisiae (Scer) and Saccharomyces bayanus (Sbay). We used homozygous diploids of the two parental species, grown under the same conditions, as the two internal standards. The hybrid was 15N labeled by metabolic incorporation of heavy (H) ammonium sulfate to assure accurate and robust quantification of peptides. The unlabeled (L) homozygous parental samples served as internal standards in two separate LC-MS data sets (Figure 1C, left). The samples were digested by trypsin and analyzed by LC-MS. Pairs of peaks, whose heights provide ratios needed for pASE measurements, exist for all shared peptides in the resulting mass spectra (Figure 1C, right). However, these pairs only exist for variant peptides if the peptide originates from the same species as the internal standard (Figure 1C, right). Using the homozygous parental strains provided an additional advantage: for shared peptides, the product of the hybrid versus parent ratios can be used to derive the expression difference between the two parental species (Figure 1D, left). Then, this interspecies ratio, and the necessary variant peptide ratios can be used to compute the pASE ratio within the hybrid (Figure 1D, right). In this instantiation of our experimental design, the homozygous parental strains provide the AA and BB homozygote protein standards for all pairs of AB protein orthologs expressed within the hybrid, thus allowing the computation and indirect, quantitative measurement of allele-specific protein expression within the interspecies hybrid (compare Figure 1D with Figure 1B).
To detect and quantify low abundance proteins and peptides with low ionization efficiency, LC-MS relies on sample fractionation and high-resolution chromatographic separation. These steps reduce the complexity of the mixture of peptides entering the mass spectrometer during data collection, improve instrument sensitivity and dynamic range, and increase the number of quantifiable peptides. To increase the number of quantified peptides per protein, we collected an LC-MS data set that consisted of 3-h reversed-phase LC-MS runs on each of 15 chromatographic fractions from offline strong cation exchange chromatography (SCX) for both the hybrid versus S. cerevisiae and hybrid versus S. bayanus samples (Materials and methods). These extensive separation steps increased the probability of detection and quantification of the three peptides necessary for pASE measurements: a peptide from the S. cerevisiae allele, a peptide from the S. bayanus allele, and a peptide shared between the two alleles.
We used our previously developed methods for LC-MS data analysis to identify and quantify the peptides needed to compute pASE ratios (Khan et al, 2009, 2011). Briefly, we used a merged database of predicted protein sequences from S. cerevisiae and S. bayanus to generate a non-redundant database of tryptic peptides. Each peptide retains an identifier of the protein ortholog and species from which it originated. Thus, peptides that are shared between the species have two species identifiers and variant peptides have only a single species identifier. We leveraged a database search algorithm that scores fragmentation spectra associated with an LC-MS chromatographic peak against the non-redundant database of peptides, filtered on a small window of intact mass and also on nitrogen composition, to find a highest scoring peptide match to each spectrum (Khan et al, 2011). Then, our methods determine the statistical significance of peptide spectrum match using a reverse decoy database to obtain a null distribution of scores and q-value methods to estimate the false discovery rate (FDR; Storey, 2002; Elias and Gygi, 2007). Statistically significant peptide spectrum matches at an FDR of 1% are filtered further to obtain a set of proteins for which all of the necessary peptides were quantified for computation of pASE ratios (Supplementary Table S1; Materials and methods). In total, we obtained pASE measurements for 589 distinct proteins in replicate 1 and 426 proteins in replicate 2. Last, the quantified ratios of shared peptides are used to adjust for loading differences between the internal standard sample and the interspecies hybrid. For replicate 1, all ratios from the S. cerevisiae versus hybrid sample were adjusted toward S. cerevisiae by 25.7% and all ratios from the S. bayanus versus hybrid sample were adjusted toward S. bayanus by 20.3%. We applied similar corrections for replicate 2: ratios from the S. cerevisiae versus hybrid sample were adjusted toward S. cerevisiae by 27.9%, and ratios from the S. bayanus versus hybrid sample were adjusted toward S. bayanus by 19.8%. These computational adjustments could be avoided by using an approach where protein is extracted from labeled and unlabeled cells separately. Total protein quantifications, followed by preview LC-MS runs, can then be used to normalize protein amounts. This alternative approach may introduce additional variability due to separate extraction of samples.
Accuracy and precision of protein ASE measurements
Using the LC-MS data collected, we first asked whether directly comparing the intensity information in chromatographic peak areas of variant peptides (i.e., peptides that differ due to amino-acid differences between species) originating from the hybrid produced consistent results. For 643 proteins with two peptides detected from both parental alleles (2 from S. cerevisiae and 2 from S. bayanus) from the hybrid, we created two variant peptide pairs (Figure 2A, right). As these pairs originate from the same two protein alleles, we expected that they should produce concordant peak area ratios if the values were directly comparable. For proteins with more than two distinct variant peptides from a parental species, we randomly assigned these peptides to two groups and used the median peak areas of these groups to derive two intensity ratios. We observed no correlation between the two sets of ratio measurements (Figure 2A), confirming that the intensity measurements for variant peptides are not directly comparable and underscoring the need for our alternative approach.
Figure 2.

Accuracy of protein allele-specific expression (pASE) measurements. (A) Direct comparison of the log2 ratios of chromatographic peak areas computed from two variant peptide pairs from the interspecies hybrid. (B) The log2 ratios of chromatographic peak areas measured between two distinct shared peptides (cyan) and S. cerevisiae (Scer) variant peptides (green) for the hybrid versus Scer sample. Each point corresponds to 404 proteins from technical replicate 1 for which pASE measurements were derived and two or more distinct shared and variant peptides were quantified. (C) The same plot for the hybrid versus S. bayanus (Sbay) sample for Sbay variant peptides (red) and shared peptides (cyan). The peptides compared are illustrated to the right. H, heavy and L, light reflect the isotope label that allows the two samples to be differentiated within an LC-MS data set.
To assess the accuracy of the individual ratios used to compute pASE measurements by our approach, we examined peptides from proteins where two or more distinct variant peptides and two or more distinct shared peptides were quantified in both of the hybrid versus parental samples (Figure 2B and C, right). In total, there were 404 such proteins in replicate 1 and 307 such proteins in replicate 2. If there were two or more such peptides, then we randomly assigned these distinct peptides to two groups and used the median ratio of these two peptide groups in place of individual peptides. If the variant peptides and, separately, the shared peptides were accurately identified and quantified, then we expected that they would generate concordant chromatographic peak area ratios, as these peptides originate from the same protein. For each replicate, we correlated these ratios (Figure 2B and C; Supplementary Figure S1a and b). For replicate 1 and replicate 2, we observed a Pearson’s correlation of 0.93 and 0.96, respectively, for the hybrid versus S. cerevisiae sample ratios and a Pearson’s correlation of 0.87 and 0.95, respectively, for the hybrid versus S. bayanus sample ratios. We also observed that for variant peptides the ratio of hybrid to parental strain was distributed around 0.5, reflecting that both alleles were expressed in the hybrid and, on proteome-wide average, are expressed at equal levels.
Two main sources of technical noise reduce the accuracy of the ratios used to compute pASE. As pASE is not measured directly, but calculated as a product of three different ratios (e.g., Figure 1B), controlling for technical noise is critical. The first source of technical noise originates from extracted ion chromatographic (XIC) peaks, which are used to derive the quantitative ratios. We applied methods from our previous work to address this low-level processing challenge (Khan et al, 2009). The second source of error originates from misidentification of peptides in the LC-MS data. We attempt to control for these misidentification errors using stringent 1% FDR cutoff for any high scoring peptide spectrum match (see Materials and methods). However, some misidentifications may remain within the data. For example, errors within the annotated proteome database, which result in incorrectly labeling peptides as variant or shared, cannot be controlled by an FDR cutoff alone. Consequently, we used our analysis of the concordance of peptide ratios derived from distinct peptides from the same protein (e.g., Figure 2B and C) to apply further filtering and select a high-confidence set of pASE measurements. First, we restricted this high-confidence set to proteins where at least two distinct shared peptides, two distinct variant peptides from S. cerevisiae, and two distinct variant peptides from S. bayanus were identified and quantified. Second, we eliminated proteins where the absolute difference between peptide 1 versus peptide 2 log2 ratios (Figure 2B and C) for distinct variant and distinct shared peptides was greater than 0.85, eliminating far outliers. We used this high-confidence set of 398 pASE measurements from proteins meeting these two criteria for all subsequent analyses (Supplementary Table S2). Last, we confirmed that measurements of pASE calculated from this high-confidence set were reproducible across our two replicates (Supplementary Figure S1c; Spearman’s correlation 0.82; Pearson’s correlation 0.90).
To confirm that the pASE ratios were computed accurately by our method, we conducted a rigorous control experiment in which we created a ‘synthetic hybrid’, a protein sample that consisted of a 1:1 mixture of the parental strains (Figure 3A), and compared the resulting ‘mock’ pASE measurements to ‘ground-truth’ interspecies ratio measurements obtained by comparing the strains directly. To generate the ‘ground-truth’ measurements, we independently cultured S. cerevisiae using 15N heavy (H) labeled minimal medium and S. bayanus in unlabeled (L) minimal medium (Figure 3B, top). In this independent sample, we directly measured interspecies expression ratios from chromatographic peak heights and areas using shared tryptic peptides between protein orthologs (Figure 3B, bottom; Supplementary Table S3). Next, we used the parental species as internal standards as required by our method (Figure 1C) with one critical and deliberate modification: the S. bayanus homozygous parental strain sample was grown in rich media with an acetate carbon source (Figure 3C). If we had used the parental strains grown in the same conditions instead, then the interspecies ratios, which are computed via shared peptides by normalizing out the ‘synthetic hybrid’ (Figure 1D, left) and subsequently used in the computation of the pASE ratios (Figure 1D, right), would be highly correlated with our ‘ground-truth’ measurements. Our modification to the S. bayanus standard assured that none of the ratios, in particular the interspecies ratios, used to compute the pASE ratios (Figure 1D, right) within the synthetic hybrid were correlated with the expected output, our ‘ground-truth’ measurements obtained by comparing the species directly.
Figure 3.

Accuracy of protein allele-specific expression (pASE) measurements using a ‘synthetic hybrid.’ (A) We combined a 1:1 mixture of protein samples from heavy, H, labeled parental strains, S. cerevisiae (Scer, green) and S. bayanus (Sbay, red), grown in minimal labeling media to create a ‘synthetic hybrid’ protein sample (yellow) from which we measured ‘mock’ pASE ratios using our method. (B) The resulting ‘mock’ pASE ratios were compared with ‘ground-truth’ interspecies expression ratios obtained from an independent experiment in which S. cerevisiae was heavy, H, labeled in minimal media and compared with an unlabeled, L, protein sample from S. bayanus grown in unlabeled minimal media. The ‘ground-truth’ interspecies expression ratios were obtained from paired peak heights generated by peptides shared between the two species. (C) Instead of using unlabeled parental samples grown under the same conditions as internal standards (e.g., Figure 1C), we used a pair of internal standards where the S. bayanus standard was grown in rich media with acetate, instead of glucose, as a carbon source (YPA). This design assured that the interspecies ratios, computed by normalizing out the ‘synthetic hybrid’ (e.g., Figure 1D, left), reflected both a species and condition effect; they were uncorrelated with the ‘ground-truth’ measurements. Thus, any ratios used to compute ‘mock’ pASE ratios (e.g., Figure 1D, right) were uncorrelated with the ‘ground-truth’ ratios obtained by direct comparison of the strains. (D) Scatterplot of ratios, derived by normalizing out the contribution of the ‘synthetic hybrid,’ on the x axis and the pASE ratios from the ‘synthetic hybrid’ on the y axis. (E) Scatterplot of ‘mock’ pASE ratios from the synthetic hybrid (y axis) with the corresponding ‘ground-truth’ interspecies ratios (x axis). (F) A second set of ‘ground-truth’ measurements plotted with the synthetic hybrid pASE ratios. This second set of ‘ground-truth’ interspecies ratios, from unlabeled S. cerevisiae and S. bayanus samples both grown in minimal media, was obtained in our previous experiment by normalizing out the contribution of the interspecies hybrid (e.g., Figure 1C and D).
To limit the instrument time required for the control experiment, we did not employ the extensive off-line SCX fractionation steps we used for the initial data set. Instead, we used a 3-h LC-MS gradient on an unfractionated protein sample, from which we derived 47 high-confidence ‘mock’ pASE ratios for the synthetic hybrid sample (Supplementary Table S4). The high-confidence set was generated using the same filtering criteria we applied previously to the hybrid ASE ratios. With the pASE ratios computed for the synthetic hybrid, we first confirmed that we disrupted the correlation between the interspecies ratios (computed according to Figure 1D, left) and the pASE ratios (computed according to Figure 1D, right) for the synthetic hybrid (Figure 3D, Spearman’s correlation 0.20; Pearson’s correlation 0.13). Also, consistent with expectation, the spread of interspecies ratio distribution observed in our unlabeled internal standard was larger, as illustrated by the wide distribution along the x axis in Figure 3D, as these ratios captured not only interspecies differences, but also protein expression differences due to the differing growth medium and carbon source. Next, we verified that the pASE ratios derived from the synthetic hybrid sample were correlated with the ‘ground-truth’ ratios obtained by direct comparison of the species grown in minimal medium (Figure 3E; Spearman’s correlation 0.831; Pearson’s correlation 0.76). In addition, we confirmed that these ratios were correlated to a second set of ‘ground-truth’ measurements from unlabeled parental strains in minimal medium (Figure 3F; Spearman’s correlation 0.833; Pearson’s correlation 0.80). We previously derived these measurements by normalizing out the contribution of the 15N heavy labeled hybrid (Figure 1C and D). To test the statistical significance of the apparent agreement between our ‘mock’ pASE ratios and our directly measured ‘ground-truth’ interspecies ratios, we conducted a permutation test in which we used the sum of the absolute differences, the L1 norm, between log2 ratios as a test statistic. We chose this statistic because it provided a more stringent measure of the agreement between the two measurements than both Pearson and Spearman’s correlation, which only capture linear and rank-based dependence between variables, respectively. We generated a null distribution over the L1 norm by permuting the log2 ratios used to compute our ‘mock’ pASE ratios a total of 105 times. The generated null distribution confirmed that agreement we observed between ‘mock’ and ‘ground-truth’ ratios was highly significant (P<10−5). We also used the set of absolute differences between our log2 ‘mock’ pASE ratios and the log2 directly measured ‘ground-truth’ ratios to derive an empirical log2-fold cutoff at which we could classify pASE ratios as significantly different at a given FDR. Because the differences captured noise when agreeing ratios were measured by our methods, we used them to estimate the cutoff at which proteins can be considered to show significant pASE difference. We used a bootstrap resampling procedure to estimate the mean of the following statistic: the cutoff at which 5% of the bootstrap resampled differences were misclassified as different. Using 105 bootstrap iterations, we selected a log2 cutoff of 1.0286 (see Materials and methods). The use of bootstrapping helped assures that the cutoff was less sensitive to noise in the data and reassuringly the log2 cutoff was not appreciably different without the use of Bootstrap (log2 of 0.9560). Our analyses suggest that pASE ratios were estimated at ∼2-fold precision in ∼95% of the cases and indicate that we should be able to detect expression differences two-fold or greater at an empirically determined FDR of 5%. In summary, the results indicate that the pASE ratios were accurately computed by our method. Furthermore, the results are reproducible and resilient to the metabolic labeling status of the cells, as the direct measurements and the hybrid-derived interspecies measurements were obtained from cells cultured at independent times with differing labeling status.
Protein expression divergence
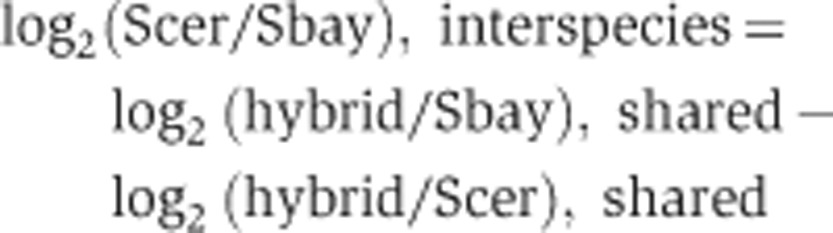
Protein expression divergence results from the combined effect of cis-acting (allele specific) and trans-acting effects. Measurement of protein expression divergence between S. cerevisiae and S. bayanus and pASE in an interspecies hybrid allows the relative contribution of these two sources of regulatory variation to be distinguished (Wittkopp et al, 2004). These additional data provide important information for determining the genetic basis of these differences and understanding how the regulation of protein expression evolves. An estimate of the trans-acting component of the expression differences can be computed by subtracting the log2 hybrid ratio from the log2 parental interspecies ratio as follows:
This difference is the off-diagonal component in a plot of the log2(hybrid) pASE ratios versus the parental log2(interspecies) ratios (Figure 4A). Proteins with expression divergence attributable to only cis-acting regulatory differences should fall exactly along the diagonal and individual proteins can be classified on the basis of whether only cis- or trans-regulatory differences contribute to expression divergence or both (McManus et al, 2010). To control for misclassification of proteins into the categories cis or trans, we used the results of our analysis of the absolute differences between the log2 ‘mock’ pASE ratios and the log2 directly measured ‘ground-truth’ ratios from our control experiment (see Materials and methods). We were able to use the results because the control experiment captured noise when agreeing ratios were measured using similar methods as the proteins in Figure 4A. We used the Bootstrap derived log2-fold cutoff of 1.0286 to classify proteins on the basis of whether cis- or trans-regulatory differences contribute to protein expression divergence at an empirically determined FDR of 5%. We found that 8.0% (21+11)/398 proteins showed cis-effects (blue and purple points in Figure 4A) and 13.8% (44+11)/398 proteins showed trans-effects (green and purple points in Figure 4A). Note 11 proteins showed both cis- and trans-effects (purple points in Figure 4A). Reassuringly, the percentage of proteins in each category was above the 5% FDR. Overall, our results reveal a larger contribution of cis-regulatory differences to protein expression divergence than recent studies of intraspecific proteome variation (Foss et al, 2007, 2011), reflecting the greater genetic divergence between species than within species. This observation is also consistent with previous studies of mRNA expression divergence, which have reported a larger contribution of cis-regulatory differences between species than within species (Wittkopp et al, 2008; Emerson et al, 2010).
Figure 4.

Protein expression divergence attributable to cis- and trans-regulatory variation. (A) Plot of protein allele-specific expression (pASE) in the hybrid and the corresponding expression ratios between the parental strains S. cerevisiae (Scer) and S. bayanus (Sbay). Blue points highlight proteins where the interspecies expression divergence is to cis-effects, green points highlight proteins were the divergence is primarily attributable to trans-effects, and purple points highlight proteins where the protein expression divergence is due to both cis-effects and trans-effects. Red points designate proteins with significant interspecies differences, but no significant cis-effect (pASE difference) or trans-effect (off diagonal component). Gray points designate proteins that are conserved, with no significant cis- or trans-effect. Diagonal light green lines designate empirically determined 5% FDR log2-fold cutoffs for significant trans-effects. Horizontal light blue lines designate empirically determined 5% FDR log2-fold cutoffs for significant cis-effects. (B) Distribution of |log2(trans)| the magnitude protein expression divergence attributable to trans-regulatory variation and (C) the distribution of |log2(cis)| the magnitude protein expression divergence attributable to cis-regulatory variation for essential genes (blue points) and non-essential genes (red points). (D) GFP intensity in minimal media measurements from (Newman et al, 2006) divided by essential and non-essential for the same proteins shown in (B) and (C). In each of the boxplots, center line designates the median, ends of boxes designate quartiles, whiskers designate 1.5 times the interquartile range for the respective quartile, and notches designate the ∼95% confidence interval of the median. Essential genes were obtained from Giaever et al (2002).
Next, we examined our protein expression measurements for evidence of evolutionary constraint. We found that the median magnitude of the expression differences due to both cis-regulatory differences and trans-regulatory differences was significantly less for essential genes than for non-essential genes (Figure 4B and C). We asked whether the absolute expression level of essential genes, which might be quantified at higher precision if they were on average more highly expressed than non-essential genes, could explain our observation of lower divergence of essential proteins. We used previous estimates, determined by green fluorescent protein (GFP) intensity, of the absolute expression level of an S. cerevisiae protein when cells were grown in supplemented minimal medium (Newman et al, 2006). When we divided the GFP intensity measurements of the same proteins for which we had divergence estimates by essentiality, we found no significant difference between two groups (Figure 3D). The absolute expression level of essential proteins we quantified was no higher than non-essential proteins we quantified, demonstrating that our observations of expression differences cannot be explained by expression level and is instead likely due to a higher level of stabilizing selection on protein levels of essential genes.
Regulatory variation that alters the expression level of an individual protein that is part of a complex may affect the regulation of all subunits of that complex to maintain stoichiometry. Therefore, some degree of modularity might be expected in protein expression divergence. To investigate the modularity of protein expression divergence, we grouped our expression measurements by complex for each member of a curated set of known yeast protein complexes (Pu et al, 2009). We estimated the degree of modularity based on the extent of coordination in divergence estimates for complexes where we had expression measurements for four or more members. We quantified the degree of coordination using the standard deviation of the log2 expression ratios. To determine if the expression divergence measurements of the complexes were significantly coordinated, we permuted the expression ratios to compute a null distribution over the standard deviation of a complex with the same number of measured subunits (Figure 5). With few exceptions, we found that the cis-acting component of protein expression divergence, measured as the pASE ratio in the hybrid, showed no significant coordination. Whereas, the trans-acting component, the difference between the parental interspecies species ratio and the hybrid ratio, was significantly coordinated across subunits for 9 out of the 12 complexes analyzed, as might be expected for a trans-regulatory factor.
Figure 5.

Coordination of protein allele-specific expression (pASE) measurements. Interspecies ratios between the S. cerevisiae (Scer) and S. bayanus parental species (blue points), pASE ratios within the hybrid (yellow points), and the corresponding trans-effect (gray points) grouped by known protein complex. Only complexes with four or more subunits quantified are shown. Complexes were obtained from a curated set by Pu et al (2009). The notation below the complex name designates the statistical significance of the coordination of the expression ratios. The coordination was measured by the standard deviation of the log2 ratios. P-values were computed by permuting the expression ratios to generate a null distribution over the standard deviation of complexes with the same number of measured subunits. The results of the permutation tests are listed as follows: (cis-effects/pASE, interspecies ratios, trans-effects) where ns designates not significant; *P<0.05; **P<0.01; ***P<0.001.
Inheritance of expression levels
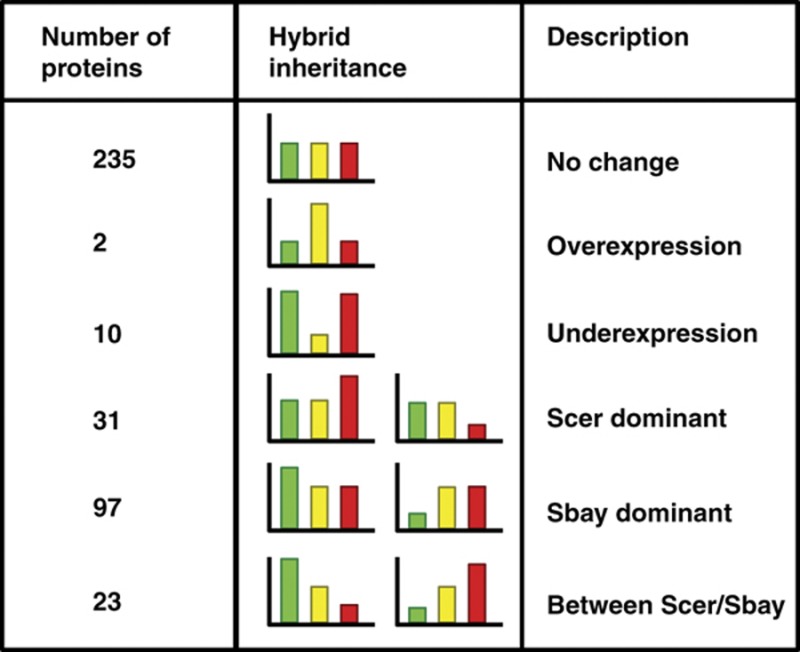
In addition to protein expression divergence, our data allowed us to measure the degree of dominance of protein expression levels in the interspecies hybrid. Through the expression differences quantified using peptides shared between protein orthologs, we determined the relative expression differences between the parental species and the hybrid (Table I). Over half of the relative expression differences measured between the parental species and the hybrid did not differ. For proteins with expression level differences between the two parental species, we observed extensive dominance of the S. bayanus allele; that is, the hybrid most frequently matched the expression level of this parent species, with a smaller number of proteins showing dominance of the S. cerevisiae allele or an expression level that ranged between the parent species. However, greater coverage of the proteome will be necessary to establish the significance of this trend. Finally, 12 proteins had expression levels in the hybrid that were higher or lower than either the parental species, indicating possible misexpression. This result warrants further investigation of these proteins and their role in phenotypic differences between the hybrid and the two parental species.
Table 1. Inheritance patterns of protein expression levels in the interspecies hybrid.
|
The relative expression levels were obtained using log2(hybrid/Scer) and log2(hybrid/Sbay) ratios. Log2 threshold of >0.5, or 41.4%, was used to classify proteins on expression level differences into the six categories above. In the bar plots, yellow designates the hybrid, green S. cerevisiae, and red S. bayanus.
Comparative analysis of mRNA ASE and pASE measurements
Protein expression divergence between species reflects differences in transcriptional and post-transcriptional regulation at all stages from mRNA stability to translation efficiency and protein stability. To estimate the extent of post-transcriptional cis-acting regulatory divergence, we compared our pASE measurements to mRNA ASE measurements from a recent study of the same interspecies hybrid (Bullard et al, 2010). We found a modest correlation between our pASE measurements and these previous mRNA ASE measurements (Figure 6; Spearman’s correlation 0.373, P<10−12; Pearson’s correlation 0.331; P<10−9). When we separately considered the correlation between replicate 1 (Supplementary Figure S2a; Spearman’s correlation 0.325, P<10−8; Pearson’s correlation 0.306, P<10−8) and replicate 2 (Supplementary Figure S2b; Spearman’s correlation 0.407, P<10−10; Pearson’s correlation 0.354, P<10−8), our second replicate produced pASE measurements in slightly higher agreement with mRNA ASE measurements.
Figure 6.

Comparative analysis of steady-state mRNA allele-specific expression (ASE) and our protein ASE measurements. mRNA ASE measurements were obtained from a recent study (Bullard et al, 2010) of an interspecies hybrid between S. cerevisiae and S. bayanus, the same two species we analyzed. A total of 358 proteins had both mRNA ASE and protein ASE measurements. The Spearman’s correlation for this data is 0.373, and the Pearson’s correlation is 0.331. Green points designate proteins that may reflect cis-acting post-transcriptional regulatory divergence.
The modest correlation we observed between previous mRNA ASE and our pASE suggests that an extensive degree of cis-acting post-transcriptional regulatory divergence may exist between S. cerevisiae and S. bayanus. We observe differences in pASE that are not present at the mRNA level, as well as differences in mRNA ASE that are not maintained at the protein level. At a per-protein level, the extent of cis-acting divergence attributable to post-transcriptional effects can be quantified by the off diagonal component in a scatterplot of mRNA ASE and pASE measurements:
Thus, proteins with significant post-transcriptional cis-effects can be identified based on the magnitude of this term (Figure 6) We estimate that 98 out of 358 proteins with both mRNA ASE and pASE measurements may reflect post-transcriptional cis-effects, although environmental and noise in the mRNA ASE measurements cannot be ruled out of our analyses as described below. We arrived at this number by using the absolute differences between our two replicate measurements of log2(post-transcriptional ASE) to estimate the misclassification rate of a log2 cutoff. More specifically, we used the mean of a bootstrap distribution over the following test statistic: the log2 cutoff where only 5% of the differences between two replicate measurements of log2(post-transcriptional ASE) were misclassified as differing. However, the number of proteins identified with possible post-transcriptional cis-effects estimated by our analysis might be inflated by several factors. First, the cells in our study were grown in a condition different from that used to generate the mRNA data. Although mRNA ASE measurements have been shown to be fairly stable across conditions (Tirosh et al, 2009), environmental factors may reduce the correlation coefficient between pASE and mRNA ASE and inflate our estimates of post-transcriptional cis-acting divergence. In addition to noise in the pASE measurements, accurate quantification of mRNA ASE by RNA-seq remains, at present, a work in progress (DeVeale et al, 2012).
In addition to our comparative analysis of mRNA and pASE, we conducted further exploratory analyses that examined the connection between our measurements, mRNA stability, and codon usage (Supplementary Results and Discussion). As recent results have shown a possible mechanistic coupling between mRNA transcription, decay, and translation (Harel-Sharvit et al, 2010), we jointly analyzed our measurements of pASE and interspecies protein expression differences with previous measurements of mRNA decay and RNA binding protein footprints collected in S. cerevisiae. When we directly correlated our interspecies protein expression ratios and our pASE ratios with mRNA half-life measured in S. cerevisiae (Shalem et al, 2008), we found no correlation with our pASE measurements and a modest correlation to our interspecies protein measurements as well as our estimates of the trans-acting component of protein expression divergence (Supplementary Figure S4). We additionally found significant associations between specific RNA binding protein targets and cis-effects, trans-effects, and the possible post-transcriptional component of cis-effects on these targets (Supplementary Figures S5 and S6). Under the limited assumptions of our analysis, our results point to a possible link between mRNA decay and mRNA and protein expression divergence. As synonymous codon usage has been shown to be under extensive selection, we compared the post-transcriptional component of pASE with codon adaptation profiles previously computed for both S. cerevisiae and S. bayanus (Man and Pilpel, 2007). We found no correlation to mRNA ASE (Spearman’s correlation −0.042), pASE (0.081), and the qpost-transcriptional component of pASE as estimated by log2(post-transcriptional ASE)=log2(pASE)−log2(mRNA ASE) (Spearman’s correlation 0.072). However, we found very weak correlations to interspecies protein expression divergence (Spearman’s correlation 0.15) and the trans component of protein expression divergence (Spearman’s correlation 0.12). While little can be concluded by such weak correlations, this result raises the possibility that divergence in the translational machinery might impact protein expression divergence between these yeast species. We additionally explored whether the predicted cis-dependent post-transcriptional changes reflected in our pASE measurements and in previous measurements of mRNA ASE could be linked to any specific regulatory mechanism. Specifically, we asked whether uAUG-containing transcripts differed in their sensitivity to cis-acting regulatory divergence than their non-uAUG containing counterparts. When we combined sensitivities to cis-acting regulatory variation, measured by |log2(pASE)|+|log2(mRNA ASE)|, we found a highly significant difference between uAUG-containing transcripts and non-uAUG containing transcripts (P=0.00091; Wilcoxon rank sum; Supplementary Figure S7). Our result suggests that uAUG-containing transcripts may have greater sensitivity to cis-acting regulatory divergence and this sensitivity is jointly reflected in mRNA ASE and pASE measurements, warranting further study of the connection between uAUGs and cis-acting regulatory divergence.
Future directions and challenges
We have introduced the first experimental strategy for the measurement of pASE in a heterozygous diploid by LC-MS. This method is flexible, high-throughput, and broadly applicable. The approach can be used with a range of high-throughput quantitative proteomics strategies. One such strategy would be to use two isotope labels. This has two advantages over the single 15N label we used: only a single sample is needed for LC-MS analysis, and the ratio between the parental species can be measured directly (Supplementary Figure S3). Our approach can be applied to the analysis of total protein samples, as in this work, or in experiments that involve isolation of individual proteins and protein complexes. The strategy applies, without modification, to model systems where completely homozygous parental lines are available. However, extension to humans and other outbred organisms will be challenging. One simple approach to address this challenge in humans might be the careful selection of homozygous protein samples on a per protein basis to serve as the necessary internal standards. These samples can be selected by using the genotyping results of exome sequencing or other resequencing efforts (Ng et al, 2009).
Our method tests the limits of current protein mass spectrometry methods by requiring quantitative measurements of three peptides from each protein to compute ASE ratios. To achieve this for hundreds of proteins, we used extensive sample fractionation and sensitive mass spectrometry. We anticipate that advances in chromatographic separation and mass spectrometry technology will soon enable protein quantification at high coverage, as quantification of an entire proteome has already been achieved (Godoy et al, 2008). In addition, the requirement of our method for three peptides per protein also introduces a degree of ascertainment bias within the LC-MS data. For proteins with extensive sequence divergence, the few available shared peptides may ionize with low efficiency, rendering them undetectable by mass spectrometry without extensive sample fractionation or enrichment. A similar problem exists for proteins where the sequence divergence is small. The few available variant peptides might be difficult to detect and quantify by mass spectrometry. However, this problem can be mitigated, in part, by the use of multiple endoproteases and multiple peptide fragmentation technologies, which have already been shown to increase the coverage and diversity of peptides that can be detected and identified from an individual protein in proteome-wide analyses (Swaney et al, 2008, 2010).
To demonstrate the usefulness of our strategy for measuring pASE, we applied our quantification approach to an interspecies hybrid between the yeast species S. cerevisiae and S. bayanus. While much work remains to be done to extend our approach to measure pASE across an entire yeast proteome, our results provide the first analysis of the effect of cis-acting and trans-acting regulatory divergence on protein expression divergence between yeast species. Combined with genome-wide hybrid mRNA ASE and interspecies mRNA measurements, as well as allele-specific and interspecies mRNA decay experiments, we expect that our method will provide a powerful systems-level tool for elucidating the genetic basis of gene expression differences within and between species, and more broadly, gene regulatory variation.
Materials and methods
Yeast strains and growth conditions
The following strains were used in this work: S. bayanus ACY35 (diploid prototroph, hoΔ::KAN/hoΔ::HYG), S. cerevisiae ACY616 (prototroph FY4/FY5 diploid), hybrid S. bayanus/S. cerevisiae ACY458 (diploid prototroph S. bayanus hoΔ::HisG/S. cerevisiae FY4). Cells were grown in SD minimal media with 2% w/v glucose as carbon source. The SD media contained 1.7 g/l yeast nitrogen base (without amino acids or ammonium sulfate) Becton Dickinson DIFCO #233520 and 5 g/l 15N ammonium sulfate (15NH4SO4, 99%, NLM-713-5, Cambridge Isotope Laboratories, Andover, MA, USA) or 14N ammonium sulfate (Fisher BioReagents). Overnight cultures were diluted into fresh SD minimal media to OD600=0.1 and shaken at 180 r.p.m. at 25°C, a temperature at which the growth rates of the two species and their interspecies hybrid are equal. In all, 215 OD600 units per sample (or 430 OD600 units for single species samples) were rapidly harvested by vacuum filtration (Kontes) onto 90 mm cellulose acetate filters (Millipore) and snap frozen in liquid nitrogen when the cultures reached OD600=0.45.
Protein extraction
Snap frozen cells on filters were mechanically disrupted in liquid nitrogen with a milling device (Retch Cryomill) with a 5 min pre-cool at 5 Hz, followed by a 20-min cryogrinding at 25 Hz. In all, 215 OD600 units of the 15N grown ACY458 hybrid on a filter was mixed 1:1 by grinding in a capsule together with a filter containing 215 OD600 of a 14N parental species. The frozen material was solubilized by addition of 10 ml of boiling resuspension/solubilization buffer (4% SDS; 100 mM Tris pH 7.4, 100 mM DTT; 2 × HALT Protease and Phosphatase Inhibitors, EDTA free). The solubilized sample was boiled in a hot water bath at 100°C for 10 min with mixing at 5 min intervals. After boiling, the sample was spun to remove insoluble material (∼4000 g on a tabletop Eppendorf 5810 with swinging bucket rotor) for 10 min at 4°C. Protein samples were quantified by reducing agent compatible BCA assay (Pierce 23250).
Mass spectrometry sample preparation
Samples were subjected to buffer exchange, thiol reduction and alkylation, and tryptic digestion by the FASP procedure (Wisniewski et al, 2009). Peptides were desalted using a home-packed capillary reversed-phase column (500 μm i.d. × 20 cm, POROS 10R2 C18 resin) using a Harvard syringe pump, and eluted directly onto a home-packed capillary strong cation exchange column (500 μm i.d. × 45 cm, POROS SCX resin), which was connected to the outlet of the reversed-phase column to minimize sample loss. SCX fractionation of peptides was conducted using a Dionex Ultimate NanoLC capillary HPLC system (Dionex, Sunnyvale, CA), using a gradient from a 75%:25% mix of buffers A:B to 100% buffer B (buffer A: 7 mM KH2PO4, pH 2.65, 30% ACN; buffer B: 7 mM KH2PO4, 350 mM KCl, pH 2.65, 30% ACN) over an 80-min period at the flow rate of 10 μl/min, followed by column stripping and reconditioning for 10 min in buffer C (50 mM KH2PO4, 500 mM NaCl, pH 7.5) and water. SCX fractions were collected every 5 min and were pooled into 15 fractions of roughly equivalent peptide abundance according to the integration of their UV absorbance (λ=214 nm) values during the course of separation.
Mass spectrometry data acquisition
Fractions were desalted using StageTip micro-scale reversed-phase chromatography (Rappsilber et al, 2003), then subjected to reversed-phase nano-LC-MS and MS/MS performed on a nano-flow capillary high pressure HPLC system (Eksigent, Dublin, CA, USA) coupled to an LTQ-Orbitrap hybrid mass spectrometer (ThermoFisher Scientific, San Jose, CA, USA). Sample concentration and desalting were performed online using a trapping capillary column (200 μm × ca. 30 mm, packed with 5 μm, 100 Å Magic AQ C18 material; Michrom, Auburn, CA, USA) at a flow rate of 7 μl/min for 3.5 min, while separation was achieved using an analytical capillary column (75 μm × ca. 20 cm, packed with 3 μm, 100 Å Magic AQ C18 material; Michrom) terminating in a pulled sprayer tip, under a linear gradient of A and B buffers (buffer A: 3% ACN/ 0.1% FA; buffer B: 97% ACN/ 0.1% FA) over 180 min at a flow rate of ∼0.5 μl/min. Electrospray ionization was carried out at 2.5 kV, with the LTQ heated capillary set to 200°C. Full-scan mass spectra were acquired in the Orbitrap in the positive-ion mode over the m/z range of 300–1800 at a resolution of 60 000. MS/MS spectra were simultaneously acquired using the LTQ for the seven most abundant multiply charged species in the full-scan spectrum having signal intensities of >1000 NL. Dynamic exclusion was set such that MS/MS was acquired only once for each species over a period of 120 s.
LC-MS data analysis
Database searches and 15N quantification were performed using the open source software PVIEW (release 14 July 2011; http://compbio.cs.princeton.edu/pview). We used a database search window of ±10 p.p.m., allowing for one missed tryptic cleavage. We used a merged proteome database consisting of all of the entries from the S. cerevisiae orf_trans_mod.fasta (downloaded from the Saccharomyces Genome Database http://www.yeastgenome.org on 5 May 2011) and from the joint WashU/MIT assembly of S. bayanus. Only search results with a stringent FDR of 1% were used for analysis. For each peptide spectrum match, we kept the S. cerevisiae ORF identifier of the protein ortholog from which the peptides originated as well as an identifier designating the species database. Peptides that mapped to more than one protein within a single species database, mapped to a protein without an ortholog in the other species, or multiple locations within the same protein were removed. Peptides mapping to both species with a matching S. cerevisiae ORF identifier were designated as shared for that ortholog. Peptides mapping to only to one species and ortholog ORF identifier were kept as variant peptides. Only protein orthologs where at least two distinct shared peptides, two distinct variant peptides from S. cerevisiae, and two distinct variant peptides from S. bayanus were identified and quantified were used for subsequent analyses.
Computation of pASE ratios
To correct for minor differences in sample loading, the ratios from the hybrid versus parent samples were normalized so that the median of log2(hybrid/parent) ratio distribution of all shared peptides was centered at zero. For each protein ortholog, independent measurements of the log2(hybrid/Sbay) and log2(hybrid/Scer) ratios were randomly assigned to two groups. This grouping was performed separately for shared and variant peptide ratios. When the median of log2 ratios in these two groups differed by >0.85 the protein ortholog was removed. The median of the multiple measurements of the same protein ortholog was used to derive estimates of the log2(hybrid/Sbay) and log2(hybrid/Scer) ratios for shared and variant peptides separately.
Interspecies expression ratios were computed by normalizing out the hybrid term using shared peptides from each of the hybrid versus parent samples:
 |
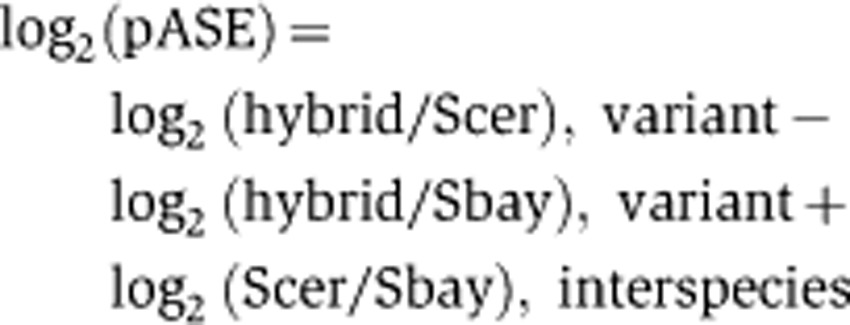
pASE ratios were computed according to the following using the above interspecies ratios and ratios derived from variant peptides in each of the hybrid versus parent samples:
 |
The trans-effect was computed as follows:
Cis- and trans-effect assignments by empirical FDR control
We used our synthetic hybrid control experiment to derive a log2-fold cutoff at which the FDR of the cis- and trans-effect assignments in Figure 4A was controlled at 5%. We were able to use the results because the control experiment to empirically control the FDR because the experiment captured noise when agreeing ratios were measured using similar methods as the proteins from the parental strains and the interspecies hybrid (Figure 4A). To add stability to our cutoff estimate, we used a Bootstrap procedure as follows: we computed the individual absolute |log2(‘mock’ protein ASE) – log2(‘ground-truth’)| differences from the synthetic hybrid and the directly measured interspecies ratios. For each bootstrap replicate, we sampled the same number of absolute differences from this set with replacement. We sorted the sampled differences from smallest to largest and selected the difference in the 97.5th percentile. We used the 97.5th percentile because the cutoff was used for both tails of log2-fold distribution, controlling FDR at 5% overall. We collected a total of 105 absolute difference values in the percentile. We computed the mean of these bootstrap values to arrive at an estimate of a log2-fold cutoff.
We classified proteins into the following categories as follows:
(i) cis-only (blue points in Figure 4A):
| log2(pASE) |⩾FDR 5% cutoff and | log2(protein trans) |<FDR 5% cutoff.
(ii) trans-only (green points in Figure 4A):
| log2(pASE) |<FDR 5% cutoff and | log2(protein trans) |⩾FDR 5% cutoff.
(iii) cis and trans (purple points in Figure 4A):
| log2(pASE) |⩾FDR 5% cutoff and | log2(protein trans) |⩾FDR 5% cutoff.
(iv) conserved (gray points in Figure 4A):
| log2(pASE) |<FDR 5% cutoff and | log2(protein trans) |<FDR 5% cutoff and | log2(Scer/Sbay), interspecies |<FDR 5% cutoff.
(v) unassigned (red points in Figure 4A): remaining proteins after classification into four groups above.
Availability
Source code for computing protein ASE measurements, generating the figures that support the claims in this manuscript, and all of the raw mass spectra analyzed in this manuscript are available for download at http://compbio.cs.princeton.edu/pview/proteinASE. All raw mass spectra have also been deposited in the Proteome Commons Tranche repository under accession hash:
Yp24/w2UjJ8Qp1WDknjf5IZoJWGTN0zKbFpm9XLz7CGAg1xRx32TUV1njJPzRdQ4t/YiTo5YA5nj+ex5CcdqnWpe3UIAAAAAAAAEuw==
Supplementary Material
'The scripts use the R statistical package and depend on the plyr library from ggplot2.
Supplementary Information, Supplementary Figures S1–7
Peptides identified and quantified in each replicate at an FDR of 1%.
High-confidence protein allele-specific expression (pASE) measurements S. cerevisiae/S. bayanus interspecies hybrid and the corresponding interspecies expression ratios for the parental strains.
Interspecies expression measurements computed by directly comparing a heavy labeled S. cerevisiae protein sample to an unlabeled S. bayanus sample.
Protein allele-specific expression (pASE) ratios derived from the synthetic hybrid sample used in our control experiment.
Acknowledgments
We thank NIH grant R37 MH59520 (LK); James S McDonnell Centennial Fellowship (LK); Howard Hughes Medical Institute (LK); NIH grant P50 GM071508 (ZK, AAC, and MS). We would like to thank Harmen Bussemaker, Dario Ghersi, Josh Shapiro, Yoav Gilad, Allegra Petti, Athma Pai, and the anonymous referees for their insightful discussions and comments on drafts of this manuscript.
Author contributions: ZK designed and implemented the method. ZK conducted the data analysis and wrote the manuscript with input from SA, AAC, JSB, MS, DHP, and LK. DHP conducted the mass spectrometry experiments and data acquisition. JSB conducted the initial pilot experiment from which the feasibility of the method was assessed. AAC selected the strains, cultured the cells, and harvested protein samples. ZK, JSB, MS, SA, DHP, LK, and AAC jointly conceived of the study in its design and coordination. All authors read and approved the final manuscript.
Footnotes
The authors declare that they have no conflict of interest.
References
- Aebersold R, Mann M (2003) Mass spectrometry-based proteomics. Nature 422: 198–207 [DOI] [PubMed] [Google Scholar]
- Bullard JH, Mostovoy Y, Dudoit S, Brem RB (2010) Polygenic and directional regulatory evolution across pathways in Saccharomyces. Proc Natl Acad Sci 107: 5058–5063 [DOI] [PMC free article] [PubMed] [Google Scholar]
- Cowles CR, Hirschhorn JN, Altshuler D, Lander ES (2002) Detection of regulatory variation in mouse genes. Nat Genet 32: 432–437 [DOI] [PubMed] [Google Scholar]
- Damerval C, Maurice A, Josse JM, de-Vienne D (1994) Quantitative trait loci underlying gene product variation: a novel perspective for analyzing regulation of genome expression. Genetics 137: 289–301 [DOI] [PMC free article] [PubMed] [Google Scholar]
- DeVeale B, van der Kooy D, Babak T (2012) Critical evaluation of imprinted gene expression by RNA-Seq: a new perspective. PLoS Genet 8: e1002600. [DOI] [PMC free article] [PubMed] [Google Scholar]
- Elias JE, Gygi SP (2007) Target-decoy search strategy for increased confidence in large-scale protein identifications by mass spectrometry. Nat Methods 4: 207–214 [DOI] [PubMed] [Google Scholar]
- Emerson JJ, Hsieh L-C, Sung H-M, Wang T-Y, Huang C-J, Lu HH-S, Lu M-YJ, Wu S-H, Li W-H (2010) Natural selection on cis and trans regulation in yeasts. Genome Res 20: 826–836 [DOI] [PMC free article] [PubMed] [Google Scholar]
- Foss EJ, Radulovic D, Shaffer SA, Goodlett DR, Kruglyak L, Bedalov A (2011) Genetic variation shapes protein networks mainly through non-transcriptional mechanisms. PLoS Biol 9: e1001144. [DOI] [PMC free article] [PubMed] [Google Scholar]
- Foss EJ, Radulovic D, Shaffer SA, Ruderfer DM, Bedalov A, Goodlett DR, Kruglyak L (2007) Genetic basis of proteome variation in yeast. Nat Genet 39: 1369–1375 [DOI] [PubMed] [Google Scholar]
- Gagneur J, Sinha H, Perocchi F, Bourgon R, Huber W, Steinmetz LM (2009) Genome-wide allele- and strand-specific expression profiling. Mol Syst Biol 5: 274. [DOI] [PMC free article] [PubMed] [Google Scholar]
- Giaever G, Chu AM, Ni L, Connelly C, Riles L, Veronneau S, Dow S, Lucau-Danila A, Anderson K, Andre B, Arkin AP, Astromoff A, El Bakkoury M, Bangham R, Benito R, Brachat S, Campanaro S, Curtiss M, Davis K, Deutschbauer A et al. (2002) Functional profiling of the Saccharomyces cerevisiae genome. Nature 418: 387–391 [DOI] [PubMed] [Google Scholar]
- Gilad Y, Rifkin SA, Pritchard JK (2008) Revealing the architecture of gene regulation: the promise of eQTL studies. Trends Genet 24: 408–415 [DOI] [PMC free article] [PubMed] [Google Scholar]
- de Godoy LM, Olsen JV, Cox J, Nielsen ML, Hubner NC, Frohlich F, Walther TC, Mann M (2008) Comprehensive mass-spectrometry-based proteome quantification of haploid versus diploid yeast. Nature 455: 1251–1254 [DOI] [PubMed] [Google Scholar]
- Gregg C, Zhang J, Butler JE, Haig D, Dulac C (2010) Sex-specific parent-of-origin allelic expression in the mouse brain. Science 329: 682–685 [DOI] [PMC free article] [PubMed] [Google Scholar]
- Harel-Sharvit L, Eldad N, Haimovich G, Barkai O, Duek L, Choder M (2010) RNA polymerase II subunits link transcription and mRNA decay to translation. Cell 143: 552–563 [DOI] [PubMed] [Google Scholar]
- Khan Z, Amini S, Bloom J, Ruse C, Caudy A, Kruglyak L, Singh M, Perlman D, Tavazoie S (2011) Accurate proteome-wide protein quantification from high-resolution 15N mass spectra. Genome Biol 12: R122. [DOI] [PMC free article] [PubMed] [Google Scholar]
- Khan Z, Bloom JS, Garcia BA, Singh M, Kruglyak L (2009) Protein quantification across hundreds of experimental conditions. Proc Natl Acad Sci 106: 15544–15548 [DOI] [PMC free article] [PubMed] [Google Scholar]
- Klose J, Nock C, Herrmann M, Stühler K, Marcus K, Blüggel M, Krause E, Schalkwyk LC, Rastan S, Brown SD, Büssow K, Himmelbauer H, Lehrach H (2002) Genetic analysis of the mouse brain proteome. Nat Genet 30: 385–393 [DOI] [PubMed] [Google Scholar]
- Man O, Pilpel Y (2007) Differential translation efficiency of orthologous genes is involved in phenotypic divergence of yeast species. Nat Genet 39: 415–421 [DOI] [PubMed] [Google Scholar]
- McManus CJ, Coolon JD, Duff MO, Eipper-Mains J, Graveley BR, Wittkopp PJ (2010) Regulatory divergence in Drosophila revealed by mRNA-seq. Genome Res 20: 816–825 [DOI] [PMC free article] [PubMed] [Google Scholar]
- Newman JRS, Ghaemmaghami S, Ihmels J, Breslow DK, Noble M, DeRisi JL, Weissman JS (2006) Single-cell proteomic analysis of S. cerevisiae reveals the architecture of biological noise. Nature 441: 840–846 [DOI] [PubMed] [Google Scholar]
- Ng SB, Turner EH, Robertson PD, Flygare SD, Bigham AW, Lee C, Shaffer T, Wong M, Bhattacharjee A, Eichler EE, Bamshad M, Nickerson DA, Shendure J (2009) Targeted capture and massively parallel sequencing of 12 human exomes. Nature 461: 272–276 [DOI] [PMC free article] [PubMed] [Google Scholar]
- Ong S, Mann M (2005) Mass spectrometry-based proteomics turns quantitative. Nat Chem Biol 1: 252–262 [DOI] [PubMed] [Google Scholar]
- Pant PVK, Tao H, Beilharz EJ, Ballinger DG, Cox DR, Frazer KA (2006) Analysis of allelic differential expression in human white blood cells. Genome Res 16: 331–339 [DOI] [PMC free article] [PubMed] [Google Scholar]
- Pastinen T (2010) Genome-wide allele-specific analysis: insights into regulatory variation. Nat Rev Genet 11: 533–538 [DOI] [PubMed] [Google Scholar]
- Pastinen T, Hudson TJ (2004) Cis-acting regulatory variation in the human genome. Science 306: 647–650 [DOI] [PubMed] [Google Scholar]
- Pickrell JK, Marioni JC, Pai AA, Degner JF, Engelhardt BE, Nkadori E, Veyrieras J-B, Stephens M, Gilad Y, Pritchard JK (2010) Understanding mechanisms underlying human gene expression variation with RNA sequencing. Nature 464: 768–772 [DOI] [PMC free article] [PubMed] [Google Scholar]
- Pu S, Wong J, Turner B, Cho E, Wodak SJ (2009) Up-to-date catalogues of yeast protein complexes. Nucl Acids Res 37: 825–831 [DOI] [PMC free article] [PubMed] [Google Scholar]
- Rappsilber J, Ishihama Y, Mann M (2003) Stop and go extraction tips for matrix-assisted laser desorption/ionization, nanoelectrospray, and LC/MS sample pretreatment in proteomics. Anal Chem 75: 663–670 [DOI] [PubMed] [Google Scholar]
- Rockman MV, Kruglyak L (2006) Genetics of global gene expression. Nat Rev Genet 7: 862–872 [DOI] [PubMed] [Google Scholar]
- Ronald J, Brem Rachel B, Whittle J, Kruglyak L (2005) Local Regulatory Variation in Saccharomyces cerevisiae. PLoS Genet 1: 25. [DOI] [PMC free article] [PubMed] [Google Scholar]
- Serre D, Gurd S, Ge B, Sladek R, Sinnett D, Harmsen E, Bibikova M, Chudin E, Barker DL, Dickinson T, Fan J-B, Hudson TJ (2008) Differential allelic expression in the human genome: a robust approach to identify genetic and epigenetic cis-acting mechanisms regulating gene expression. PLoS Genet 4: 1000006. [DOI] [PMC free article] [PubMed] [Google Scholar]
- Shalem O, Dahan O, Levo M, Martinez MR, Furman I, Segal E, Pilpel Y (2008) Transient transcriptional responses to stress are generated by opposing effects of mRNA production and degradation. Mol Syst Biol 4: 223. [DOI] [PMC free article] [PubMed] [Google Scholar]
- Storey JD (2002) A direct approach to false discovery rates. J R Stat Soc Series B Stat Methodol 64: 479–498 [Google Scholar]
- Swaney DL, McAlister GC, Coon JJ (2008) Decision tree-driven tandem mass spectrometry for shotgun proteomics. Nat Methods 5: 959–964 [DOI] [PMC free article] [PubMed] [Google Scholar]
- Swaney DL, Wenger CD, Coon JJ (2010) Value of using multiple proteases for large-scale mass spectrometry-based proteomics. J Proteome Res 9: 1323–1329 [DOI] [PMC free article] [PubMed] [Google Scholar]
- Tirosh I, Reikhav S, Levy AA, Barkai N (2009) A yeast hybrid provides insight into the evolution of gene expression regulation. Science 324: 659–662 [DOI] [PubMed] [Google Scholar]
- Wagner JR, Ge B, Pokholok D, Gunderson KL, Pastinen T, Blanchette M (2010) Computational analysis of whole-genome differential allelic expression data in human. PLoS Comput Biol 6: 1000849. [DOI] [PMC free article] [PubMed] [Google Scholar]
- Wang X, Soloway P, Clark A (2010) Paternally biased X inactivation in mouse neonatal brain. Genome Biol 11: R79. [DOI] [PMC free article] [PubMed] [Google Scholar]
- Wisniewski JR, Zougman A, Nagaraj N, Mann M (2009) Universal sample preparation method for proteome analysis. Nat Methods 6: 359–362 [DOI] [PubMed] [Google Scholar]
- Wittkopp PJ, Haerum BK, Clark AG (2004) Evolutionary divergence of cis and trans gene regulation. Nature 430: 85–88 [DOI] [PubMed] [Google Scholar]
- Wittkopp PJ, Haerum BK, Clark AG (2008) Genetic basis of regulatory variation within and between Drosophila species. Nat Genet 40: 346–350 [DOI] [PubMed] [Google Scholar]
- Wray GA, Hahn MW, Abouheif E, Balhoff JP, Pizer M, Rockman MV, Romano LA (2003) The evolution of transcriptional regulation in Eukaryotes. Mol Biol Evol 20: 1377–1419 [DOI] [PubMed] [Google Scholar]
- Yan H, Yuan W, Velculescu VE, Vogelstein B, Kinzler KW (2002) Allelic variation in human gene expression. Science 297: 1143–1143 [DOI] [PubMed] [Google Scholar]
Associated Data
This section collects any data citations, data availability statements, or supplementary materials included in this article.
Supplementary Materials
'The scripts use the R statistical package and depend on the plyr library from ggplot2.
Supplementary Information, Supplementary Figures S1–7
Peptides identified and quantified in each replicate at an FDR of 1%.
High-confidence protein allele-specific expression (pASE) measurements S. cerevisiae/S. bayanus interspecies hybrid and the corresponding interspecies expression ratios for the parental strains.
Interspecies expression measurements computed by directly comparing a heavy labeled S. cerevisiae protein sample to an unlabeled S. bayanus sample.
Protein allele-specific expression (pASE) ratios derived from the synthetic hybrid sample used in our control experiment.