

Abstract
Large-scale cancer genomics projects are profiling hundreds of tumors at multiple molecular layers, including copy number, mRNA and miRNA expression, but the mechanistic relationships between these layers are often excluded from computational models. We developed a supervised learning framework for integrating molecular profiles with regulatory sequence information to reveal regulatory programs in cancer, including miRNA-mediated regulation. We applied our approach to 320 glioblastoma profiles and identified key miRNAs and transcription factors as common or subtype-specific drivers of expression changes. We confirmed that predicted gene expression signatures for proneural subtype regulators were consistent with in vivo expression changes in a PDGF-driven mouse model. We tested two predicted proneural drivers, miR-124 and miR-132, both underexpressed in proneural tumors, by overexpression in neurospheres and observed a partial reversal of corresponding tumor expression changes. Computationally dissecting the role of miRNAs in cancer may ultimately lead to small RNA therapeutics tailored to subtype or individual.
Keywords: gene regulatory programs, integrative cancer genomics, microRNA regulation, microRNAs in glioblastoma
Introduction
Large-scale cancer genomics projects (The Cancer Genome Atlas Research Network, 2008; Hudson et al, 2010) are currently generating rich multi-modal tumor profiling data sets for very large collections of tumors, but arguably these data are still underused. Such studies provide multiple layers of genome-wide data for each tumor—e.g., DNA copy number, promoter methylation, mRNA expression, and miRNA expression—and should enable integrative modeling of the mechanisms of dysregulation of gene expression. However, typical computational analyses examine each layer independently or combine the layers using generic evidence integration methods or post hoc statistical approaches.
Glioblastoma multiforme (GBM), the subject of multiple high-throughput characterization efforts (Phillips et al, 2006; Li et al, 2009), is a prime example of a data-rich cancer, and recent computational studies of GBM show both the successes and limitations of current practice. Much effort has focused on the problem of identifying GBM tumor subtypes by clustering mRNA expression data (Phillips et al, 2006; Li et al, 2009; Verhaak et al, 2010). The most recent of these studies integrated mRNA profiles from multiple array platforms on TCGA samples to define four expression-based subtypes called proneural, classical, mesenchymal, and neural and found differing patterns of mutations of PDGFRA, IDH1, EGFR, and NF1 among these subtypes (Verhaak et al, 2010). More recently, another TCGA group profiled promoter DNA methylation alterations in GBM tumors to define a glioma-CpG island methylator phenotype (G-CIMP), which they observed was preferentially enriched in the proneural subtype (Noushmehr et al, 2010). One integrative algorithmic effort jointly clustered samples across multiple data sources (Shen et al, 2009). However, the mechanisms that give rise to these different subtypes are incompletely understood; transcriptomic subtypes may arise from different progenitor populations or be initiated by different driver mutations (Verhaak et al, 2010), but most of the evidence remains correlative. Moreover, various proposed expression subtype categorizations map imperfectly onto each other (Huse et al, 2011). Aside from clustering approaches, there have been efforts to use reverse-engineering techniques on mRNA expression data to identify master transcriptional regulators in high-grade gliomas (Carro et al, 2010) and on joint mRNA and copy number profiles to find ‘driver’ copy number aberrations in GBM (Jornsten et al, 2011). Notably, these systems biology approaches attempt to derive transcriptional or more abstract driver-to-target regulatory relationships without making use of regulatory sequence or binding information.
The role of miRNA-mediated regulation in GBM has been relatively understudied in computational efforts, although there has been a recent study of competing endogenous RNAs in glioblastoma that may act as miRNA ‘sponges’ in oncogenic pathways (Sumazin et al, 2011). Aberrant expression of miRNAs in glioblastoma tumors, early-passage glioblastoma cell cultures, and established glioblastoma cell lines has been widely observed (Chan et al, 2005; Corsten et al, 2007; Silber et al, 2008; Chiocca and Lawler, 2010; Godlewski et al, 2010) and one miRNA, miR-26a, has been shown to promote gliomagenesis in vivo by repression of the tumor suppressor PTEN. Impairment of the miRNA regulatory network is now viewed as a key mechanism of glioblastoma pathogenesis (Godlewski et al, 2010; Kim et al, 2011), and miRNA expression signatures have been used to classify GBM into subtypes related to lineages in the nervous system (Kim et al, 2011). An emerging hypothesis proposes that suppression of developmentally important miRNAs contributes to maintenance of stem cell renewal and proliferation, while their expression leads to differentiation (Godlewski et al, 2010; Kim et al, 2011). Despite extensive research on the potential contribution of miRNAs to tumor cell ‘stemness’ and to regulation of oncogenic pathways in GBM, miRNAs have been largely excluded from systematic computational modeling of GBM and indeed other cancers (Basso et al, 2005; Akavia et al, 2010; Carro et al, 2010; Jornsten et al, 2011).
Here, we propose an integrative strategy to combine mRNA, copy number, and miRNA profiles with regulatory sequence information to decipher transcriptional and miRNA-mediated regulatory programs in glioblastoma, using the TCGA data set for training and statistical validation. Our approach learns the key direct regulators, both transcription factors (TFs) and miRNAs, that account for differential gene expression beyond copy number changes in each tumor sample relative to normal brain reference samples, using promoter and 3′UTR motif features with sparse regression. We first learned tumor-specific regression models by training on each sample independently, and we examined whether tumors fell into different subgroups based on their regression models. Classifying tumors into existing expression subtypes is not a goal of our study, and indeed a priori it is not clear how well our regulatory models will recover previously defined ‘transcriptomic’ subtypes: potentially, these subtypes might be attributable to different frequencies of large-scale copy number aberrations, or to different degrees of stromal contamination, to give two possibilities. Nevertheless, we found that tumors belonging to the previously defined proneural and mesenchymal classes have distinct regulatory models. This result suggests that the distinct expression changes in these two classes can be attributed in part to the dysregulation of subtype-specific TFs and miRNAs. To further examine potential subtype-specific regulatory programs, we retrained the tumor models jointly along with subtype assignments and identified key common and subtype-specific regulators. We call these regulators ‘drivers’ of differential expression, since they can statistically explain a significant part of the pathogenic expression changes in tumors. Note that this analysis does not presume to identify the key mutation events in tumor development; rather, we are characterizing the patterns of dysregulation in tumors in terms of TFs and miRNAs.
We focused experimental follow-up on the proneural subtype, where we confirmed that gene sets associated with significant regulators in our model were consistent with in vivo expression changes in a mouse model of PDGF-driven tumors. We also tested key miRNA regulators, miR-124 and miR-132, both underexpressed in proneural tumors, by transfection into PDGF-driven neurospheres and showed that they drive expression changes that are concordant with tumor-versus-normal expression changes in the proneural class. By contrast, when we overexpressed control miRNAs that are underexpressed in proneural tumors but are not chosen by the model, the expression changes induced in our neurosphere model are not concordant with tumor-versus-normal expression changes.
Results
An integrative regression model explains dysregulated mRNA expression profiles in tumor samples
We set out to learn statistical models of the transcriptional and miRNA-mediated regulatory programs that underlie expression changes in tumor samples versus normal tissue by appropriately incorporating regulatory elements as well as measured genomic and epigenomic alterations as features in the model (Figure 1A). Tumor-specific miRNA expression changes are used to restrict the miRNAs that can be used as explanatory variables (Figure 1A).
Figure 1.

Modeling gene expression changes in tumors to identify dysregulated transcription factors and microRNAs. (A) Genome-wide measurements like copy number, DNA methylation, and miRNA expression are used to predict gene expression changes of tumor samples relative to normal references. (B) To infer dysregulated regulatory programs from tumor profiling data, change in gene expression in a tumor sample is modeled as linear function of the gene’s copy number, DNA methylation at the promoter (when available for the sample), and counts of transcription factor binding sites in the DNaseI hypersensitive regions of the gene’s promoter and conserved miRNA binding sites in the 3′UTR. (C) The linear model is trained for all tumors, either on a sample-by-sample basis or simultaneously by using a group approach, on all Refseq genes using sparse regression so that only a few explanatory variables have non-zero regression coefficients. In particular, only a small number of transcription factors (TFs) and miRNAs, that is, those whose binding sites best correlate with target gene expression changes in the tumor sample, enter into the regression model. Feature dependency analysis on these regression models identifies common and subtype-specific regulators.
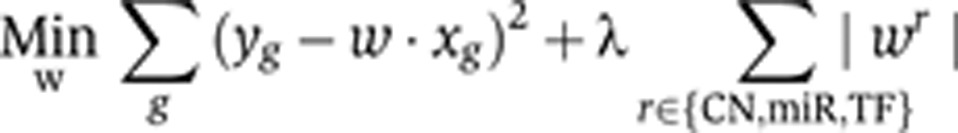
We first assessed whether we could train regression models to predict log gene expression changes in each tumor, using regulatory elements in gene promoters and 3′UTRs and gene copy number data. In samples where DNA methylation data at gene promoters were also available, we also expanded the model to include a summarized DNA methylation feature (see Materials and methods) for each gene. In this setting, training examples correspond to genes within a given tumor sample: the output or response variable is the log expression change of each gene, while the input variables or features consist of counts of TF and miRNA binding sites in the gene’s regulatory regions, an estimate of the gene’s average copy number from aCGH data, and (where available) a measure of promoter DNA methylation (Figure 1B). Using a simple mechanistic model of gene expression, we expected log gene expression change to be globally correlated to gene copy number; we attributed residual log expression changes beyond copy number (and promoter methylation) to differential regulation mediated by regulatory elements via a linear model based on motif counts in the promoter and 3′UTR. In other words, after taking copy number and DNA methylation into account, we try to explain tumor versus normal differential gene expression in terms of the dysregulated activity of TFs and miRNAs by correlation with motif counts. Formally, this can be formulated as a regression model:
 |
where yg is the log expression change in the tumor (relative normal tissue) for gene g; Cg is the gene’s copy number; Ng,r is the count of binding sites for TF or miRNA r in the gene’s promoter or 3′UTR, respectively; and w=(wCN, wmiR, wTF) is the model vector of regression coefficients (Materials and methods). As motif data, we used binding site predictions for 152 human sequence-specific TFs based on motif hits from the TRANSFAC database (Kel et al, 2003) and for 434 miRNA seed families based on conserved 7-mer seed matches (see Materials and methods; Supplementary Tables 1–3). For the TF motifs, we filtered for hits that fall in DNaseI accessible regions based on DNase-seq data for a glioma cell line available through the ENCODE project (Materials and methods; Figure 1B).
To avoid overfitting in the presence of noisy expression data and a large number of explanatory variables, we first used regularized regression via a lasso constraint (Tibshirani, 1996) to identify a small number of TFs and miRNAs that best explain global changes in expression on a sample-by-sample basis (Figure 1C). The lasso constraint enforces sparsity in the learned parameters, that is, compels most of the regression coefficients to be zero. This reduces the number of features included in the model, leading to better prediction accuracy and more interpretable results. The sample-by-sample approach trains a regression model for each tumor independently and does not use information about the tumor’s assignment to previously defined transcriptomic subtypes. We also developed a group lasso approach for training all the sample-specific regression models together, sharing information across samples while encoding information about transcriptomic subtypes (Figure 1C). In both the sample-by-sample and group models, we imposed the additional constraint that only a tumor’s differentially expressed miRNAs be considered as potential features in the regression model.
We evaluated our sample-by-sample approach on a data set of 161 GBM tumors from TCGA belonging to the proneural, mesenchymal, and classical subtypes (Verhaak et al, 2010); we removed samples of the neural subtype, which is believed to be an ill-defined category (Huse et al, 2011). We were encouraged to find that the sample-by-sample regression models did indeed predict tumor versus normal expression changes with significant accuracy. In particular, in 10-fold cross-validation experiments on held-out genes, we obtained a mean Spearman rank correlation between predicted and measured gene expression changes of 0.174, a modest but highly significant result (P<2e−16), shown in Figure 2A. By contrast, if we either randomized the output gene expression values or randomized motif hits and then trained sample-by-sample regression models, we obtained mean Spearman correlations just below 0. It is important to note that gene copy number was chosen as a feature in all samples and led to a significant improvement in cross-validation performance (P<2.2e−16, signed-rank test), underscoring the fact that copy number is an important factor for explaining gene expression changes in tumors. We also confirmed that filtering TF motif hits by DNaseI accessibility led to better prediction performance than restricting to conserved TF binding sites (Supplementary Figure 1A). However, using miRNA expression instead of number of conserved seed matches did not significantly affect performance (Supplementary Figure 1B). Furthermore, in samples where array-based DNA methylation data were also available, including a summary promoter methylation feature for each gene led to significantly improved performance. We examined the regression models learned when we included methylation as a feature and found that the corresponding model coefficients were large negative values in all samples. The negative sign is consistent with the role of promoter methylation in repression of gene expression (Supplementary Figure 1C).
Figure 2.

Sparse regression models predict differential expression of held-out genes and subtypes of tumor samples. (A) Plot showing Spearman correlations between predicted and actual gene expression changes for all samples, sorted based on performance of the group lasso model using copy numbers, TF binding sites, and miRNA binding sites. For each method and each sample, the Spearman correlation is computed using 10-fold cross-validation on held-out genes. Using only TFs and miRNAs as features is significantly better than random (P<2.2e−16, Wilcoxon signed-rank test); adding copy numbers for the full sample lasso model significantly improves cross-validation performance over using only TFs and miRNAs (P<2.2e−16), while the group lasso approach outperforms the full lasso model (P<2.2e−16). TCGA subtypes are shown in the top bar. Cross-validation performance is uniform across the three main subtypes. (B) Unsupervised hierarchical clustering of tumors of proneural and mesenchymal subtypes by their sample-specific lasso model coefficients (shown as columns in the heatmap) separates proneural from mesenchymal samples. The clustering was performed using all features, but for clarity only the features with largest mean aggregate squared error changes (Figure 3A) are shown in the heatmap.
Next, we examined whether the regression models reflected existing expression-based subtype definitions. Even though the regression models can explain a significant part of tumor-versus-normal expression changes, it is not clear a priori that differences between regression models will coincide with different subtype assignments. For example, it is possible that expression subtypes are dominated by different patterns of large-scale copy number aberrations, which are absorbed into a single feature in our regression models, or reflect different degrees of stromal contamination. However, we found that clustering the samples by their regression models—that is, representing each sample by its sparse vector of regression coefficients for TFs and miRNAs—recovered to some extent the distinction between subtypes; in particular, proneural samples were well separated from mesenchymal samples, while classical samples appeared to be an intermediate category between the other two (Supplementary Figure 2A). In fact, when we reclustered after removing classical samples, we found that the regression models for proneural and mesenchymal samples cleanly separated into two groups, with only a few samples clustering into the wrong group (Figure 2B; adjusted Rand index 0.8233). Interestingly, these results are supported by a recent analysis that found the proneural and mesenchymal transcriptomic subtypes to be the only statistically stable categories that could be reproduced over data sets, while other proposed categories (classical, neural, and proliferative) (Phillips et al, 2006; Verhaak et al, 2010) were not consistent (Huse et al, 2011). Our findings further suggest that distinct transcriptional and miRNA-mediated regulatory programs underlie these two transcriptomic subtypes. We note that regression models trained on randomized motif information did not cluster by subtype or recover the difference between proneural versus mesenchymal subtypes, showing that the correlation between regulatory models and subtype annotations depends on having meaningful regulatory information and is not the result of other systematic biases (Supplementary Figure 2B; adjusted Rand index 0.231). Furthermore, the distinction between the two subtypes is not recovered by clustering based on TF and microRNA expression (Supplementary Figure 2C; adjusted Rand index 0.01).
Classifying tumors into existing expression subtypes is not the goal of our study. However, as a sanity check, we decided to assess how well the lasso models can predict subtype-specific expression changes and generalize to unseen data. We used the average proneural, classical, and mesenchymal regression models from our training set as prototype subtype-specific models to predict expression-based subtypes on a test set of an additional 160 TCGA GBM tumors. The test set tumors were labeled as proneural, classical, or mesenchymal based on signatures of small gene sets (Supplementary Table 1) that were previously defined to represent the three subtypes (Verhaak et al, 2010). For each test sample, we computed the squared error for each of the three average subtype models in explaining the tumor sample’s expression changes. The average model that minimized the squared error was predicted as the subtype label for the sample. This approach led to a good classification accuracy of 78.9% (Supplementary Figure 2D), again with the most errors in the classical subtype. Since the subtypes were labeled by a gene set defined on the training set, these results give a proof of principle that our regulatory models have predictive power to recover proneural and mesenchymal transcriptomic subtypes.
Joint learning of tumor models captures subtype-specific regulatory programs in GBM
With these results in hand, we concluded that (i) our sparse regression models do indeed explain a meaningful part of the dysregulation of gene expression in glioblastoma, based on their ability to predict tumor versus normal fold changes on held-out genes; and (ii) the regression models also capture existing definitions of transcriptomic subtypes. We therefore implemented a multitask group lasso approach (Kim and Xing, 2010) to learn regression models for all samples at the same time while encoding subtype assignments. This approach allows us to share information across samples and use the structure of the optimization problem to identify regulators (miRNAs and TFs) that act in a subtype-specific or common manner. More precisely, we use a group lasso or mixed L2/L1 regularization function (Kim and Xing, 2010), where we impose groupings of the regression coefficients corresponding to the same regulator across (i) all samples in each subtype or (ii) across the whole data set and we encode each group as an L2 constraint (Materials and methods; Supplementary Figure 3). This constraint structure encourages a miRNA or TF either to have a zero regression coefficient across all samples of a subtype (or all samples in the data set) or to be chosen consistently with non-zero coefficient across the subtype (or data set).
As expected, the group lasso approach produced regression models that were more consistent across subtypes, and clustering samples by their regression model vectors now recovered clusters corresponding to proneural, classical, and mesenchymal subtypes (Supplementary Figure 4B). More interestingly, we also obtained a small improvement in prediction performance in 10-fold cross-validation on held-out genes, suggesting that sharing information across samples while encoding subtype assignments leads to more accurate regulatory models (Supplementary Figure 4A). By contrast, when we used group lasso without subtype labels, that is, sharing information but not allowing regulators to be subtype specific, we did not see any significant improvement in cross-validation performance (P<0.41, Wilcoxon signed-rank test).
Feature analysis recovers common and subtype-specific drivers of expression changes
While group lasso gave sparse regression models for individual samples (only a few TFs/miRNAs with non-zero regression coefficients) and improved consistency across subtypes, we wanted to determine the most statistically robust subtype-specific and common regulators contained in our models. To this end, we performed a feature dependency analysis to measure the extent of gene expression changes explained by each regulator. In this procedure, we set the regression coefficient of each single regulator to zero for all samples belonging to a particular subtype and computed the change in total square loss over all genes in these samples. Key regulators are those whose removal incurs a large increase in loss over samples in the subtype. We identified subtype-specific candidate regulators by a threshold corresponding to FDR of 10% determined by training group regression models on randomized versions of the feature matrix (see Materials and methods). Figure 3A shows the results of feature dependency analysis for the proneural subtype, with miRNAs and TFs sorted by the increase in total square loss incurred by their individual removal from the model. Most regulators are not chosen in any of the proneural regression models and therefore lead to zero change in loss, while only a handful of key regulators—including miR-124, miR-132 and the transcriptional regulators Yin Yang-1 (YY1) and GABP—pass the FDR cutoff.
Figure 3.

Feature analysis of group models identifies common and subtype-specific regulators and their target gene sets. (A) Regulators are ranked based on increase in squared error across samples of a subtype after excluding the regulator from regression models. Candidate regulators for each subtype are identified at an FDR of 10% relative to regression models trained on randomized data. The plot of aggregate error changes for the proneural subtype is shown. (B) Gene sets associated with each candidate regulator are determined similarly by excluding the regulator from regression models and identifying genes whose squared error across samples increases (using an FDR of 10%). The distribution of gene expression changes is shown for all genes, all targets based on motif hits, and the gene set for GABP, a candidate regulator of proneural subtype, across TCGA proneural tumors. GABP motif-based targets are significantly upregulated compared with all genes (P<6.8e−8, Kolmogorov–Smirnov test); GABP’s gene set is more strongly upregulated than the motif-based targets (P<2.2e−16) in both training samples and held-out test samples. (C) The model coefficients of miR-132, a proneural-specific candidate regulator, are predictive of survival in the proneural GBM subtype. Patients with high model coefficient (>55th percentile) show a significantly higher median survival time compared with patients with low model coefficient (<45th percentile; P<7e−4, log-rank test). (D) Venn diagram showing the candidate regulators across classical, mesenchymal, and proneural subtypes. Regulators with target upregulation are shown in brown and with target downregulation in blue. A number of regulators are common for all subtypes, while there are no candidate regulators specific to the proneural and mesenchymal subtypes alone.
Similarly, we can use feature dependency analysis to assign target gene sets to each candidate regulator. As input to the model, each TF or miRNA regulator has an initial motif-based target set of genes, based on binding site hits in the promoter or 3′UTR, respectively. However, these initial motif-based target assignments are noisy and not context specific; a more confident target gene set can be determined by identifying genes for which the model error increases when the regulator is removed. As before, a significance threshold was estimated based on the total error changes for individual genes across randomized regression models when a regulator is removed (see Materials and methods), and we assigned target gene sets to regulators using an FDR threshold of 10%.
Figure 3B shows the distribution of proneural tumor expression changes for the motif-based targets of GABP and the gene set of GABP as determined by feature dependency analysis of the model, both across proneural training samples and test samples, as compared with the full set of genes. While the motif-based targets of GABP, a significant regulator common to all three subtypes, are upregulated across both training and test samples, the upregulation of the computed gene set is much more significant in both the training and test sets (P<2.2e−16, Kolmogorov–Smirnov test). The gene sets associated with all the regulators are listed in Supplementary Table 4. To investigate the stability of specific inferred regulator/target pairs, we can examine distribution of regulator coefficients over tumor samples as well as the resulting change in error for a specific target when the regulator is removed from the model. For example, while there is variability of miR-132’s regression coefficients within each subtype, the coefficient values are consistently higher in the proneural subtype and correlate with regulation of inferred target SOX11 (Supplementary Figure 5A). Similarly, REST is identified as a common regulator but has largest negative regression coefficients in the mesenchymal subtype, tracking with stronger inferred regulation of SST (Supplementary Figure 5B). A summary of the model coefficients across all subtypes has been tabulated in Supplementary Table 5.
Interestingly, we found that the inferred dysregulation of miR-132, a proneural-specific candidate regulator, correlates with survival in the proneural subtype. Patients inferred to have high model coefficients for miR-132 (>55th percentile) show a significantly higher median survival time compared with patients with low miR-132 model coefficients (<45th percentile) in the joint model (P<7e−4, log-rank test; Figure 3C). Moreover, a similar analysis based on miR-132 expression instead of miR-132 regulation does not show a significant difference in survival (P<0.1, log-rank test; Supplementary Figure 6A). The G-CIMP phenotype, which is enriched in the proneural subtype, is also associated with higher survival. In order to determine if the miR-132-related survival difference coincides with G-CIMP status, we trained regression models on all proneural samples, including those in the test set. We did not find a significant difference between miR-132 model coefficients between G-CIMP and non-G-CIMP proneural samples (P<0.47, Wilcoxon rank-sum test). However, we confirmed that miR-132 retains its predictive value for survival in this larger data set (P<0.02, log-rank test). We also performed a similar analysis on an independent data set (Murat et al, 2008). This data set profiles only gene expression and not copy numbers or miRNA expression. Moreover, the data set is smaller in size (N=80), which limits the power of survival analysis. We classified the patients in this data set to proneural, mesenchymal, and classical subtypes using the gene signature defined in Verhaak et al (2010) (Materials and methods; Supplementary Table 6) and ran our sample-by-sample regression models for each patient. We observe that proneural patients with high miR-132 model coefficient showed a trend toward better survival (Supplementary Figure 6B), recovering a pattern observed in the training and test TCGA data sets, though the survival difference was not statistically significant. It should be noted that TCGA proneural patients show a significantly higher survival compared with other subtypes (Supplementary Figure 6C), but the corresponding survival difference was not statistically significant in the Murat data set (Supplementary Figure 6D).
Figure 3D summarizes the key shared and subtype-specific regulators satisfying a 10% FDR cutoff for the proneural versus mesenchymal subtypes identified by our analysis; no significant regulators were found to be specific to the classical subtype alone (Supplementary Figure 7). Regulators that are shared among all three subtypes are considered as common regulators and include REST, known to be upregulated in brain tumors (Majumder, 2006); E2F factors, regulators of cell cycle and part of the Rb pathway (Polager and Ginsberg, 2009); and miR-124 that is downregulated in GBM (Silber et al, 2008). Some of the proneural-specific regulators include YY1, a driver of oligodendrocyte differentiation (He et al, 2007); SP1, a transcriptional regulator implicated in cell growth, apoptosis, and differentiation (Li and Davie, 2010); and miR-19, which has been observed as upregulated in gliomas (Malzkorn et al, 2010). CEPB, which was previously described as a regulator of mesenchymal transformation in human gliomas (Carro et al, 2010), is inferred as a mesenchymal-specific regulator. We note that using the group lasso model in place of the sample-by-sample lasso approach leads to reduction in the number of regulators identified by feature dependency analysis (Supplementary Figure 4C). Therefore, incorporating subtype assignments improves the consistency of the regulatory models to identify a smaller set of confident regulators.
Gene sets for proneural regulators display coherent functions and are consistent with in vivo expression changes in mouse PDGF-driven tumors
Our reference normal brain samples from TCGA are not ideal for modeling cancer-specific expression changes, since they are composed of cells of multiple lineages while the tumors are derived from glial cells. We next addressed this issue directly through analysis of in vivo expression changes in a mouse model of PDGF-driven tumors. This experimental system allows us to sort for the relevant tumor and normal cell populations for a clean comparison of in vivo expression changes.
Evidence from expression analysis of human proneural tumors and tumors from mouse models of PDGF-driven GBM suggests that proneural tumors arise from oligodendrocyte progenitor cells (OPCs) or from other glial precursors that then acquire OPC markers (Verhaak et al, 2010). To examine the candidate proneural regulators and corresponding target gene sets derived from GBM tumor data in a cleaner experimental setting, we examined expression data in relevant cell populations extracted from tumors and normal tissue in a mouse model. Specifically, we assessed whether human gene set expression patterns of differential regulation were consistent with in vivo expression changes of their mouse homologs in PDGF-driven, Olig2+ mouse tumor cells relative to mouse OPCs.
For example, Figure 4A shows the cumulative distribution of expression changes in PDGF-driven mouse tumor cells relative to OPCs for predicted targets of E2F, a candidate transcriptional regulator (or rather, set of regulators sharing a motif) common to all GBM subtypes. E2F is associated with upregulation of its targets in our regulatory model, and consistent with this role, we see a significant upregulation of mouse genes homologous to motif-based targets of E2F relative to all genes in the mouse tumor data (P<2e−4, Kolmogorov–Smirnov test). Moreover, consistent with the pattern in human data, mouse genes homologous to the E2F regulated gene set are even more strongly upregulated than the motif-based target set (P<4.5e−12, Kolmogorov–Smirnov test). This gene set is significantly enriched for genes involved in DNA replication and chromatin organization, consistent with the known role of some E2F TFs (Polager and Ginsberg, 2009). Therefore, the computational model together with the concordance of expression patterns suggests that E2F-mediated upregulation of genes involved in DNA replication and chromatin organization is a shared process in human proneural and mouse PDGF-driven tumors. Similarly, expression changes in mouse tumors cells support the predicted dysregulation of the TF SP1 in proneural GBM (Figure 4B). Orthologs of the motif-based targets of SP1 are significantly downregulated in PDGF-driven tumor cells (P<3.5e−4, Kolmogorov–Smirnov test), and orthologs of the regulated target set of SP1, as determined by the model, are strongly downregulated (P<1.2e−9, Kolmogorov–Smirnov test), consistent with model predictions.
Figure 4.

Gene sets for candidate proneural regulators display coherent functional annotations and consistent in vivo expression changes in PDGF-driven mouse tumors. (A) Targets of E2F, a proneural candidate regulator, show significant upregulation in PDGF-driven Olig2+ mouse tumor cells relative to mouse oligodendrocyte progenitor cells (OPCs) (P<2e−4, Kolmogorov–Smirnov test). Upregulation of the proneural E2F gene set is stronger than the motif-based target set (P<4.5e−12). Human genes were mapped to mouse genes using Homologene. (B) Targets of SP1 show significant downregulation in mouse tumor cells relative to OPCs (P<3.5e−4). Downregulation of proneural SP1 gene set is stronger than motif-based target set (P<1.2e−9). (C) The table lists candidate proneural regulators selected at 10% FDR. Functional annotations were determined by looking for overrepresented terms from the Gene Ontology ‘Biological Process’ in gene sets associated with the candidate regulator. Regulators concordant with PDGF-driven Olig2+ mouse tumor data are shown with rows highlighted in brown. Proneural regulators are ranked by their significance in the regression model, assessed by empirical P-values relative to the previously described randomized models and corrected for multiple-hypothesis testing using the Benjamini-Hochberg procedure.
Figure 4C summarizes the enriched functional annotations for the gene sets of all proneural TFs and miRNAs (see Supplementary Table 7 for ontologies associated with other subtypes) as well as the concordance of their expression changes in human and mouse tumors. Interestingly, several regulators including YY1, E2F, and MYBL2 have annotations associated with DNA replication, chromatin organization, and RNA metabolism, which may be related to cell cycle and growth. Almost all of the most significant proneural regulators (10/13) have gene sets with consistent patterns of differential regulation in human and mouse tumor data (highlighted rows in Figure 4C and Supplementary Table 8).
Overexpression of miR-124 and miR-132 in neurospheres drives expression changes concordant with their dysregulation in proneural tumors
Our regression modeling identified a number of common and proneural-specific miRNAs as statistically significant regulators of tumor expression changes, meaning that the presence of conserved binding sites for these miRNAs in the 3′UTRs of genes appears as consistent explanatory variables for gene differential expression across tumors. To confirm that dysregulation of these miRNAs indeed drive expression changes consistent with those observed in tumors, we tested two candidate proneural miRNA regulators by overexpressing them in PDGFRA-amplified neurospheres (Materials and methods), an in vitro model for the proneural subtype. These candidates were miR-124, predicted as a direct regulator of tumor expression changes across all subtypes; and miR-132, identified as a proneural-specific candidate regulator whose regression coefficient correlates with better survival (Figure 3C).
Both miR-124 and miR-132 are underexpressed in proneural tumors relative to normal brain tissue. Therefore, if they are important drivers of expression, we expect that their overexpression in neurospheres would lead to repression of target genes that are upregulated in tumors, and through secondary effects, upregulation of genes that are downregulated in tumors. As controls, we tested two miRNAs, miR-380 and miR-448, that are underexpressed in proneural tumors but not selected in our regression models. These controls directly test the value of integrative modeling: our model predicts that although these miRNAs are differentially expressed in GBM, they do not explain differential expression of their target mRNAs and therefore are unlikely to drive expression changes in tumors. Finally, we also tested miR-433, a less confident candidate regulator that was selected in the sample-by-sample lasso approach for some proneural tumors but did not pass the FDR cutoff in the group lasso approach. We verified the efficiency of all the miRNA transfections—both the predicted driver miRNAs and control miRNAs—by qPCR, and we further confirmed in all cases that predicted miRNA targets were significantly downregulated 24 h after transfection (Supplementary Figure 8). In particular, this analysis rules out the possibility that our target prediction method was less accurate for the control miRNAs than for miR-124 and miR-132.
We then used the expression changes from the tumorsphere experiments as experimentally defined signatures for direct and secondary effects of the miRNAs, and we asked whether proneural tumor versus normal expression changes reflected these signatures. Figure 5A demonstrates the concordance of expression changes induced by overexpression of miR-124, a candidate regulator common to all GBM subtypes, in proneural neurospheres with expression changes in proneural tumors versus normal brain. The plot shows the cumulative distributions of expression changes across proneural TCGA samples for (i) predicted targets of miR-124 that are downregulated (FDR-corrected P<0.05) in neurospheres after miR-124 transfection; and (ii) genes that are upregulated in neurospheres after miR-124 transfection (FDR-corrected P<0.05). We filtered for computationally predicted targets in group (i) in order to get a signature for direct miRNA regulation; meanwhile, group (ii) serves as a signature for secondary effects of miRNA regulation. As expected, we see concordance of expression changes, that is, both gene sets strongly shift in expression in the tumor data in the opposite direction from the neurosphere data (P<0.01, Kolmogorov–Smirnov test; Supplementary Table 9). Therefore, overexpression of miR-124 appears to partially reverse expression changes seen in proneural GBM samples. Figure 5B shows a similar concordance between expression changes following miR-132 overexpression in neurospheres and proneural tumor data: predicted miR-132 targets that are downregulated in the transfection experiment are upregulated in proneural TCGA samples (P<0.01); and genes that are upregulated post-transfections are downregulated in the proneural tumor data (P<0.01).
Figure 5.
Overexpression of candidate proneural miRNAs in neurospheres drives expression changes consistent with their predicted role in tumors. (A) Expression changes after miR-124 overexpression in a proneural (PDGFRA-amplified) neurosphere were concordant with miR-124 associated tumor versus normal expression changes, where miR-124 is underexpressed. Targets of miR-124 that were downregulated in the neurosphere model and genes those were upregulated after miR-124 transfection are upregulated and downregulated, respectively, in TCGA proneural samples. These results suggest that overexpression of miR-124 in neurospheres partially reverses the expression changes in proneural tumors. (B) miR-132 also shows expression concordance in proneural tumors and miR-132 overexpression in neurospheres. (C) Common regulator miR-124 and proneural-specific regulator miR-132 show concordant gene expression changes between transfection in neurosphere and TCGA proneural samples. Two control microRNAs (miR-380 and miR-448), both downregulated in proneural samples but not selected in the regression analysis, do not show this concordance. A final tested miRNA, miR-443, was downregulated in proneural samples and chosen as a regulator by sample-based regression models but not the group lasso method and does not show significant concordance between expression changes (Supplementary Table 9). (D) Cell proliferation analysis demonstrates a significant decrease in number of cells in S phase and significant increase in number of cells in G0/G1 phase in miR-124 transfection compared with negative controls. These results are consistent with gene ontology analysis of miR-124 transfection data. Values represent mean±standard deviation of three replicate experiments (*P<2e−5, t-test). (E) Examination of identified regulators and existing literature suggests a proneural-specific core regulatory network. REST, a repressor of neural genes in non-neuronal cells, is known to be upregulated in brain tumors. YY1, inferred as an activator in proneural tumors, is a known activator of REST. Upregulation of REST may lead to downregulation of the miRNAs miR-124 (a predicted regulator in all subtypes) and miR-132 (a predicted regulator specific to proneural subtype). Downregulation of miR-124 and miR-132 may contribute to inhibition of differentiation and proliferation in tumors. Source data is available for this figure in the Supplementary Information.

Figure 5C summarizes the concordance between miRNA overexpression experiments and TCGA proneural tumor data (see Supplementary Figure 9 and Supplementary Table 9). Both predicted proneural regulators, miR-124 and miR-132, show full concordance between neurosphere and proneural tumor data. By contrast, overexpressing the control miRNAs (miR-380 and miR-448) did not lead to similar concordance with expression patterns in proneural tumors: (i) for both controls, downregulated targets of the control miRNAs were not significantly upregulated in the tumor data; and (ii) genes upregulated after transfection of the control miRNAs were either not significantly downregulated in proneural tumors (miR-380) or these genes were more significantly upregulated in proneural tumors than downregulated (miR-448). In other words, overexpression of these control miRNAs leads to gene expression changes that appear to be poorly related to differential expression patterns in proneural tumors (Supplementary Table 9). The less confidently predicted regulator, miR-433, which was identified by feature dependency analysis in the sample-by-sample models but not in the group model, did not show strong concordance (using threshold of P<0.01, Figure 5C, Supplementary Table 9). As a final check to remove dependence on target prediction in the concordance analysis, we also considered downregulated genes each transfection experiment without filtering for target sites as a signature of miRNA-induced repression (both direct and indirect). Since miRNA transfections lead to very high overexpression of miRNAs and downregulation of a broad set of genes, we took genes that were most strongly downregulated (FDR-corrected P<0.001) in each transfection and found strong concordance with proneural tumor-versus-normal expression changes for miR-124 (P<0.01) and significant concordance for miR-132 and miR-433 (P<0.05) but no concordance for either of the two controls (Supplementary Table 9).
Another intriguing clue about the potential functional relevance of miR-124 and miR-132 was the coherence of gene annotation enrichments for the sets of upregulated and downregulated genes in the transfection experiments. Downregulated genes after overexpression of miR-124 were strongly enriched for DNA replication annotations (P<3e−13, FDR-corrected P-value) and showed significant enrichments for multiple terms associated with cell cycle, cell proliferation, and DNA repair (P<0.05, corrected P-value). In order to verify this experimentally, we performed cell proliferation assays in the neurospheres following miR-124 and miR-132 transfections. Transfection of miR-124 resulted in a significant reduction in number of cells in S phase (P<2e−5, t-test) accompanied by a similarly significant increase in the number of cells in G0/G1 phase (P<2e−5, t-test) compared with negative controls (Figure 5D). No differences were found in G2/M or sub-G1 phase of the cell cycle. By contrast, we do not observe any reproducible changes in cell-cycle phase following the miR-132 transfection (Figure 5D). Representative flow cytometry plots are shown in Supplementary Figure 11. These experimental observations are consistent with functions associated to miR-124 through previous overexpression experiments in glioma cell lines (Silber et al, 2008) and demonstrate the ability of our regression model to uncover key regulators and their associated gene sets.
Genes downregulated after overexpression of miR-132 showed some enrichment for terms associated with regulation of cell growth and cell size (P<0.1, corrected P-value). By contrast, neither control miRNA nor the less confident regulator showed enrichment for any functional terms after correction for multiple hypothesis testing even at a mild significance threshold (P<0.1), suggesting that overexpression of these miRNAs lead to functionally incoherent expression changes and that therefore, although these miRNAs are all underexpressed in proneural tumors, they may not be important for driving tumor-related expression programs.
To determine the most relevant functions of miR-132 for glioma biology, we went back to the TCGA tumor data and asked which genes in the regulated target set for miR-132 and other proneural regulators were specifically dysregulated in the proneural subtype. That is, if the regulator was associated with upregulation (resp. downregulation) of its associated target gene set, we determined which genes were specifically overexpressed (resp. underexpressed) in proneural samples relative to other samples (with P<0.05, corrected P-value). Interestingly, miR-132 along with NFYB and YY1 are the regulators with the greatest degree of proneural specificity, defined as the fraction of genes in their target set that are specifically dysregulated in the proneural subtype (Supplementary Figure 10).
We therefore repeated gene ontology analysis for genes that are downregulated in the miR-132 transfection experiment and also show proneural-specific upregulation in tumor data. This analysis gave a significant enrichment for ontologies related to chromosome organization (P<0.05, corrected P-value). In particular, genes contributing to the gene ontology term ‘chromosome organization’ overlapped with those contributing to the same term in the miR-132 regulated gene set (P<0.031, hypergeometric test). Restricting the gene ontology analysis to genes upregulated in proneural tumors compared with normal brain showed a similar significance for chromatin-related ontologies (P<0.05, corrected P-value). Notably, genes upregulated after transfection of miR-132 were also significantly enriched for genes involved in DNA packaging, chromatin assembly/disassembly, nucleosome assembly, and other chromatin-related functions (P<0.05, corrected P-value). These enrichments suggest that miR-132 may regulate chromatin state via genes downstream of its direct targets.
Interestingly, the miR-132 regulated gene set includes KDM5A (a histone demethylase) and EP300, which are both involved in epigenetic regulation of gene expression (Lopez-Bigas et al, 2008; Visel et al, 2009) and are validated targets of miR-132 (Alvarez-Saavedra et al, 2011). KDM5A is also marginally downregulated after miR-132 transfection (FDR-corrected P<0.075). To explore the connection between miR-132 and KDM5A further, we derived a motif for KDM5A from ChIP-seq data in human embryonic stem cells (Ram et al, 2011). We confirmed that the top 500 predicted targets of KDM5A are modestly but significantly upregulated in proneural tumors (P<7e−7, Kolmogorov–Smirnov test; Supplementary Figure 12). Therefore, the most relevant functions associated with lowered expression of miR-132 in proneural tumors appear to be related to chromatin remodeling, and expression changes associated with these functions are partially reversed when miR-132 is restored.
Discussion
Model for a core regulatory network in proneural GBM
Our experimental results combined with the existing literature on our predicted proneural regulators suggest a core regulatory network underlying expression changes in proneural GBM where miRNAs miR-124 and miR-132 play key roles (Figure 5E). In the model, the hub of this core network is the REST/CoREST complex. REST is a repressor of neuronal genes in non-neuronal cells and acts as part of a complex that includes CoREST and Sin3 (Andres et al, 1999; Grimes et al, 2000). REST is known to be upregulated in brain tumors (Majumder, 2006) and is identified in our analysis as a common regulator whose targets are downregulated in all subtypes. The transcription factor YY1 is identified as an activator of gene expression in the proneural subtype. YY1 interacts with histone deacetylases to drive oligodendrocytic differentiation (He et al, 2007). YY1 is also a direct regulator of REST (Jiang et al, 2008).
REST is known to downregulate the miRNAs miR-124 and miR-132 (Conaco et al, 2006; Johnson et al, 2008), both of which are identified as regulators in GBM, miR-124 across subtypes and miR-132 in the proneural subtype only. The targets of these miRNAs are predicted to be upregulated in GBM. miR-124 has a feedback loop and downregulates CoREST. CoREST along with PTBP1, LAMC1, SCP1, and CDK4 are all included in the target gene set associated with miR-124 by our model. Previous studies have established that the loss of miR-124 regulation (i) of CoREST and SCP1 enhances REST complex function; (ii) of CDK4, a member of cyclin-dependent kinases, leads to cell-cycle progression; and (iii) of PTBP1 leads to differentiation inhibition (Makeyev et al, 2007). PTBP1, LAMC1, and SCP1 are validated targets of miR-124 (Visvanathan et al, 2007).
Similarly, the target gene set for miR-132 also includes validated targets SOX2, LIN28, along with KDM5A and EP300. SOX2 and LIN28 are important stem cell factors (Marson et al, 2008). Evidence suggests that inhibition of SOX2 leads to reduced growth in glioma cell lines (Gangemi et al, 2009). Therefore, in this core network model for the proneural subtype, overexpression of REST, due in part to transcriptional upregulation by YY1, leads both to proliferation and inhibition of differentiation via downregulation of miR-124 and to expression of stem cell factors and epigenetic changes via downregulation of miR-132.
miRNAs with incoherent target regulation in GBM and development
Our regression modeling filters for miRNAs that are differentially expressed in GBM subtypes relative to normal tissue but does not require that the inferred regression coefficient for a miRNA is coherent with its change in expression. In most cases, our model does in fact identify miRNA regulators with coherent target regulation; for example, both miR-124 and miR-132 are more weakly expressed in tumors relative normal, and coherently, their targets are upregulated.
However, we do identify several miRNAs as significant regulators with incoherent target regulation. The most prominent of these is miR-218, which is downregulated in tumor versus normal while its predicted targets are also significantly downregulated (Supplementary Figure 13). Interestingly, a study of miRNA expression changes in oligodendrocyte development observed that miR-218 is expressed both in the oligodendrocyte lineage and in neuronal cells; however, the expression levels of predicted miR-218 targets display opposite biases in the oligodendrocytes versus neurons (Lau et al, 2008). Namely, in neuronal cells, predicted miR-218 targets are enriched among highly expressed genes (Lau et al, 2008), while in the oligodendrocyte lineage, the target bias is reversed, with miR-218 targets enriched among the most weakly expressed genes. The authors speculate that miR-218 interacts with transcriptional regulatory networks in cell type-specific ways, dampening transcriptionally downregulated genes to reinforce transcriptional programs in oligodendrocytes while fine-tuning gene expression levels (‘buffering transcriptional noise’) in neuronal cells.
Our analysis does not use the notion of target expression bias or directly address the above hypothesis of cell type-specific interaction of miRNAs with transcriptional networks. Instead, we infer the differential activity of miRNAs and TFs based on expression changes of all targets through a sparse regression approach. However, as the tumor samples are composed of glial cells, while our normal brain reference includes glial and neuronal cells, our ‘incoherent’ inferred role for miR-218 may be connected with previous observations about the cell type-specific function of miR-218 in oligodendrocyte versus neuronal cells.
Modeling expression changes versus classification approaches
It is useful to note that our integrated approach does not solve the same problem as a classification approach. In a classification problem, one accepts that the class labels—here, proneural versus classical versus mesenchymal—are valid, and one trains a model that can accurately predict the class from features of one or more kinds of molecular profiling experiments (e.g., mRNA expression levels and microRNA expression levels). It is standard to perform feature selection to extract a smaller number of ‘biomarkers’ that still accurately predict the class label. Typically, many different ‘signatures’ containing different sets of features have similar prediction accuracy, so inclusion of a gene/microRNA in a discriminative signature is no guarantee that this biomarker is intrinsically important to the biology of a subtype. Moreover, in the setting of expression-based cancer subtypes discovered by clustering, we have a problem of circularity: successful discrimination between subtypes mainly shows that whatever (possibly subtle) expression differences the clustering algorithm uses to make cluster assignments can be learned and reproduced by the classifier. We do not know a priori that these expression clusters represent biologically distinct subtypes; they may arise for more mundane reasons, such as degree of stromal contamination.
In our integrated approach, we can ask whether different expression subtypes are biologically distinct in terms of transcriptional and microRNA-mediated regulation. Rather than identifying ‘biomarkers’ that may predict a subtype without necessarily being biologically important, we find microRNAs and TFs that can explain global tumor versus normal changes in gene expression within the subtype. For example, we find strong differences in the gene regulation models for proneural and mesenchymal tumors, but we find that the classical tumors appear to be a mixture of the other subtypes, at least in terms of gene regulation. Moreover, when we encode the three classes in our group lasso approach, we find no microRNA/TF regulators that are unique to the classical subtype. Our results are consistent with a recent meta-analysis of GBM expression subtypes by several pioneers of GBM classification, who argued that the proneural and mesenchymal subtypes are the two meaningful subtypes that are consistent across studies (Huse et al, 2011).
Improved modeling of miRNA-mediated regulation with sparse regression
The typical analysis of parallel miRNA and mRNA profiles from tumor data or normal tissues involves examination of pairwise miRNA-target correlations across samples (Wang and Li, 2009; Nunez-Iglesias et al, 2010). However, looking for pairwise anti-correlation between miRNAs and predicted targets introduces thousands of non-independent statistical tests, making it difficult to avoid false discoveries. Meanwhile, the correlation between a miRNA and its target across samples may be weak due to the simultaneous regulation by other miRNAs and TFs and also to the fact that miRNA-mediated downregulation at the mRNA level is often modest in magnitude.
We have developed a more powerful and principled statistical approach to identify significant miRNAs and their dysregulated gene sets in tumor profiles. In particular, we take statistical advantage of the fact that aberrantly expressed miRNAs can have broad but subtle effects—contributing to relatively small changes in expression for hundreds of genes. By correlating the presence of 3′UTR miRNA binding sites with changes in expression across thousands of genes, our regression approach is able to accurately identify dysregulated miRNAs. Moreover, our framework naturally extends to modeling transcriptional regulation via sequence information in the promoter, and after filtering by DNaseI hypersensitive regions, we find that TF binding information is surprisingly informative. Finally, by imposing sparsity in the regression and sharing information across tumor samples, we improve the stability of our models to determine the most statistically confident dysregulated TFs and miRNAs.
The use of regression and other supervised approaches to correlate with the presence of regulatory sequences with expression changes originated 10 years ago in early motif discovery methods in yeast (Bussemaker et al, 2001; Conlon et al, 2003). These ideas were eventually developed into more ambitious methods for learning transcriptional regulatory programs in yeast, other model organisms, and human cell lines (Segal et al, 2003; Kundaje et al, 2008; Suzuki et al, 2009; Li et al, 2010). In recent computational studies of miRNA-mediated regulation, regression methods have been to improve target prediction by training on genome-wide expression data following miRNA overexpression experiments (Grimson et al, 2007; Betel et al, 2010). Our study is the first to show that the dysregulation of gene expression in human tumors can also be dissected in terms of the effects of regulatory elements, in both promoter sequences and 3′UTRs, by suitably incorporating copy number effects and generalizing the algorithmic approach. Our method provides a flexible integrative framework for cancer genomics. We anticipate that our approach will be broadly applicable to the tumor data sets of growing size and diversity that are currently being generated by worldwide cancer genomics efforts.
Materials and methods
Data and preprocessing
We downloaded all the GBM tumor data from the TCGA data portal (The Cancer Genome Atlas Research Network, 2011). We used affy, a Bioconductor package (Gautier et al, 2004), for RMA background correction and quantile normalization to derive log gene expression values for tumor and normal samples. A similar preprocessing procedure was performed on the miRNA expression data using AgiMicroRna package (Lopez-Romero, 2011).
We used level-2 copy number data and determined copy number segments using circular binary segmentation (Venkatraman and Olshen, 2007). These segments were mapped to Refseq genes based on UCSC hg18 genome assembly.
We used the Murat data set (Murat et al, 2008; GEO accession number GSE7696) for external validation of association of survival with miR-132 model coefficients. Data were processed as described above.
Target prediction for TFs and miRNAs
We determined TFs targets using TRANSFAC (Kel et al, 2003) to search for binding sites within DNaseI HS sites within 2 kb of Refseq transcription start sites. DNaseI HS regions were determined using the DNaseI HS sequencing data from H45 glioblastoma cell line generated by The ENCODE Project Consortium (2004). Raw reads were aligned to hg18 genome assembly using bowtie (Langmead et al, 2009). Hypersensitive regions were determined using MACS peak calling software (Zhang et al, 2008). HS regions present in both of the two replicates were used for TF binding site prediction.
We determined miRNA targets by searching for 7-mer seed matches in the 3′UTR of the Refseq genes. miRNAs were grouped into families if they shared the same seed. We restricted the search to UTR regions conserved between human, mouse, dog, cat, and chicken.
Sample-by-sample lasso regression models
In the sample-by-sample approach, we train regression models separately for each tumor sample, using a linear model to explain log gene expression changes (tumor versus normal tissue) using gene copy number, TF binding site counts in the gene’s promoter, and miRNA binding site counts in the gene’s 3′UTR as covariates in the model.
The lasso regression problem amounts to minimizing the following objective function:
 |
where the first summation is over genes with expression measurements in the sample, and the second summation is the lasso regularization term that encourages most of the regression coefficients wr to be zero; the regularization parameter λ controls the degree of sparsity in the trained model (Tibshirani, 1996). The regression coefficient of each regulator (TF, miRNA) establishes the importance of the corresponding regulatory element for the prediction of gene expression changes, while the sign of the coefficient can be interpreted as the predicted direction of regulation.
Joint learning of regression models with group lasso
To share information across samples and encode subtype information, we used tree-guided group lasso (Kim and Xing, 2010) in a multitask approach for jointly learning regression models for all samples. Samples are mapped into a hierarchy of groups based on subtype, that is, the hierarchy is a tree where leaf nodes correspond to subtype groups and the root node represents the group of all samples (Supplementary Figure 3A). As notation, we write Gv for the group of samples represented by vertex v in the tree. For each regulator r (TF or miRNA), we add an L2-norm constraint over the vector of regression coefficients for r across samples Gv (Supplementary Figure 3B); adding these constraint functions to the regression optimization problem has the effect of grouping these coefficients (Kim and Xing, 2010), that is, encouraging them all to be zero or all to be non-zero. The full group lasso multitask optimization problem can be represented as:
 |
where k indexes the tumor samples, yg,k is the expression change of gene g in sample k, xg,k is the vector of TF and miR binding site counts for gene g and the copy number change of gene g in sample k, v ranges over the set of the four nodes of the tree (Supplementary Figure 3B) and Gv represents the group of samples corresponding to node v. There are now multiple regularization parameters: λ is similar to the regularization parameter for sample-by-sample lasso formulation, while the parameters av represent the strength of correlation within each group. For simplicity, we take av=a for all three subtypes, so that we are left with just three parameters (λ, a, ar) to optimize where ar represents the strength of correlation in the root node; this choice asserts a similar level of model consistency for each of the three subtypes.
Feature dependency analysis
We performed a feature dependency analysis across samples to determine regulators (TFs and miRNAs) that significantly account for common and subtype-specific gene expression changes in the regression models. We use a scoring technique, based on increase in squared loss on samples belonging to a subtype when the regulator is excluded from the learned model, to rank subtype-specific features. The score is calculated as:
 |
where L is squared loss and wr→0 denotes the model vector obtained from w by setting the coefficient wr to 0. This score measures the degree of influence of the regulator in predicting the changes in gene expression.
In order to assess the statistical significance of the feature scores, we also trained the group lasso regression models on randomized data using the same regularization parameters as for the real model. We derived the randomized data by permuting the motif hit over the genes independently for each TF/miRNA. We carried out this group lasso training procedure on randomized data 1000 times and then computed the resulting random score distribution for each subtype. These distributions were used to calculate empirical P-value for each regulator and subtype. We then used a Benjamini-Hochberg procedure to report subtype-specific regulators at a significance threshold corresponding to a 10% false discovery rate.
Associating target gene sets with regulators
The motif hit matrix used as input to the regression models defines a candidate set of associations between regulators and targets. However, even when a TF or miRNA is identified as a significant subtype-specific regulator, we can use a statistical dependency analysis similar to above to determine which of the targets defined by the motif matrix seem to be correctly associated with the regulator. Namely, for each target gene and subtype-specific regulator, we can compute score(r,v,g), as defined above. If removal of the regulator from the model causes an increase in loss, across the subtype samples, for a particular gene, then the gene is more likely to be a true target of the regulator. We use the same randomization models as before, except that we use scores only from the candidate regulator for computing the subtype-specific random score distributions. Using these distributions to estimate empirical P-values as before, we assigned target gene sets to regulators with a 10% false discovery rate. These target sets are used for subsequent gene ontology and pathway analysis.
Classification of test samples
An 840 gene signature has previously been defined to classify tumor expression profiles into four transcriptomic subtypes (Verhaak et al, 2010). We used this signature to train a multi-class SVM on the training data set (161 samples; Supplementary Table 1) using a radial basis kernel function. The expression data were mean centered before training. This SVM model was then used to predict subtypes on both the TCGA test set and the Murat data set.
Gene expression analysis of Olig2+ tumor cells and normal OPCs
Ntv-a/Ink4a/Arf-/-/PTENfl/fl mice, described previously (Hu et al, 2005), were bred with Olig2 bacTRAP mice (Doyle et al, 2008) (gift from Dr Nathaniel Heintz) and gliomas were generated by RCAS-mediated retroviral transduction by a method previously described (Shih et al, 2004). After injection, mice were aged until they demonstrated symptoms of disease (lethargy, weight loss, and macrocephaly). Normal brain OPCs were collected from non-injected 4- to 8-week old Ntv-a/Ink4a/Arf-/-/PTENfl/fl/Olig2-eGFP-L10a mice. Normal brain or grossly dissected tumor tissue was dissociated into a single cell suspension with papain by a method previously described (Bleau et al, 2009) and Olig2+ cells were collected by FACS (Becton-Dickinson Aria Cell Sorter). FACS-sorted cells were collected with Trizol-LS reagent (Invitrogen), chloroform extracted, precipitated with sodium acetate in isopropanol overnight and purified according to manufacturer protocol (Qiagen RNeasy MinElute Cleanup Kit). In all, 200 ng of RNA was amplified and biotin-labeled according to manufacturer protocol (Ambion AMIL1791) and hybridized to Illumina MouseRef-8 v2.0 Expression BeadChips (Rockefeller University Genomics Resource Center). Each biological replicate represents 1 tumor sample or 5 pooled normal brains. All animal studies were done in accordance with protocols approved by the Institutional Animal Care and Use Committee of Memorial Sloan-Kettering Cancer Center and followed National Institutes of Health guidelines for animal welfare. Genotyping primers will be provided on request.
miRNA transfection of glioma neurospheres
The human glioma neurosphere line MSK543 (Ozawa et al, 2010) was seeded at 200 000 cells/ml in 5 ml of neural stem cell (NSC) media plus 10% NSC proliferation supplement (Stem Cell Technologies) additionally supplemented with 10 ng/ml EGF, 20 ng/ml basic FGF, 1 mg/ml heparin. Twenty-four hours after seeding, miRNA mimetics (Thermo Scientific) were mixed with 25 μl HiPerFect Transfection Reagent (Qiagen 301704) in 500 μl Opti-MEM reduced serum media (Invitrogen 31985), incubated for 10 min at room temperature, and added dropwise to the cells (final miR concentration=100 nM). Cells were harvested after 24 h and RNA was collected using the miRNeasy Mini Kit (Qiagen 217004) according to manufacturer instructions. miRNA induction was determined by real-time PCR TaqMan MicroRNA Assays (Applied Biosystems 4427975) according to manufacturer instructions. The miRNA sequences are listed in Supplementary Table 10.
Cell proliferation assay
MSK543 neurosphere cells grown in NeuroCult NS-A media (Stemcell Technologies, Vancouver, BC, Canada) supplemented with 20 ng/ml EGF (Peprotech, Rocky Hill, NJ), 10 ng/ml bFGF (Peprotech), and 0.0002% Heparin were transfected with 100 nM miRIDIAN miRNA hsa-miR-124, hsa-miR-132, negative control #1, or negative control #2 oligonucleotides (Dharmacon, Lafayette, CO) using the HiPerFect Transfection Reagent (Qiagen, Valencia, CA) according to manufacturer’s instructions. Cell-cycle analyses were conducted 48 h post transfection using the fluorescein isothiocyanate BrdU Flow Kit following manufacturer’s recommendations (BD Pharmingen, San Diego, CA).
Determination of differentially expressed genes
Differentially expressed genes and targets in all instances were determined using limma (Diboun et al, 2006). Genes differentially expressed at 5% FDR were used for further analysis.
Gene ontology analysis
We used the GOstats package (Falcon and Gentleman, 2007) for performing gene ontology analysis of target gene sets of candidate regulators and differentially expressed genes in transfection experiments. We used the gene sets from the ‘Biological process’ subset. We did not consider gene sets which have (i) >1000 genes, or (ii) <10 genes or (iii) have only 1 child with the same gene set.
KDM5A target determination
KDM5A ChIP-seq data in human embryonic stem cells were obtained from Ram et al (2011). Raw reads were aligned to hg19 genome assembly using bowtie (Langmead et al, 2009) and KDM5A binding regions were determined using MACS for peak calling (Zhang et al, 2008). We then used MEME (Machanick and Bailey, 2011) to determine binding motif in the top 500 KDM5A binding positions in embryonic stem cells. This motif was then used to score the gene promoters, and the top 500 genes were used for analysis.
Data availability
The neurosphere transfection data have been submitted to Gene Expression Omnibus (http://www.ncbi.nlm.nih.gov/geo/) and can be accessed using the accession number GSE32876. Gene expression data of Olig2+ and OPCs can be accessed using the accession number GSE38591 (http://www.ncbi.nlm.nih.gov/geo/query/acc.cgi?token=nrmfhecakcsomxu&acc=GSE38591). We have also developed an R package that can be used for both sample and group model analysis. The package is hosted at http://cbio.mskcc.org/leslielab/RegulatorInference.
Supplementary Material
Supplementary Figures S1–13, Supplementary Tables S5, S7–10
Supplementary Tables 1–4, 6
Acknowledgments
This work was supported by an award from the Starr Cancer Consortium and by NCI GDAC-B award U24CA143840.
Author contributions: MS helped to develop the computational methods, implemented the algorithms and performed all the computational experiments, analyzed results, and helped to write the paper. KH and JS performed the wet lab experiments. AAK, AA, FN and PA contributed analyses and technical assistance for the computational work. EH and JH supervised the experimental component of the research. CL helped to develop the computational and statistical approach, designed and supervised the computational component of the research, and helped to write the paper.
Footnotes
The authors declare that they have no conflict of interest.
References
- Akavia UD, Litvin O, Kim J, Sanchez-Garcia F, Kotliar D, Causton HC, Pochanard P, Mozes E, Garraway LA, Pe'er D (2010) An integrated approach to uncover drivers of cancer. Cell 143: 1005–1017 [DOI] [PMC free article] [PubMed] [Google Scholar]
- Alvarez-Saavedra M, Antoun G, Yanagiya A, Oliva-Hernandez R, Cornejo-Palma D, Perez-Iratxeta C, Sonenberg N, Cheng HY (2011) miRNA-132 orchestrates chromatin remodeling and translational control of the circadian clock. Hum Mol Genet 20: 731–751 [DOI] [PMC free article] [PubMed] [Google Scholar]
- Andres ME, Burger C, Peral-Rubio MJ, Battaglioli E, Anderson ME, Grimes J, Dallman J, Ballas N, Mandel G (1999) CoREST: a functional corepressor required for regulation of neural-specific gene expression. Proc Natl Acad Sci USA 96: 9873–9878 [DOI] [PMC free article] [PubMed] [Google Scholar]
- Basso K, Margolin AA, Stolovitzky G, Klein U, Dalla-Favera R, Califano A (2005) Reverse engineering of regulatory networks in human B cells. Nat Genet 37: 382–390 [DOI] [PubMed] [Google Scholar]
- Betel D, Koppal A, Agius P, Sander C, Leslie C (2010) Comprehensive modeling of microRNA targets predicts functional non-conserved and non-canonical sites. Genome Biol 11: R90. [DOI] [PMC free article] [PubMed] [Google Scholar]
- Bleau AM, Hambardzumyan D, Ozawa T, Fomchenko EI, Huse JT, Brennan CW, Holland EC (2009) PTEN/PI3K/Akt pathway regulates the side population phenotype and ABCG2 activity in glioma tumor stem-like cells. Cell Stem Cell 4: 226–235 [DOI] [PMC free article] [PubMed] [Google Scholar]
- Bussemaker HJ, Li H, Siggia ED (2001) Regulatory element detection using correlation with expression. Nat Genet 27: 167–171 [DOI] [PubMed] [Google Scholar]
- Carro MS, Lim WK, Alvarez MJ, Bollo RJ, Zhao X, Snyder EY, Sulman EP, Anne SL, Doetsch F, Colman H, Lasorella A, Aldape K, Califano A, Iavarone A (2010) The transcriptional network for mesenchymal transformation of brain tumours. Nature 463: 318–325 [DOI] [PMC free article] [PubMed] [Google Scholar]
- Chan JA, Krichevsky AM, Kosik KS (2005) MicroRNA-21 is an antiapoptotic factor in human glioblastoma cells. Cancer Res 65: 6029–6033 [DOI] [PubMed] [Google Scholar]
- Chiocca EA, Lawler SE (2010) The many functions of microRNAs in glioblastoma. World Neurosurg 73: 598–601 [DOI] [PubMed] [Google Scholar]
- Conaco C, Otto S, Han JJ, Mandel G (2006) Reciprocal actions of REST and a microRNA promote neuronal identity. Proc Natl Acad Sci USA 103: 2422–2427 [DOI] [PMC free article] [PubMed] [Google Scholar]
- Conlon EM, Liu XS, Lieb JD, Liu JS (2003) Integrating regulatory motif discovery and genome-wide expression analysis. Proc Natl Acad Sci USA 100: 3339–3344 [DOI] [PMC free article] [PubMed] [Google Scholar]
- Corsten MF, Miranda R, Kasmieh R, Krichevsky AM, Weissleder R, Shah K (2007) MicroRNA-21 knockdown disrupts glioma growth in vivo and displays synergistic cytotoxicity with neural precursor cell delivered S-TRAIL in human gliomas. Cancer Res 67: 8994–9000 [DOI] [PubMed] [Google Scholar]
- Diboun I, Wernisch L, Orengo CA, Koltzenburg M (2006) Microarray analysis after RNA amplification can detect pronounced differences in gene expression using limma. BMC Genomics 7: 252. [DOI] [PMC free article] [PubMed] [Google Scholar]
- Doyle JP, Dougherty JD, Heiman M, Schmidt EF, Stevens TR, Ma G, Bupp S, Shrestha P, Shah RD, Doughty ML, Gong S, Greengard P, Heintz N (2008) Application of a translational profiling approach for the comparative analysis of CNS cell types. Cell 135: 749–762 [DOI] [PMC free article] [PubMed] [Google Scholar]
- Falcon S, Gentleman R (2007) Using GOstats to test gene lists for GO term association. Bioinformatics 23: 257–258 [DOI] [PubMed] [Google Scholar]
- Gangemi RM, Griffero F, Marubbi D, Perera M, Capra MC, Malatesta P, Ravetti GL, Zona GL, Daga A, Corte G (2009) SOX2 silencing in glioblastoma tumor-initiating cells causes stop of proliferation and loss of tumorigenicity. Stem Cells 27: 40–48 [DOI] [PubMed] [Google Scholar]
- Gautier L, Cope L, Bolstad BM, Irizarry RA (2004) affy—analysis of Affymetrix GeneChip data at the probe level. Bioinformatics 20: 307–315 [DOI] [PubMed] [Google Scholar]
- Godlewski J, Newton HB, Chiocca EA, Lawler SE (2010) MicroRNAs and glioblastoma; the stem cell connection. Cell Death Differ 17: 221–228 [DOI] [PubMed] [Google Scholar]
- Grimes JA, Nielsen SJ, Battaglioli E, Miska EA, Speh JC, Berry DL, Atouf F, Holdener BC, Mandel G, Kouzarides T (2000) The co-repressor mSin3A is a functional component of the REST-CoREST repressor complex. J Biol Chem 275: 9461–9467 [DOI] [PubMed] [Google Scholar]
- Grimson A, Farh KK, Johnston WK, Garrett-Engele P, Lim LP, Bartel DP (2007) MicroRNA targeting specificity in mammals: determinants beyond seed pairing. Mol Cell 27: 91–105 [DOI] [PMC free article] [PubMed] [Google Scholar]
- He Y, Dupree J, Wang J, Sandoval J, Li J, Liu H, Shi Y, Nave KA, Casaccia-Bonnefil P (2007) The transcription factor Yin Yang 1 is essential for oligodendrocyte progenitor differentiation. Neuron 55: 217–230 [DOI] [PMC free article] [PubMed] [Google Scholar]
- Hu X, Pandolfi PP, Li Y, Koutcher JA, Rosenblum M, Holland EC (2005) mTOR promotes survival and astrocytic characteristics induced by Pten/AKT signaling in glioblastoma. Neoplasia 7: 356–368 [DOI] [PMC free article] [PubMed] [Google Scholar]
- Hudson TJ, Anderson W, Artez A, Barker AD, Bell C, Bernabe RR, Bhan MK, Calvo F, Eerola I, Gerhard DS, Gerhard DS, Guttmacher A, Guyer M, Hemsley FM, Jennings JL, Kerr D, Klatt P, Kolar P, Kusada J, Lane DP et al. (2010) International network of cancer genome projects. Nature 464: 993–998 [DOI] [PMC free article] [PubMed] [Google Scholar]
- Huse JT, Phillips HS, Brennan CW (2011) Molecular subclassification of diffuse gliomas: seeing order in the chaos. Glia 59: 1190–1199 [DOI] [PubMed] [Google Scholar]
- Jiang L, Yao M, Shi J, Shen P, Niu G, Fei J (2008) Yin yang 1 directly regulates the transcription of RE-1 silencing transcription factor. J Neurosci Res 86: 1209–1216 [DOI] [PubMed] [Google Scholar]
- Johnson R, Zuccato C, Belyaev ND, Guest DJ, Cattaneo E, Buckley NJ (2008) A microRNA-based gene dysregulation pathway in Huntington's disease. Neurobiol Dis 29: 438–445 [DOI] [PubMed] [Google Scholar]
- Jornsten R, Abenius T, Kling T, Schmidt L, Johansson E, Nordling TE, Nordlander B, Sander C, Gennemark P, Funa K, Nilsson B, Lindahl L, Nelander S (2011) Network modeling of the transcriptional effects of copy number aberrations in glioblastoma. Mol Syst Biol 7: 486. [DOI] [PMC free article] [PubMed] [Google Scholar]
- Kel AE, Gossling E, Reuter I, Cheremushkin E, Kel-Margoulis OV, Wingender E (2003) MATCH: A tool for searching transcription factor binding sites in DNA sequences. Nucleic Acids Res 31: 3576–3579 [DOI] [PMC free article] [PubMed] [Google Scholar]
- Kim S, Xing E (2010) Tree-guided group lasso for multi-task regression with structured sparsity. InProceedings of the 27th International Conference on Machine Learning Fürnkranz J, Joachims T (eds), pp543–550Madison, USA: Omnipress, [Google Scholar]
- Kim TM, Huang W, Park R, Park PJ, Johnson MD (2011) A developmental taxonomy of glioblastoma defined and maintained by MicroRNAs. Cancer Res 71: 3387–3399 [DOI] [PMC free article] [PubMed] [Google Scholar]
- Kundaje A, Xin X, Lan C, Lianoglou S, Zhou M, Zhang L, Leslie C (2008) A predictive model of the oxygen and heme regulatory network in yeast. PLoS Comput Biol 4: e1000224. [DOI] [PMC free article] [PubMed] [Google Scholar]
- Langmead B, Trapnell C, Pop M, Salzberg SL (2009) Ultrafast and memory-efficient alignment of short DNA sequences to the human genome. Genome Biol 10: R25. [DOI] [PMC free article] [PubMed] [Google Scholar]
- Lau P, Verrier JD, Nielsen JA, Johnson KR, Notterpek L, Hudson LD (2008) Identification of dynamically regulated microRNA and mRNA networks in developing oligodendrocytes. J Neurosci 28: 11720–11730 [DOI] [PMC free article] [PubMed] [Google Scholar]
- Li A, Walling J, Ahn S, Kotliarov Y, Su Q, Quezado M, Oberholtzer JC, Park J, Zenklusen JC, Fine HA (2009) Unsupervised analysis of transcriptomic profiles reveals six glioma subtypes. Cancer Res 69: 2091–2099 [DOI] [PMC free article] [PubMed] [Google Scholar]
- Li L, Davie JR (2010) The role of Sp1 and Sp3 in normal and cancer cell biology. Ann Anat 192: 275–283 [DOI] [PubMed] [Google Scholar]
- Li X, Panea C, Wiggins CH, Reinke V, Leslie C (2010) Learning ‘graph-mer’ motifs that predict gene expression trajectories in development. PLoS Comput Biol 6: e1000761. [DOI] [PMC free article] [PubMed] [Google Scholar]
- Lopez-Bigas N, Kisiel TA, Dewaal DC, Holmes KB, Volkert TL, Gupta S, Love J, Murray HL, Young RA, Benevolenskaya EV (2008) Genome-wide analysis of the H3K4 histone demethylase RBP2 reveals a transcriptional program controlling differentiation. Mol Cell 31: 520–530 [DOI] [PMC free article] [PubMed] [Google Scholar]
- Lopez-Romero P (2011) Pre-processing and differential expression analysis of Agilent microRNA arrays using the AgiMicroRna Bioconductor library. BMC Genomics 12: 64. [DOI] [PMC free article] [PubMed] [Google Scholar]
- Machanick P, Bailey TL (2011) MEME-ChIP: motif analysis of large DNA datasets. Bioinformatics 27: 1696–1697 [DOI] [PMC free article] [PubMed] [Google Scholar]
- Majumder S (2006) REST in good times and bad: roles in tumor suppressor and oncogenic activities. Cell Cycle 5: 1929–1935 [DOI] [PubMed] [Google Scholar]
- Makeyev EV, Zhang J, Carrasco MA, Maniatis T (2007) The MicroRNA miR-124 promotes neuronal differentiation by triggering brain-specific alternative pre-mRNA splicing. Mol Cell 27: 435–448 [DOI] [PMC free article] [PubMed] [Google Scholar]
- Malzkorn B, Wolter M, Liesenberg F, Grzendowski M, Stuhler K, Meyer HE, Reifenberger G (2010) Identification and functional characterization of microRNAs involved in the malignant progression of gliomas. Brain Pathol 20: 539–550 [DOI] [PMC free article] [PubMed] [Google Scholar]
- Marson A, Levine SS, Cole MF, Frampton GM, Brambrink T, Johnstone S, Guenther MG, Johnston WK, Wernig M, Newman J, Calabrese JM, Dennis LM, Volkert TL, Gupta S, Love J, Hannett N, Sharp PA, Bartel DP, Jaenisch R, Young RA (2008) Connecting microRNA genes to the core transcriptional regulatory circuitry of embryonic stem cells. Cell 134: 521–533 [DOI] [PMC free article] [PubMed] [Google Scholar]
- Murat A, Migliavacca E, Gorlia T, Lambiv WL, Shay T, Hamou MF, de Tribolet N, Regli L, Wick W, Kouwenhoven MC, Hainfellner JA, Heppner FL, Dietrich PY, Zimmer Y, Cairncross JG, Janzer RC, Domany E, Delorenzi M, Stupp R, Hegi ME (2008) Stem cell-related ‘self-renewal’ signature and high epidermal growth factor receptor expression associated with resistance to concomitant chemoradiotherapy in glioblastoma. J Clin Oncol 26: 3015–3024 [DOI] [PubMed] [Google Scholar]
- Noushmehr H, Weisenberger DJ, Diefes K, Phillips HS, Pujara K, Berman BP, Pan F, Pelloski CE, Sulman EP, Bhat KP, Verhaak RG, Hoadley KA, Hayes DN, Perou CM, Schmidt HK, Ding L, Wilson RK, Van Den Berg D, Shen H, Bengtsson H et al. (2010) Identification of a CpG island methylator phenotype that defines a distinct subgroup of glioma. Cancer Cell 17: 510–522 [DOI] [PMC free article] [PubMed] [Google Scholar]
- Nunez-Iglesias J, Liu CC, Morgan TE, Finch CE, Zhou XJ (2010) Joint genome-wide profiling of miRNA and mRNA expression in Alzheimer's disease cortex reveals altered miRNA regulation. PLoS One 5: e8898. [DOI] [PMC free article] [PubMed] [Google Scholar]
- Ozawa T, Brennan CW, Wang L, Squatrito M, Sasayama T, Nakada M, Huse JT, Pedraza A, Utsuki S, Yasui Y, Tandon A, Fomchenko EI, Oka H, Levine RL, Fujii K, Ladanyi M, Holland EC (2010) PDGFRA gene rearrangements are frequent genetic events in PDGFRA-amplified glioblastomas. Genes Dev 24: 2205–2218 [DOI] [PMC free article] [PubMed] [Google Scholar]
- Phillips HS, Kharbanda S, Chen R, Forrest WF, Soriano RH, Wu TD, Misra A, Nigro JM, Colman H, Soroceanu L, Williams PM, Modrusan Z, Feuerstein BG, Aldape K (2006) Molecular subclasses of high-grade glioma predict prognosis, delineate a pattern of disease progression, and resemble stages in neurogenesis. Cancer Cell 9: 157–173 [DOI] [PubMed] [Google Scholar]
- Polager S, Ginsberg D (2009) p53 and E2f: partners in life and death. Nat Rev Cancer 9: 738–748 [DOI] [PubMed] [Google Scholar]
- Ram O, Goren A, Amit I, Shoresh N, Yosef N, Ernst J, Kellis M, Gymrek M, Issner R, Coyne M, Durham T, Zhang X, Donaghey J, Epstein CB, Regev A, Bernstein BE (2011) Combinatorial patterning of chromatin regulators uncovered by genome-wide location analysis in human cells. Cell 147: 1628–1639 [DOI] [PMC free article] [PubMed] [Google Scholar]
- Segal E, Yelensky R, Koller D (2003) Genome-wide discovery of transcriptional modules from DNA sequence and gene expression. Bioinformatics 19: i273–i282 [DOI] [PubMed] [Google Scholar]
- Shen R, Olshen AB, Ladanyi M (2009) Integrative clustering of multiple genomic data types using a joint latent variable model with application to breast and lung cancer subtype analysis. Bioinformatics 25: 2906–2912 [DOI] [PMC free article] [PubMed] [Google Scholar]
- Shih AH, Dai C, Hu X, Rosenblum MK, Koutcher JA, Holland EC (2004) Dose-dependent effects of platelet-derived growth factor-B on glial tumorigenesis. Cancer Res 64: 4783–4789 [DOI] [PubMed] [Google Scholar]
- Silber J, Lim DA, Petritsch C, Persson AI, Maunakea AK, Yu M, Vandenberg SR, Ginzinger DG, James CD, Costello JF, Bergers G, Weiss WA, Alvarez-Buylla A, Hodgson JG (2008) miR-124 and miR-137 inhibit proliferation of glioblastoma multiforme cells and induce differentiation of brain tumor stem cells. BMC Med 6: 14. [DOI] [PMC free article] [PubMed] [Google Scholar]
- Sumazin P, Yang X, Chiu H, Chung W, Iyer A, Llobet-Navas D, Rajbhandari P, Bansal M, Guarnieri P, Silva J, Califano A (2011) An extensive microRNA-mediated network for RNA-RNA interactions regulates established oncogenic pathways in glioblastoma. Cell 147: 370–381 [DOI] [PMC free article] [PubMed] [Google Scholar]
- Suzuki H, Forrest AR, van Nimwegen E, Daub CO, Balwierz PJ, Irvine KM, Lassmann T, Ravasi T, Hasegawa Y, de Hoon MJ, Katayama S, Schroder K, Carninci P, Tomaru Y, Kanamori-Katayama M, Kubosaki A, Akalin A, Ando Y, Arner E, Asada M et al. (2009) The transcriptional network that controls growth arrest and differentiation in a human myeloid leukemia cell line. Nat Genet 41: 553–562 [DOI] [PMC free article] [PubMed] [Google Scholar]
- The Cancer Genome Atlas Research Network. (2008) Comprehensive genomic characterization defines human glioblastoma genes and core pathways. Nature 455: 1061–1068 [DOI] [PMC free article] [PubMed] [Google Scholar]
- The Cancer Genome Atlas Research Network. (2011) TCGA data portal (https://tcga-data.nci.nih.gov/tcga/) [Google Scholar]
- The ENCODE Project Consortium. (2004) The ENCODE (ENCyclopedia Of DNA Elements) Project. Science 306: 636–640 [DOI] [PubMed] [Google Scholar]
- Tibshirani R (1996) Regression shrinkage and selection via the lasso. J R Stat Soc Series 58: 267–288 [Google Scholar]
- Venkatraman ES, Olshen AB (2007) A faster circular binary segmentation algorithm for the analysis of array CGH data. Bioinformatics 23: 657–663 [DOI] [PubMed] [Google Scholar]
- Verhaak RG, Hoadley KA, Purdom E, Wang V, Qi Y, Wilkerson MD, Miller CR, Ding L, Golub T, Mesirov JP, Alexe G, Lawrence M, O'Kelly M, Tamayo P, Weir BA, Gabriel S, Winckler W, Gupta S, Jakkula L, Feiler HS et al. (2010) Integrated genomic analysis identifies clinically relevant subtypes of glioblastoma characterized by abnormalities in PDGFRA, IDH1, EGFR, and NF1. Cancer Cell 17: 98–110 [DOI] [PMC free article] [PubMed] [Google Scholar]
- Visel A, Blow MJ, Li Z, Zhang T, Akiyama JA, Holt A, Plajzer-Frick I, Shoukry M, Wright C, Chen F, Afzal V, Ren B, Rubin EM, Pennacchio LA (2009) ChIP-seq accurately predicts tissue-specific activity of enhancers. Nature 457: 854–858 [DOI] [PMC free article] [PubMed] [Google Scholar]
- Visvanathan J, Lee S, Lee B, Lee JW, Lee SK (2007) The microRNA miR-124 antagonizes the anti-neural REST/SCP1 pathway during embryonic CNS development. Genes Dev 21: 744–749 [DOI] [PMC free article] [PubMed] [Google Scholar]
- Wang YP, Li KB (2009) Correlation of expression profiles between microRNAs and mRNA targets using NCI-60 data. BMC Genomics 10: 218. [DOI] [PMC free article] [PubMed] [Google Scholar]
- Zhang Y, Liu T, Meyer CA, Eeckhoute J, Johnson DS, Bernstein BE, Nusbaum C, Myers RM, Brown M, Li W, Liu XS (2008) Model-based analysis of ChIP-Seq (MACS). Genome Biol 9 R137. [DOI] [PMC free article] [PubMed] [Google Scholar]
Associated Data
This section collects any data citations, data availability statements, or supplementary materials included in this article.
Supplementary Materials
Supplementary Figures S1–13, Supplementary Tables S5, S7–10
Supplementary Tables 1–4, 6
Data Availability Statement
The neurosphere transfection data have been submitted to Gene Expression Omnibus (http://www.ncbi.nlm.nih.gov/geo/) and can be accessed using the accession number GSE32876. Gene expression data of Olig2+ and OPCs can be accessed using the accession number GSE38591 (http://www.ncbi.nlm.nih.gov/geo/query/acc.cgi?token=nrmfhecakcsomxu&acc=GSE38591). We have also developed an R package that can be used for both sample and group model analysis. The package is hosted at http://cbio.mskcc.org/leslielab/RegulatorInference.