

Abstract
Liver steatosis can be induced by fasting or high-fat diet. We investigated by lipidomic analysis whether such metabolic states are reflected in the lipidome of hepatocyte lipid droplets (LDs) from mice fed normal chow diet (FED), fasted (FAS), or fed a high-fat diet (HFD). LC-MS/MS at levels of lipid species profiles and of lipid molecular species uncovered a FAS phenotype of LD enriched in triacylglycerol (TG) molecular species with very long-chain (VLC)-PUFA residues and an HFD phenotype with less unsaturated TG species in addition to characteristic lipid marker species. Nutritional stress did not result in dramatic structural alterations in diacylglycerol (DG) and phospholipid (PL) classes. Moreover, molecular species of bulk TG and of DG indicated concomitant de novo TG synthesis and lipase-catalyzed degradation to be active in LDs. DG species with VLC-PUFA residues would be preferred precursors for phosphatidylcholine (PC) species, the others for TG molecular species. In addition, molecular species of PL classes fitted the hepatocyte Kennedy and phosphatidylethanolamine methyltransferase pathways. We demonstrate that lipidomic analysis of LDs enables phenotyping of nutritional stress. TG species are best suited for such phenotyping, whereas structural analysis of TG, DG, and PL molecular species provides metabolic insights.
Keywords: lipidomics, mass spectrometry, high-fat diet, fasting, steatosis, principal component analysis
Liver, the central hub for bodily lipid metabolism, accumulates surplus lipids under several pathological conditions, such as obesity, type 2 diabetes, and nonalcoholic fatty liver disease (NAFLD) (1). NAFLD covers the development of steatosis, progression to nonalcoholic steatohepatitis (NASH), and on to chronic liver diseases like cirrhosis, hepatocellular carcinoma, and finally liver failure (2). Hepatic steatosis starts initially with accumulation of triacylglycerols (TGs) in hepatocytes. This abnormal TG accumulation is due either to fasting or increased fat absorption (3), or to decreased hydrolysis (4, 5). Some reports have indicated a significant increase in the TG-to-diacylglycerol (DG) ratio and in the free cholesterol-to-phosphatidylcholines (PCs) ratio when normal human livers are compared to livers with NAFLD (6). Moreover, increased levels of DG may contribute to altered TG levels and of DG-derived phospholipids (PLs), which further leads to progression of NAFLD (7). It is well known that methionine- and choline-deficient diets lead to NASH in rodents (8); such livers have a reduced rate of PC and choline biosynthesis. The decreased ratio of PC to phosphatidylethanolamine (PC/PE) can also affect membrane integrity and leads to progression from steatosis into NASH (9). It is not clear, however, whether a change in the PC/PE ratio initiates steatosis or is the end point of NASH.
Liver is one of the organs that have a division of cellular labor, of which hepatocytes constitute approximately 90% of total cell population. These cells exhibit a high turnover of FAs and transiently store them in the form of TG in lipid droplets (LDs). LDs are enveloped by a PL monolayer, which is decorated by proteins of high importance in lipid metabolism and energy homeostasis (10–13). Hepatocyte LDs are very dynamic; their sizes and numbers reflect physiological and pathological states of organisms. To date, however, no detailed studies on the LD lipidome of hepatocytes have been available.
MS-based lipidomics, combined with bioinformatics approaches, are becoming inevitable tools for better understanding LD and lipid metabolism at systems biology levels (14, 15). These “omics” approaches allow dissection of subcellular organelle lipidomes (16) and identification of LD roles in intracellular lipid traffic (17).
For this work, we postulated that hepatocyte LDs are organelles sensitive to nutritional stress that results in distinct changes in the LD lipidome of mouse hepatocytes. We compared the hepatocyte LD lipidomes of mice fed a normal chow diet (FED) and fasted (FAS) mice on chow diet, as well as mice receiving a high-fat diet (HFD). Subsequently, we isolated hepatocyte LDs and quantitatively analyzed their lipidomes by LC-MS/MS for data acquisition and Lipid Data Analyzer (LDA) for data processing (18, 19). For phenotypic characterization, we determined class profiles of lipid species and of individual lipid molecular species including potential marker species. Furthermore, we analyzed data in regard to metabolic relationships between lipid molecular species in the context of present knowledge of hepatocyte lipid metabolism.
MATERIALS AND METHODS
Collagenase type II was purchased from Worthington Biochemical Corp. (Lakewood, NJ) and Narkodorm from CP-Pharma (Burgdorf, Germany). Cell strainers were obtained from Becton Dickinson GmbH (Heidelberg, Germany). Nitrogen bomb was purchased from Parr Instrument (Moline, IL). Polyvinylidene fluoride membrane was obtained from Pall Life Sciences (Pensacola, FL). Antibodies against perilipin 2 were obtained from Progen Biotechnik (Heidelberg, Germany); all other antibodies were from Cell Signaling Technology, Inc. (Danvers, MA). ECL plus and Hyperfilm™ ECL were from GE Healthcare Europe GmbH (Vienna, Austria). All other chemicals were purchased from either Merck KGaA (Darmstadt, Germany), Sigma-Aldrich (St. Louis, MO), or Roth GmbH and Co.KG. (Karlsruhe, Germany). Lipid standards were obtained from Avanti Polar Lipids, Inc. (Alabaster, AL). InfinityTM Triglycerides Reagent and Pierce® BCA protein assay kit were obtained from Thermo Scientific (Rockford, IL). BODIPY® 493/503 green was purchased from Invitrogen, Inc. (Carlsbad, CA)
Animals, diets, and intervention study
All animal experiments were performed in compliance with the Austrian animal protection law. The mice were housed and handled in accordance with good animal practice as defined by FELASA (www.felasa.eu/guidelines.php). The animal welfare committees of the University of Graz and the national authorities approved all animal experiments. Wild-type male C57BL/6 mice (Jackson Laboratory; Bar Harbor, ME) aged 12 weeks were used in this study. Mice were maintained on a regular light (14 h)/dark(10 h) cycle and fed a standard laboratory chow diet (FED group) or high-fat diet (HFD group) containing 4.5 or 34 wt% fat in the diet, respectively (sniff® Spezialdiäten GmbH, Soest, Germany). FA compositions of the diets are shown in supplementary Table I. The third group of mice was fed a chow diet, but were fasted 14 h prior to euthanasia (FAS group). Starting with 6-week-old animals, the intervention trial was carried out two times under identical conditions. In each of the three groups, three animals were kept for 6 weeks in one cage per group with ad libitum access to food and water. During the intervention period, mice weights were monitored regularly. At the end of the 6 weeks feeding period, animals were euthanized at 8 AM under anesthesia.
Isolation of hepatocytes
Mice were anesthetized subcutaneously with Narkodorm (60 μl/100 g weight) and the abdomen was surgically opened. Primary hepatocytes from livers were isolated according to Riccalton-Banks et al. with modifications (20). Prior to liver perfusion, buffers and collagenase type II solution (20 mg collagenase type II in 100 ml Krebs-Henseleit buffer without SO42 − but containing 0.1 mM CaCl2, 2% BSA) were brought to 37°C. Each liver was perfused via the hepatic portal vein with Krebs-Henseleit buffer without Ca2+ and SO42 − (115 mM NaCl, 25 mM NaHCO3, 5.9 mM KCl, 1.18 mM MgCl2, 1.23 mM NaH2PO4, 6 mM glucose) for 10 min, followed by perfusion with collagenase type II solution. Thereafter, liver was carefully removed and transferred into a Petri dish filled with 5 ml collagenase type II solution, cut into small pieces, and pressed through a household sieve that was finally flushed with ice-cold Krebs-Henseleit buffer containing 1.2 mM Na2SO4 and 1.25 mM CaCl2. The cell suspension obtained was filtrated through a cell strainer (70 µm nylon filter) into a 50 ml Greiner tube. Approximately 20 ml ice-cold DMEM was added to the filtrated cell suspension, which was subsequently centrifuged at 50 g in a Beckman CS-6R rotor for 3 min at 4°C. Supernatant containing nonparenchymal cells was aspirated, and the remaining hepatocyte pellet was washed by resuspension of the cell pellet in 20 ml ice-cold Krebs-Henseleit buffer containing 1.2 mM Na2SO4 and 1.25 mM CaCl2 and centrifuged again under the same conditions as were applied before. Hepatocytes obtained in this manner were stored at − 80°C until isolation of LDs.
Confocal laser scanning microscopy of isolated hepatocytes
Microscopy was performed using a Leica SP5 confocal microscope (Leica Microsystems; Mannheim, Germany) with spectral detection and a Leica 63× NA 1.2 water immersion objective (HCX PL APO W CORR CS). Freshly isolated primary hepatocytes in DMEM were incubated with BODIPY® 493/503 for 10 min in a tube to label LD and then transferred onto a microscopic slide. The neutral lipid-specific fluorescence dye was excited at 488 nm and detected in the range of 500–550 nm.
LD isolation from hepatocytes by nitrogen cavitation
Samples of hepatocytes isolated from individual mice were resuspended in disruption buffer (20 mM potassium phosphate, pH 7.4, 250 mM sucrose, 1 mM EDTA, 1 mM PMSF) and kept for 15 min on ice. The cells were lysed by nitrogen cavitation at 800 psi for 10 min (21) using nitrogen bomb, and the resulting homogenate was transferred to a 50 ml Greiner tube and centrifuged at 1,000 g (Beckman CS-6R rotor) for 5 min at 4°C to remove cell debris. The supernatant obtained was transferred to a SW41 ultracentrifuge tube and overlaid with buffer containing 50 mM potassium phosphate, pH 7.4, 100 mM KCl, 1 mM EDTA, and 1 mM PMSF. The centrifugation was carried out at 100,000 g in a Beckman ultracentrifuge (SW41 rotor, Beckman Coulter; Brea, CA) for 1 h at 4°C; LDs were floated in a white band at the top of the tube. Floating LDs were collected into another SW41 tube, overlaid with the same buffer, and centrifuged at the same speed in the Beckman ultracentrifuge (SW41 rotor) for 1 h at 4°C to avoid cytosol contamination. Refloating LDs were collected and used in all further experiments.
Check of isolation procedure
Samples from hepatocyte fractions (homogenate, cytosol, membranes, and LDs) were solubilized in SDS-PAGE sample buffer and separated on 10% SDS-PAGE gel using the Laemmli buffer system (22). Separated proteins were transferred from the gel onto a polyvinylidene fluoride membrane. The membrane was blocked with 10% blotting-grade milk powder in Tris/NaCl/Tween-20 (TBST) and incubated with the respective primary antibodies in 2% milk powder. After incubation, membranes were washed with TBST, followed by incubation with HRP-conjugated secondary antibodies. Then, membranes were washed with TBST, developed with ECL plus for enhanced chemiluminescence, and exposed to X-ray film.
Measurement of total acylglycerols and of proteins present in isolated LDs
The amount of acylglycerols present in isolated LDs was measured using InfinityTM Triglycerides Reagent according to the manufacturer's protocol. LPL, the active enzyme in the kit, hydrolyzes TG, DG, and monoacylglycerol (MG). For sample preparation, the LD fraction (100 µl) was mixed with 100 µl of 0.1% Triton X-100 and sonicated on ice using the Misonix Sonicator 4000 (Misonix, Inc., NY) two times at amplitude 10 for 10 s. Amounts of LD protein were measured by the bicinchoninic acid (BCA) method according to the manufacturer's protocol.
Determination of LD lipid profiles and molecular species by LC-MS/MS
LDs isolated from hepatocytes were measured individually (6 each for FED, FAS, and HFD group) according to the hyphenated approach described by Fauland et al. (18). In brief, samples were spiked with 40 nmol TG 17:0/17:0/17:0 and 400 pmol PC 12:0/12:0 as internal standards, and lipids were extracted with methyl tert-butyl ether according to Matyash et al. (23). Lipid extracts were resuspended in 200 µl CHCl3/MeOH 1:1, and a mix of 45 LIPID MAPS internal standards (see supplementary Table II) was added. Five microliters of spiked samples were injected onto a Thermo 1.9 µm Hypersil GOLD C18, 100 × 1 mm, HPLC column mounted in an Accela HPLC instrument (Thermo Scientific). Solvent A was water with 1% ammonium acetate and 0.1% formic acid, solvent B was acetonitrile/2-propanol 5:2 (v/v) with 1% ammonium acetate and 0.1% formic acid. The gradient ran from 35% to 70% B in 4 min, then to 100% B in another 16 min, and was held there for further 10 min. The flow rate was 250 µl/min.
Lipid MS.
Data acquisition was performed by Fourier Transform-Ion Cyclotron Resonance (FT-ICR-MS) (Linear Trap Quadrupole-Fourier Transform, LTQ-FT; Thermo Scientific) full scans at a resolution of 200,000 and <2 ppm mass accuracy with external calibration. Spray voltage was set to 5,000 V in positive mode and to − 4,500 V in negative mode, capillary voltage to 35 V, and the tube lens was at 120 V. Capillary temperature was set to 250°C. From the FT-ICR-MS preview scan, the four most-abundant m/z values were picked in data-dependent acquisition mode, fragmented in the linear ion trap, and ejected at nominal mass resolution. Normalized collision energy was set to 35%, repeat count was two, and exclusion duration was 60 s. Quantitative analysis of data acquired by the platform described above was carried out by LDA (19). Lipid species are presented in ‰ of total amount of respective lipid class where appropriate for better comparisons. The total amount (1,000‰) was calculated by summing up the quantitative amounts of each lipid species belonging to this lipid class as determined by LS-MS/MS (see supplementary Tables III–X).
Analysis of lipid molecular species.
Constituent FA of phosphatidylserine (PS), PE, PC, DG, and TG species were analyzed in positive MS/MS spectra by respective FA neutral losses. FA composition of lysophosphatidylcholines (LPCs) and sphingomyelins (SMs) was obvious by elemental composition derived from high-resolution MS data and by lipid class-specific fragments (m/z 184). FA composition for phosphatidylinositol (PI) molecular species was elucidated by their carboxylate anions in negative MS/MS spectra. The most-abundant FA fragment or neutral loss in an MS/MS spectrum was normalized to 100% (base peak). Fragments indicative for FA with less than 25% intensity of the base peak were termed minor FA fragments and all others were termed major FA fragments (see supplementary Fig. IA, B). For better manageability, particularly of isobaric species (24, 25), possible combinations predominantly composed of major fragments were considered major molecular species, and possible combinations predominantly composed of minor fragments were considered minor molecular species.
Statistical treatment of data
On the one hand quantitative mass spectrometric data for each lipid species are given in ‰ (or %) relative to total amount of a lipid class and pertain to 1st and 2nd intervention trials, consequently they are means ± SD of 6 animals. Total lipid class amounts were calculated as sum from individual lipid species; the standard deviation of the lipid class is a result of the individual standard deviations of each species determined by the law of error propagation (26). Independent two-sample t-test for equal sample sizes and equal variance was used to assess statistical significance of the observed changes at a level of P < 0.05. This type of calculation was chosen, because it illustrates relative changes in the lipid profile between different statistical groups very well. On the other hand mass spectrometric data for each lipid species in nmol (or µmol) per LD sample are presented as means ± SD (n = 3). These additional values pertain to the second intervention trial and were calculated by LDA based on sets of internal standards for each lipid class as described previously (18, 19). For better comparability, data were normalized to the amount of acylglycerols measured by the TG Kit referred to previously in this section. Principal component analysis (PCA) based on ‰ data (n = 6) was performed in R (27) using the function prcomp with default parameters.
Supplementary information.
Each lipid class was subjected to PCA; paradigmatically shown are analysis of TG and PC class in supplementary Figures II and III, respectively. Detailed lipidomic data elaborated, together with their statistical treatment, are listed in supplementary Tables III–X. Data listed represent quantitative values for lipid species in both their contribution in ‰ or % relative to respective lipid classes, and their absolute contribution in nmol or µmol/g total acylglycerols. These data are complemented with those on lipid molecular species resulting from MS/MS analysis of individual lipid species when sufficient amounts were available. The salient features of this wealth of data are highlighted below.
RESULTS
Suitability of the animal model and quality of isolated LDs
In the two trials conducted, all 18 animals survived. Figure 1A reveals an 80% weight gain of the HFD groups in comparison to chow-fed groups. Microscopic imaging of BODIPY-stained LDs in freshly isolated hepatocytes revealed substantial enhancement of LD sizes and numbers in FAS and HFD samples (Fig. 1B). A subsequent check by Western blotting of hepatocyte fractions demonstrated the exclusive presence of characteristic perilipin 2 in the LD fraction (Fig. 1C). Quantitative enzymatic determination of LD acylglycerols (bulk TG and minor DG) per LD proteins (Fig. 1D) accorded with the imaging picture. The comparison of lipid class compositions presented in Table 1 reveals that the HFD condition led to significant increases of most PL classes; in contrast, DG class is most prominent under FAS conditions, whereas differences of bulk TG class were statistically not significant. Importantly, significant differences were found for PL class composition in total PL extracted from LD and hepatocytes; in either case, PC class predominated (Table 2).
Fig. 1.

Animal model and LD isolation and characterization. A: Body weight increase of male wild-type mice during nutritional intervention. FED, chow diet (control); FAS, fasted for 14 h prior to euthanasia; HFD, high-fat diet applied throughout intervention. Body weights were monitored weekly; data are means ± SD (n = 6). B: Characterization of stained LDs in isolated hepatocytes by confocal laser scanning microscopy. Cells were treated with neutral lipid-specific fluorescence dye BODIPY® 493/503 for 10 min, subjected to microscopy by excitation at 488 nm, and detected between 500 and 550 nm. Transmission images were recorded with differential interference contrast (DIC) optics. C: Western blot of homogenate (H), total membranes (M), cytosol (C), and lipid droplets (LD) from primary hepatocytes. Plin (perilipin) 2 is characteristic for LD. PDI, protein disulfide isomerase is characteristic for ER. D: Amount of LD acylglycerols relative to LD protein found in isolated LDs, determined by enzyme tests (mean values ± SD, n = 6), *P < 0.05.
TABLE 1.
Effect of fasting and HFD feeding on lipid class composition in isolated hepatocyte LDs
| FED | FAS | HFD | |
| Lipid Class | Mol% of lipid class to total lipids |
||
| PS | 0.02 ± 0.002 | 0.02 ± 0.002 | 0.03 ± 0.004a |
| SM | 0.06 ± 0.009 | 0.12 ± 0.02b | 0.15 ± 0.02b |
| PI | 0.21 ± 0.05 | 0.18 ± 0.02 | 0.26 ± 0.04 |
| LPC | 0.13 ± 0.04 | 0.27 ± 0.03b | 0.52 ± 0.09b |
| PE | 0.66 ± 0.09 | 0.83 ± 0.11 | 0.93 ± 0.12a |
| PC | 1.76 ± 0.30 | 2.44 ± 0.30a | 3.65 ± 0.42b |
| DG | 0.60 ± 0.09 | 2.12 ± 0.25b | 1.57 ± 0.20b |
| TG | 96.56 ± 9.98 | 94.02 ± 12.95 | 92.90 ± 12.93 |
Data presented in mol% are calculated from absolute amounts of individual lipid molecular species obtained by LC-MS/MS (see supplementary Tables III to X) and are means ± SD (n = 3). P values refer to comparisons to FED group (aP < 0.05, bP < 0.01).
TABLE 2.
PL class composition present in hepatocyte LDs and in hepatocytes (HEP) from FED animals
| Lipid Class Rel. to Total PL [%] | LD | HEP |
| PI | 8.4 ± 1.14 | 9.2 ± 1.37 |
| PS | 0.42 ± 0.08b | 2.5 ± 0.17 |
| PE | 24.3 ± 3.12 | 30.0 ± 1.22 |
| PC | 60.6 ± 9.81 | 53.2 ± 4.05 |
| LPC | 4.0 ± 1.20a | 0.96 ± 0.09 |
| SM | 2.0 ± 0.31b | 4.2 ± 0.28 |
Data generated from LC-MS/MS measurements are means ± SD (n = 3).
P < 0.05.
P < 0.001.
Nutritional stress causes distinct phenotypes in LD lipidomes
The MS profiling of individual lipid classes relied on our on-line LC-MS/MS platform in combination with LDA (18, 19). This approach permitted quantitative analysis of TG, DG, PL, and SM species, characterized by their numbers of carbon atoms and numbers of double bonds in constituent acyl residues. PL species included those of PC, LPC, PI, PS, and PE classes. Taken together, a total of 204 different lipid species were identified in this study. Our experimental conduct (18) did not aim for phosphatidic acid (PA), cholesterol, and cholesteryl ester (CE) classes, due to methodological considerations and the properties of the biological sample (bulk amounts of TG). Within the detection limits of the method, ether lipids were found. In the following, we present data on TG, DG, and PL species in ‰ relative to total amount of respective lipid class to facilitate recognition of nutritional phenotypes at lipidomic levels.
The TG lipidome of hepatocyte LDs.
Quantitative values in ‰ TG species relative to total amount of TG, identified in profiles of the 18 LD samples, were subjected in a first approach to PCA (see supplementary Fig. IIA). The variance explained by the first two principal components was over 96%, which indicated that the profiles had a high discriminatory power between the FED, FAS and HFD samples. A structural interpretation for this PCA result was obtained by calculation of average chain lengths and average number of double bonds from these quantitative TG species values. The former decreased significantly for both FAS and HFD compared with FED samples, but notably, for the latter FAS increased and HFD decreased with highest significance (***, P < 10 − 6) relative to the FED sample (mean values ± SD, n = 6).
Average chain length: FED, 53.13 ± 0.07; FAS, 52.97 ± 0.01; HFD, 52.88 ± 0.11. Average double bond number: FED, 4.16 ± 0.04; FAS, 4.60 ± 0.06***; HFD, 3.39 ± 0.06***.
The sensitivity and low detection limit attained by the LC-MS method can be appreciated by the identification of 112 TG species presentation ranging from TG 28:0 to 62:15 (see supplementary Fig. IV). In all three sample groups, however, C50 to C56 species predominated (Fig. 2A). Nonetheless, the TG52 series illustrates paradigmatical changes at profile and at lipid molecular species levels (Fig. 2B). Inspection of the heat map shown Fig. 3 in allowed identification of specific TG species patterns over the whole range for the three sample groups. C28 to C46 species were detected mainly in FED samples, whereas species from C50 onward with higher number of double bonds predominated in FAS samples. Of note, under HFD conditions, TG 52:0, 52:1, 54:1, 54:2, and 56:2 became most prominent.
Fig. 2.

Effect of nutritional stress on lipid species profiles and lipid molecular species in hepatocyte LDs of FED (red), FAS (blue), and HFD (yellow) samples. A: The diagram of C50 to C58 TG species illustrates that HFD bars were highest in C50 and C52 species having one to two double bonds. FAS bars were highest in C50 with four and more double bonds and in C52 and C54 with five and more double bonds, in C56 and C58 species having more than nine and ten double bonds, respectively. Data were obtained by LC-MS and are means ± SD (n = 6). B: Profiles of TG 52:1 to 52:6 species and their respective constituent FAs identified by characteristic neutral losses are shown. The comparison of FED, FAS, and HFD samples by LC-MS/MS allows identification of changes at lipid species profiles and at molecular species levels. Main TG structures are presented in bold. In either profile, each lipid species is presented as ‰ relative to amount of total TG species identified. Data are mean ± SD (n = 6).
Fig. 3.

Heat maps of TG and PC species detected in FED, FAS, and HFD samples (n = 6 each group). Colors encoding the rectangular cells are relative to the mean of the three groups of one lipid species; each species in each group is presented as ‰ relative to the respective amount of total TG and PC species identified. If all of the three cells are black and in a row, there is no or little difference in the relative contribution of this lipid species. Red and green correspond to higher and lower relative amounts, respectively. Gray cells represent species not detected. TG: The heat map indicates that LDs from FAS samples contain hardly any lipid species with rather short lengths (C28 to C40 species). In contrast, the FAS group is clearly over-represented in highly unsaturated species that contain long- and very long-chain acyl residues (C50+ species). The HFD group is characterized by higher amounts of species (C52 to C56) having acyl residues of lower unsaturation. PC: This heat map is less clear; nonetheless, in FAS groups C32 and C34 species having two to three double bonds are somewhat enriched; in the HFD group, C38 and C40 species having three to five double bonds are somewhat enriched.
The impact of fasting on TG species in hepatocyte LDs compared with FED control is shown in more detail in Fig. 4A. C40 to C42 species only were decreased, whereas C46 species revealed unusual behavior; those with two and three double bonds became enriched, proportions of those with five and six became lowered. All C48 and C50 species became enriched, and a divide existed for C52 to C62 species. Those with a lower number of double bonds decreased, and those at the high end of double bond numbers increased. The quantitative values given in the legend to Fig. 4A for the sum of TG species having at least one very-long-chain PUFA (VLC-PUFA) bear out the latter statement and the calculation of average double bond numbers presented above. The general response to starving of TGs in hepatocyte LDs appeared to be “save the double bond.” Starving created stress to save particularly VLC-PUFAs by storing them in TG depots in LDs of liver.
Fig. 4.

Effect of fasting and HFD feeding on TG class composition. A: FAS compared with FED samples (n = 6): TG species identified are plotted according to carbon numbers (y axis) and number of double bonds (x axis). Data are based on TG species profiles. Arrows are not drawn to scale; gray arrows, lowered abundance; black arrows, enhanced abundance. Summing up of TG species containing at least one VLC-PUFA resulted in values in ‰ relative to amount of total TG species of 335.9 ± 11.5 for FED, of 427.5 ± 14.0 for FAS, and of 242.8 ± 12.7 for HFD samples. Differences of the latter two with FED sample are highly significant, P < 10 − 3 (n = 6). B: TG molecular species identified in LD lipidomes as potential markers for liver steatosis after high-fat diet feeding (HFD) in comparison to control FED sample. Each species is presented as ‰ relative to amount of total TG species identified. Data are mean ± SD (n = 6); ***P < 0.001.
The HFD administered to the animals contained higher proportions of saturated and monounsaturated FAs, particularly FAs 16:0, 18:0, and 18:1. Thus, it was expected that hepatocyte LDs from steatotic livers of the HFD group would contain enhanced levels of main TG species having saturated and monounsaturated FAs. This was indeed the case; the average number of double bonds decreased from FED to HFD by 0.8, from 4.2 to 3.4 double bonds, mainly due to relative losses of VLC-PUFA residues having four and more double bonds. Concomitantly a total increase of 33.4% of C50–C56 main TG species with one to two double bonds was observed. A case in point were TG 52:1, 52:2, 54:1, 54:2, and 56:2 species, already recognized in the heat map (Fig. 3), that can be considered biomarkers for liver steatosis generally associated with systemic insulin resistance (28), due to their highly significant increases (Fig. 4B).
DG and PL lipidomes of hepatocyte LDs.
PCA scatter plots and heat maps did not indicate significant quantitative changes of main DG species upon fasting and high-fat diet feeding of animals. Only minor DG 18:2_22:6 in FAS samples was drastically reduced, whereas in HFD samples, only major species DG 16:0_18:1 increased significantly, certainly an effect of substantially increased proportions of palmitic and oleic acids in the diet (data not shown).
The nutritional impact on profiles and molecular species in PL classes also produced rather uniform profiles in LDs from FED, HFD, and FAS groups, the exception being the PC class as revealed by heat map (Fig. 3). Contrary to TG molecular species, under FAS conditions, the abundance of PC molecular species having two to four double bonds gained, and those having VLC-PUFA residues decreased. This structural consideration for PC molecular species is also reflected in PCA (see supplementary Fig. IIIA), where principal component 1 located FED between HFD and FAS groups, whereas for TG molecular species, principal component 1 placed FED between the FAS and HFD groups. This provides further support for double bonds being the main structural determinant for PCA of species within a lipid class.
We also observed that HFD feeding produced a significant enhancement of molecular structure 18:0_20:4 in PE and PC classes by concomitant decrease of molecular structures 16:0_18:2. By the same token, LPC 20:4 was significantly enhanced, whereas LPC 16:0 and 18:2 were significantly reduced. This lipid molecular species-based analysis of PE, PC, and LPC classes indicated preferred channeling of arachidonoyl residues from DG toward PL metabolism.
Metabolic relationships between lipid molecular species detected in hepatocyte LDs
Structural analysis of DG and TG molecular species indicates mutual precursor-product relationships.
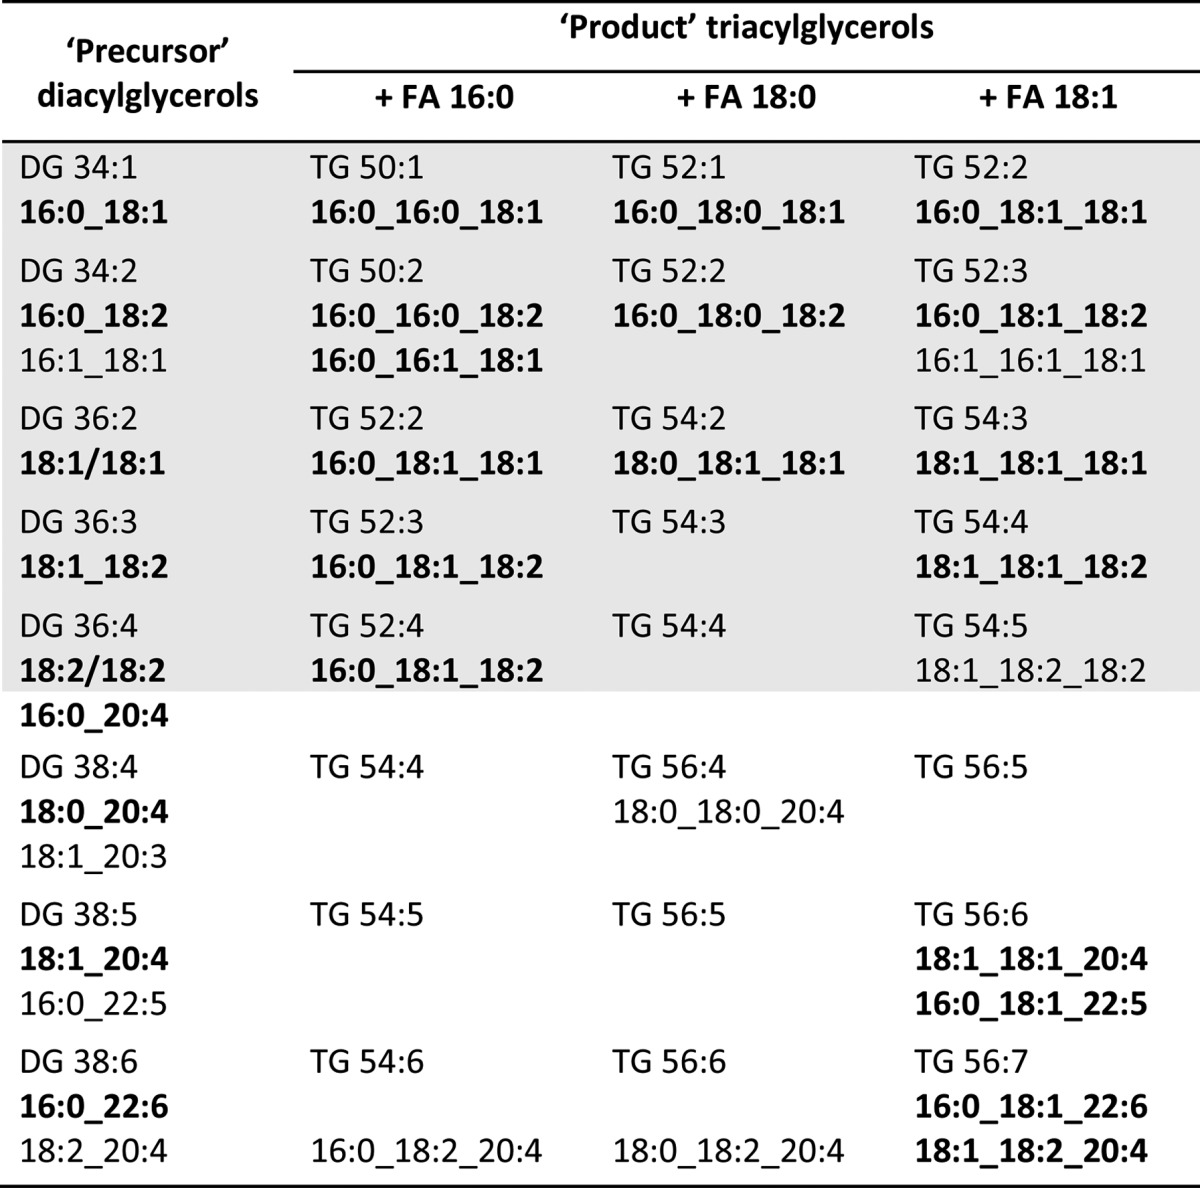
Functionally, concentrations matter; therefore, we base our reasoning on main and minor species in the HFD experiment presented here for mutual DG-TG precursor-product relationships. In the HFD, FA 16:0, 18:0, and 18:1 were by far the most-abundant components compared with control chow diet and led to main DG species (87–88% of total DG species) as shown in Table 3. We complemented them in this table with TG species expected from the surplus of the three FAs, 16:0, 18:0, and 18:1, in the diet. The profiles elaborated indeed demonstrated C34 to C38 DG species and C50 to C56 TG species to be main compounds in either lipid class. Next, we supplemented Table 3 with our DG and TG molecular species data and found remarkable relationships: First, major DG molecular species can be precursors for major TG molecular species or vice versa, considering that DGs could be either substrates for TG synthesis or the products of adipose triglyceride lipase (ATGL)-catalyzed hydrolysis of TG species. Second, saturated, mono-, and diunsaturated acyl residues were preferred substrates for this mutual precursor-product relationship, as highlighted by the shaded areas in Table 3. Moreover, substrate selectivity can be confined to one molecular species only, as found for FA 18:1 between DG 18:1_18:2 and TG 18:1_18:1_18:2. Third, VLC-PUFA residues appeared to be needed elsewhere, inasmuch as such relationships between DG and TG molecular species are not the rule but rather the exception, e.g., for oleic acid between DG 16:0_22:6 and TG 16:0_18:1_22:6.
TABLE 3.
Metabolic relationships between DG and TG molecular species identified in LDs from HFD samples upon administration to animals of HFD containing a huge surplus of FA 16:0, 18:0, and 18:1
Structures of DG and PL molecular species are highly conserved.
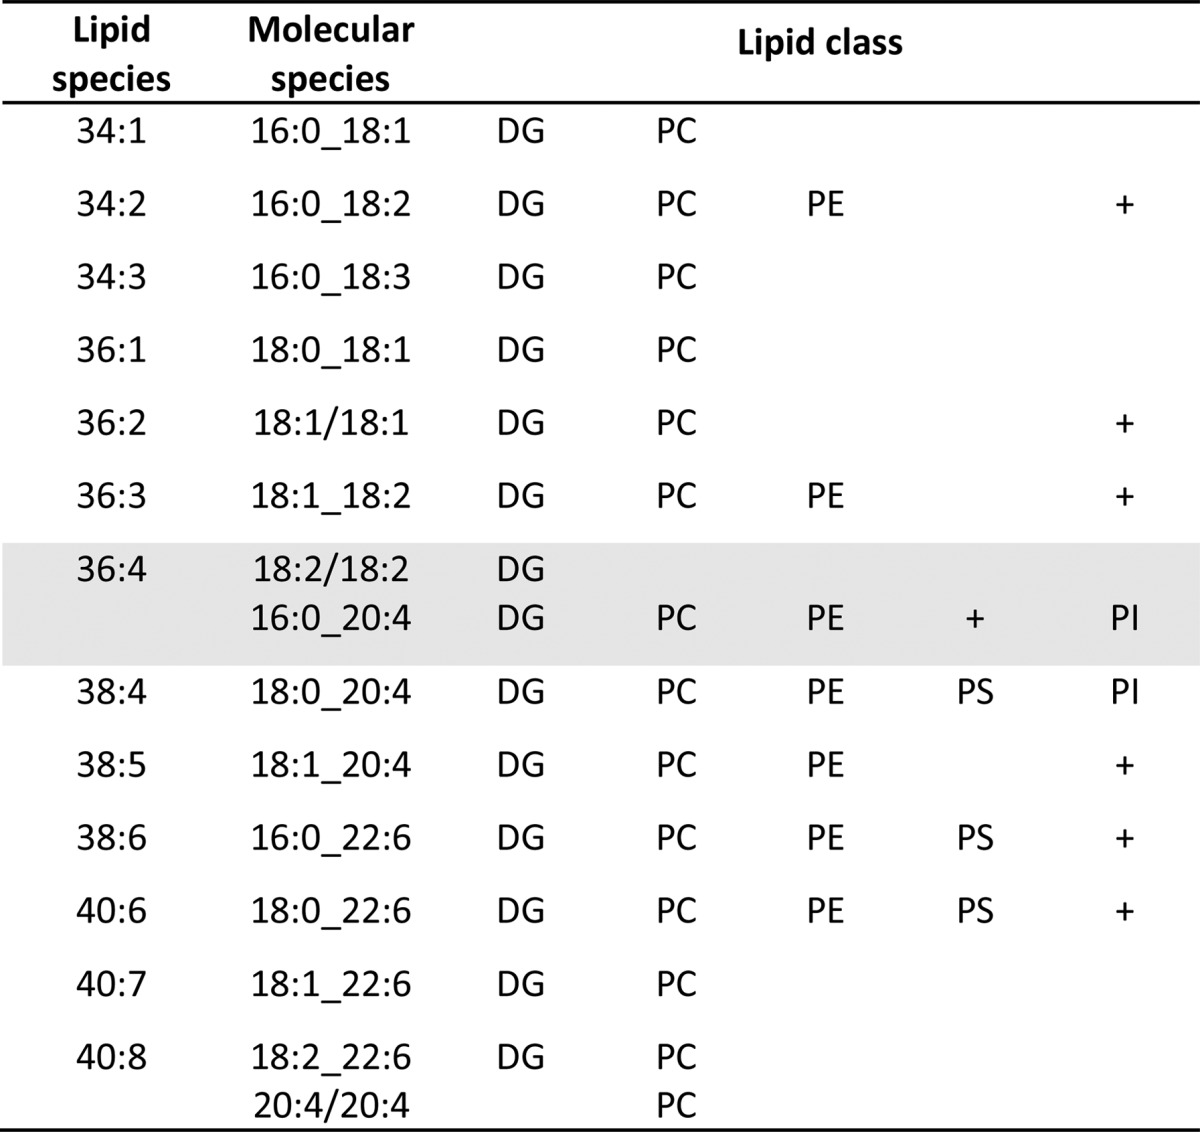
Analysis at molecular species levels revealed that major species in lipid classes containing two constituent acyl residues were conserved in all lipid classes, as illustrated in Table 4. In fact, they were residues of commonly occurring FA in mammalian cells. This finding was valid for FED, FAS, and HFD hepatocyte LDs, which indicated that nutritional regimes did not alter major lipid species structures located at the LD surface. Further, the shaded area in Table 4 illustrates for DG 36:4 species that, according to the Kennedy pathway, DG 18:2/18:2 is not used for PL synthesis, only DG 16:0_20:4. This is in accordance with our preceding conclusion that arachidonoyl residues are preferentially channeled toward PL species. (Underscores in shorthand notation indicate unknown regio-specific position of fatty acyl residues in lipid molecular species.) A peculiar feature was that PI 18:0_20:4 with around 85% of total PI amount was by far the major molecular species independent of nutritional stress applied to the animals. Its molecular structure agreed with that found in respective DG species (Table 4) and allowed the concludsion that precursor PA already contained stearoyl and arachidonoyl residues.
TABLE 4.
Major lipid molecular species (>25% FA neutral loss intensity of FA neutral loss base peak in MS/MS spectra) of DG and PL classes occurring in LDs of FED, FAS, and HFD hepatocytes from mouse liver
Analysis of DG and PC molecular species indicates precursor-product relationships.
PC was the predominant PL class (Tables 1, 2) in the monolayer surrounding the LD hydrophobic core. It was striking to observe that DG and PC species with exactly the same carbon and double-bond numbers predominated in their respective profiles (Fig. 5). Such a relationship was not observed between DG and PE species. Given a common DG pool, PC species with saturated, mono-, and diunsaturated acyl residues were synthesized in substantial amounts. But concentrations of most molecular species having VLC-PUFA residues were higher in the PC class than in the DG class, and subsequent data from MS/MS analysis of both DG and PC molecular species support this biosynthetic path (Table 5). A case in point, highlighted in Fig. 5 and by the shaded area in Table 5, were 36:4 DG and PC species, where molecular structures 18:2_18:2 predominated in DG and 16:0_20:4 in PC. Also in 40:8 DG and PC species, 18:2_22:6 was the prime molecular structure, but in PC only this molecular species was accompanied by 20:4_20:4 molecular species.
Fig. 5.

PE, DG, and PC species profiles and molecular species occurring in FED samples as analyzed by LC-MS/MS. Main species shown reveal resemblance of profiles for DG and PC classes only, whereas molecular structurelevel indicates species containing VLC-PUFA to be preferentially incorporated into PC and PE classes. a Structural analysis in PE class not possible due to low amounts; b found only in DG class in addition to DG 16:0_20:4. Each species is presented as ‰ relative to total amount of identified lipids in the respective lipid class. Data are means ± SD (n = 6).
TABLE 5.
Precursor-product relationships between DG and PC molecular species identified in LDs of FED, FAS, and HFD samples
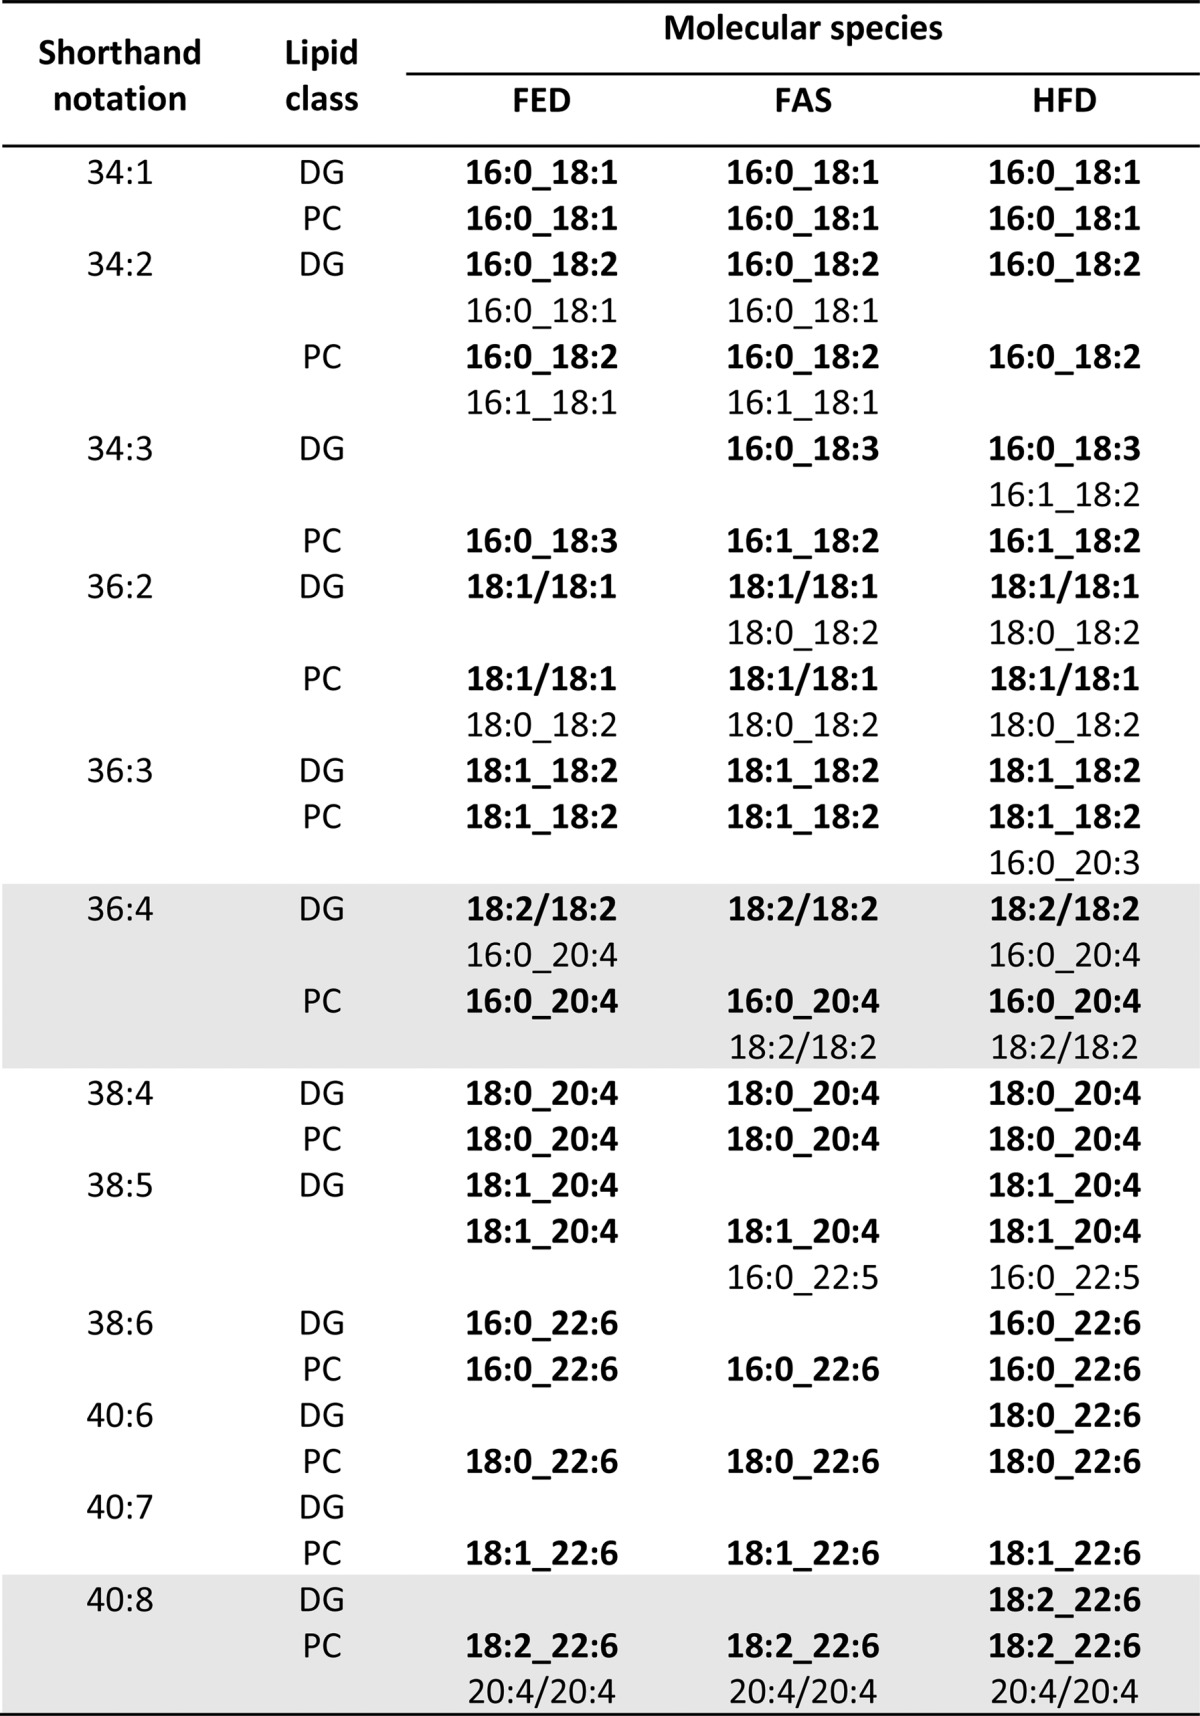
In comparison of FED, FAS, and HFD samples, no differences between the respective major molecular structures of DG and PC species (boldface in Table 5) were detected. Differences in regard to the second-most-prominent molecular structures were observed, but a general rule could not be delineated from this finding.
DG molecular species do not contain two VLC-PUFA residues, but PL molecular species do.
DG in hepatocyte LDs can either be products of PA phosphatase action, or be precursors of TG, but also can be products of TG degradation by ATGL. In addition, they can be either precursors for PC and PE, as discussed above, or vice versa, degradation products of phospholipase C action. As reported in Tables 1, 2, the abundance of the DG class in LDs is low in comparison to bulk TG. LC-MS/MS analyses nonetheless yielded profiles covering 28 DG species in FED, FAS, and HFD samples each. At molecular species levels, VLC-PUFAs were detected from DG 36:4 upwards, but main DG molecules containing two VLC-PUFA residues were not seen (Tables 3–5).
DISCUSSION
The data presented in this study extend the lipidomic scope to LDs and provide compelling evidence for the feasibility of lipidomic phenotyping. We identified TG in the hydrophobic core of LDs to be the class with highest discriminatory power for FED, FAS, and HFD samples, followed by PC present in LD membranes. Cholesterol and CE could also be candidates, but were not analyzed. Yet interestingly, a very recent paper reported that the hydrophobic core of LDs in immortalized hepatic cells consists of either TG or CE species (29). Whether this can be extended to murine hepatocytes is presently unknown.
LDs are centrally involved in cellular TG storage and lipolysis, and in liver, hepatocyte LDs react rapidly to nutritional stress. Remarkably, fasting produced in absolute amounts a 5.1-fold increase of TG in hepatocyte LDs that was also found upon fasting in another mouse model (30). The hallmark signatures for such increases are TG molecular species having VLC-PUFA residues (Figs. 2–4A). Evidence that enhancement of de novo TG synthesis is based on FA mobilized in adipocyte LDs was presented earlier by our laboratory: Under starving conditions, livers from a hormone-sensitive lipase (HSL) knock-out mouse did not accumulate TG, due to reduced FA liberation from adipocytes, normally the tissue of HSL location (31). Intriguingly, a lipidomic study on liver TG species using our animal model in an endurance test (1 h treadmill, 3 h post recovery) found a significant enrichment of TG species having three to ten double bonds in comparison to sedentary behavior (32). This indicates that under fasting conditions or in response to exercise, VLC-PUFAs are selectively retained in LDs, whereas saturated FAs are preferentially used for β -oxidation. Saving of VLC-PUFAs under fasting is probably needed to retain essential building blocks for membrane synthesis or precursors of signaling molecules (33).
Fasting also produced a dramatic increase in absolute amounts of DG over those in the FED sample. This could be due to enhanced TG degradation by ATGL to provide fuel during starvation, particularly of TG molecular species having acyl residues with zero to two double bonds (Table 3, shaded area), fitting the concomitant increase of TG species having a higher number of double bonds, as referred to above.
Interestingly, HFD-induced liver steatosis was characterized by a drastic increase in distinct molecular TG species, which possibly represent marker species for liver steatosis. We also found a decrease in specific TG species with high numbers of double bonds. In accordance with our study, analysis of hepatic TG composition in NAFLD patients revealed a trend for increased saturated and monounsaturated FA, and a significant decrease in VLC-PUFA species (6). There are few other lipidomic studies on assessment of NAFLD. By Time-of-Flight Secondary Ion Mass Spectrometry (TOF-SIMS) imaging in thin sections of steatotic livers from patients, main DG and TG species were detected similar to our LC-MS/MS data (34). Based on a lipidomic approach and a mouse model similar to ours, it was reported that steatotic liver contains particularly enhanced metabolically linked DG and PC species (7). These total liver data on the DG-PC metabolic relationship are comparable to our hepatocyte LD data. Yet, significant differences were found for composition of PL species in normal and steatotic livers, which we did not see for PL species in normal (FED) and steatotic (HFD) LDs. In contrast, our data on DG species agree with those of the liver study. The reason may be that a main fraction of cellular DG is located in LDs. Localization is even more prominent for TG, where LDs are quantitatively and qualitatively by far their foremost harbors, besides some lumenal LD content in the endoplasmic reticulum (ER) (35). Thus, interpretation of TG data is straightforward, and contribution by other cellular structures is not a concern, as is the case for total cellular PL.
The major PL class detected in LDs was PC. Of all phospholipid species detected, only the PC class contained molecular species having solely saturated and monounsaturated acyl groups, in particular PC 16:0_18:1. Moreover, the analysis of PC molecular species revealed some discriminatory power between FED, FAS, and HFD groups, inasmuch as the abundance of distinct PC molecular species was reduced under FAS and HFD conditions. All other PL species of LD membranes had either PUFA or VLC-PUFA residues in addition to a saturated or monounsaturated acyl group.
From the metabolic point of view, our lipidomic data fitted the Kennedy pathway for PL and TG synthesis prevalent in liver, and the phosphatidylethanolamine methyltransferase (PEMT) path for PC synthesis by methylation of PE as well (Table 4, Fig. 5). It is well known that about 30% of PC species are synthesized via methylation of PE species in hepatocytes (9). Keeping this aspect in mind, the comparison of PC and PE molecular species indicated that VLC-PUFA residues are highly preferred substrates for PE acylating enzymes (Fig. 5), and the resulting PE species would be preferred substrates for methylation (36).
A recent study of the LIPID MAPS consortium on subcellular lipidomic profiling reported differences in lipid species composition of organelle membranes from RAW 264.7 cells, a mouse leukemic monocyte macrophage cell line (16). Signaling exerted by RAW 264.7 cell activation had no overall dramatic effect on lipid class composition, except for membrane remodeling by a few lipid species, such as a decrease of species having four and more double bonds, particularly PI 38:4 (PI 18:0_20:4), a foremost signaling species (16). In our study, neither fasting nor HFD affected its proportion within the PI class; also, its molecular structure, 18:0_20:4, was not changed, which corresponded to the parent structure of PI signaling in mammals (37). Interestingly, our lipidomic analysis identified this characteristic molecular structure in DG 18:0_20:4 (Tables 3–5), a known activator of some PKC isoforms, including those found in nuclei (38). The immediate precursor of this signaling DG molecular species is PIP2 (4 ′ , 5 ′ ) 18:0_20:4, not yet detected in LD monolayers.
It was reported recently that PC from the ER in Drosophila S2 cells and RAW 264.7 cells was involved in formation of the PL monolayer of growing LDs (39). On the one hand, this process is assumed to occur at the ER for LD birth; on the other hand, it was visualized recently in our laboratory by Coherent Anti-Stokes Raman Scattering (CARS) microscopy that in mouse adipocytes, larger LDs swallow smaller ones (40). As the surface-to-volume ratio shrinks in any LD fusion process (calculation in absolute amounts of PC/TG ratios in our study conforms to this), surplus PCs are produced. In growing hepatocyte LDs, as a result of fasting or HFD, such surplus PC would not compensate for the demand for more PC needed in de novo LD synthesis, as indicated by the findings in this study.
Our data on TG and DG molecular species provide insights in the context of simultaneous lipogenesis and lipolysis going on in hepatocyte LDs (41, 42). The role of DG stereochemistry is a caveat to be discussed, however, inasmuch as the analytical method employed did not resolve positions of acyl residues on the DG glycerol backbone. It is well established that all DG molecular species becoming part of PC molecular species must have the sn-1,2 configuration. Understanding precursor-product relationships of DG with TG and vice versa is more complicated, however. De novo synthesis of DG from PA generates sn-1,2 DG, whereas degradation of TG by ATGL action produces sn-2,3 and sn-1,3 DG (43). Therefore, it currently remains elusive whether there is a preferred direction in the DG-TG relationship, or if both directions occur equally. TLC of DG isolated from LDs revealed that sn-1,3 DG species are present apart from sn-1,2/sn-2,3 DG species (data not shown). This demonstrated that hydrolysis of TG is a factor within these metabolic relationships and complements adipocyte LD data derived from CARS microscopy (38). Our findings also indicate that DG species having VLC-PUFA residues were not preferred substrates for DG-TG metabolic relationships (Table 4), but rather the metabolic link to phospholipid metabolism (Table 5).
We have demonstrated in this first report on lipidomic analysis of hepatocyte LDs that LC-coupled MS enabled phenotyping nutritional stress. TG species and molecular species provided the lipidome best suited for phenotyping hepatocytes and liver steatosis. In addition, quantitative determination and structural analysis of acylglycerol and PL molecular species furnished metabolic insights.
Supplementary Material
Footnotes
Abbreviations:
- ATGL
- adipose triglyceride lipase
- CE
- cholesteryl ester
- DG
- diacylglycerol
- ER
- endoplasmic reticulum
- FAS
- fasted
- FED
- fed a normal chow diet
- HFD
- high-fat diet
- HSL
- hormone-sensitive lipase
- LD
- lipid droplet
- LDA
- Lipid Data Analyzer
- LPC
- lysophosphatidylcholine
- MCFA
- medium-chain fatty acid
- MG
- monoacylglycerol
- NAFLD
- nonalcoholic fatty liver disease
- NASH
- nonalcoholic steatohepatitis
- PA
- phosphatidic acid
- PC
- phosphatidylcholine
- PCA
- principal component analysis
- PE
- phosphatidylethanolamine
- PI
- phosphatidylinositol
- PL
- phospholipid
- PS
- phosphatidylserine
- TBST
- Tris/NaCl/Tween-20
- TG
- triacylglycerol
- VLC-PUFA
- very-long-chain PUFA
The research leading to these results has received funding from the European Community's Seventh Framework Program (FP7/2007-2013) under grant agreement no. 202272, by the Austrian Ministry of Science and Research GEN-AU project BIN (FFG Grant 820962) and by FWF project Grant Z136, Wittgenstein. The Austrian Centre of Industrial Biotechnology contribution was supported by FFG, bmvit, mvwfi, ZIT, Zukunftsstiftung Tirol and Land Steiermark within the Austrian COMET programme (FFG Grant 824186).
The online version of this article (available at http://www.jlr.org) contains supplementary data in the form of supplementary data in the form of four figures and ten tables.
REFERENCES
- 1.Angulo P. 2002. Nonalcoholic fatty liver disease. N. Engl. J. Med. 346: 1221–1231 [DOI] [PubMed] [Google Scholar]
- 2.Cohen J. C., Horton J. D., Hobbs H. H. 2011. Human fatty liver disease: old questions and new insights. Science. 332: 1519–1523 [DOI] [PMC free article] [PubMed] [Google Scholar]
- 3.Postic C., Girard J. 2008. Contribution of de novo fatty acid synthesis to hepatic steatosis and insulin resistance: lessons from genetically engineered mice. J. Clin. Invest. 118: 829–838 [DOI] [PMC free article] [PubMed] [Google Scholar]
- 4.Hämmerle G., Lass A., Zimmermann R., Gorkiewicz G., Meyer C., Rozman J., Heldmaier G., Maier R., Theussl C., Eder S., et al. 2006. Defective lipolysis and altered energy metabolism in mice lacking adipose triglyceride lipase. Science. 312: 734–737 [DOI] [PubMed] [Google Scholar]
- 5.Ong K. T., Mashek M. T., Bu S. Y., Greenberg A. S., Mashek D. G. 2011. Adipose triglyceride lipase is a major hepatic lipase that regulates triacylglycerol turnover and fatty acid signaling and partitioning. Hepatology. 53: 116–126 [DOI] [PMC free article] [PubMed] [Google Scholar]
- 6.Puri P., Baillie R. A., Wiest M. M., Mirshahi F., Choudhury J., Cheung O., Sargeant C., Contos M. J., Sanyal A. J. 2007. A lipidomic analysis of nonalcoholic fatty liver disease. Hepatology. 46: 1081–1090 [DOI] [PubMed] [Google Scholar]
- 7.Gorden D. L., Ivanova P. T., Myers D. S., McIntyre J. O., VanSaun M. N., Wright J. K., Matrisian L. M., Brown H. A. 2011. Increased diacylglycerols characterize hepatic lipid changes in progression of human nonalcoholic fatty liver disease; comparison to a murine model. PLoS ONE. 6: e22775. [DOI] [PMC free article] [PubMed] [Google Scholar]
- 8.Koteish A., Mae Diehl A. 2002. Animal models of steatohepatitis. Best Pract. Res. Clin. Gastroenterol. 16: 679–690 [DOI] [PubMed] [Google Scholar]
- 9.Li Z., Agellon L. B., Allen T. M., Umeda M., Jewell L., Mason A., Vance D. E. 2006. The ratio of phosphatidylcholine to phosphatidylethanolamine influences membrane integrity and steatohepatitis. Cell Metab. 3: 321–331 [DOI] [PubMed] [Google Scholar]
- 10.Tauchi-Sato K., Ozeki S., Houjou T., Taguchi R., Fujimoto T. 2002. The surface of lipid droplets is a phospholipid monolayer with a unique fatty acid composition. J. Biol. Chem. 277: 44507–44512 [DOI] [PubMed] [Google Scholar]
- 11.Murphy D. J. 2001. The biogenesis and functions of lipid bodies in animals, plants and microorganisms. Prog. Lipid Res. 40: 325–438 [DOI] [PubMed] [Google Scholar]
- 12.Suzuki M., Shinohara Y., Ohsaki Y., Fujimoto T. 2011. Lipid droplets: size matters. J. Electron Microsc. (Tokyo). 60(Suppl.): 101–116 [DOI] [PubMed] [Google Scholar]
- 13.Farese R. V., Jr., Walther T. C. 2009. Lipid droplets finally get a little R-E-S-P-E-C-T. Cell. 139: 855–860 [DOI] [PMC free article] [PubMed] [Google Scholar]
- 14.Harkewicz R., Dennis E. A. 2011. Applications of mass spectrometry to lipids and membranes. Annu. Rev. Biochem. 80: 301–325 [DOI] [PMC free article] [PubMed] [Google Scholar]
- 15.Yetukuri L., Katajamaa M., Medina-Gomez G., Seppanen-Laakso T., Vidal-Puig A., Oresic M. 2007. Bioinformatics strategies for lipidomics analysis: characterization of obesity related hepatic steatosis. BMC Syst. Biol. 1: 12. [DOI] [PMC free article] [PubMed] [Google Scholar]
- 16.Andreyev A. Y., Fahy E., Guan Z., Kelly S., Li X., McDonald J. G., Milne S., Myers D., Park H., Ryan A., et al. 2010. Subcellular organelle lipidomics in TLR-4-activated macrophages. J. Lipid Res. 51: 2785–2797 [DOI] [PMC free article] [PubMed] [Google Scholar]
- 17.Bartz R., Li W. H., Venables B., Zehmer J. K., Roth M. R., Welti R., Anderson R. G., Liu P., Chapman K. D. 2007. Lipidomics reveals that adiposomes store ether lipids and mediate phospholipid traffic. J. Lipid Res. 48: 837–847 [DOI] [PubMed] [Google Scholar]
- 18.Fauland A., Köfeler H., Trötzmüller M., Knopf A., Hartler J., Eberl A., Chitraju C., Lankmayr E., Spener F. 2011. A comprehensive method for lipid profiling by liquid chromatography-ion cyclotron resonance mass spectrometry. J. Lipid Res. 52: 2314–2322 [DOI] [PMC free article] [PubMed] [Google Scholar]
- 19.Hartler J., Trötzmüller M., Chitraju C., Spener F., Köfeler H. C., Thallinger G. G. 2011. Lipid Data Analyzer: unattended identification and quantitation of lipids in LC-MS data. Bioinformatics. 27: 572–577 [DOI] [PubMed] [Google Scholar]
- 20.Riccalton-Banks L., Bhandari R., Fry J., Shakesheff K. M. 2003. A simple method for the simultaneous isolation of stellate cells and hepatocytes from rat liver tissue. Mol. Cell. Biochem. 248: 97–102 [DOI] [PubMed] [Google Scholar]
- 21.Bartz R., Zehmer J. K., Zhu M., Chen Y., Serrero G., Zhao Y., Liu P. 2007. Dynamic activity of lipid droplets: protein phosphorylation and GTP-mediated protein translocation. J. Proteome Res. 6: 3256–3265 [DOI] [PubMed] [Google Scholar]
- 22.Laemmli U. K. 1970. Cleavage of structural proteins during the assembly of the head of bacteriophage T4. Nature. 227: 680–685 [DOI] [PubMed] [Google Scholar]
- 23.Matyash V., Liebisch G., Kurzchalia T. V., Shevchenko A., Schwudke D. 2008. Lipid extraction by methyl-tert-butyl ether for high-throughput lipidomics. J. Lipid Res. 49: 1137–1146 [DOI] [PMC free article] [PubMed] [Google Scholar]
- 24.McAnoy A. M., Wu C. C., Murphy R. C. 2005. Direct qualitative analysis of triacylglycerols by electrospray mass spectrometry using a linear ion trap. J. Am. Soc. Mass Spectrom. 16: 1498–1509 [DOI] [PubMed] [Google Scholar]
- 25.Murphy R. C., James P. F., McAnoy A. M., Krank J., Duchoslav E., Barkley R. M. 2007. Detection of the abundance of diacylglycerol and triacylglycerol molecular species in cells using neutral loss mass spectrometry. Anal. Biochem. 366: 59–70 [DOI] [PMC free article] [PubMed] [Google Scholar]
- 26.Larionov A., Krause A., Miller W. 2005. A standard curve based method for relative real time PCR data processing. BMC Bioinformatics. 6: 62. [DOI] [PMC free article] [PubMed] [Google Scholar]
- 27.Development Core Team R: A Language and Environment for Statistical Computing, R Foundation for Statistical Computing, Vienna, Austria, http://www.R-project.org
- 28.Kraegen E. W., Clark P. W., Jenkins A. B., Daley E. A., Chisholm D. J., Storlien L. H. 1991. Development of muscle insulin resistance after liver insulin resistance in high-fat-fed rats. Diabetes. 40: 1397–1403 [DOI] [PubMed] [Google Scholar]
- 29.Hsieh K., Lee Y. K., Londos C., Raaka B. M., Dalen K. T., Kimmel A. R. 2012. Perilipin family members preferentially sequester to either triacylglycerol- or cholesteryl ester-specific intracellular lipid storage droplets. J. Cell Sci. In press [DOI] [PMC free article] [PubMed] [Google Scholar]
- 30.van Ginneken V., Verhey E., Poelmann R., Ramakers R., van Dijk K. W., Ham L., Voshol P., Havekes L., Van Eck M., van der Greef J. 2007. Metabolomics (liver and blood profiling) in a mouse model in response to fasting: a study of hepatic steatosis. Biochim. Biophys. Acta. 1771: 1263–1270 [DOI] [PubMed] [Google Scholar]
- 31.Hämmerle G., Zimmermann R., Hayn M., Theussl C., Waeg G., Wagner E., Sattler W., Magin T. M., Wagner E. F., Zechner R. 2002. Hormone-sensitive lipase deficiency in mice causes diglyceride accumulation in adipose tissue, muscle, and testis. J. Biol. Chem. 277: 4806–4815 [DOI] [PubMed] [Google Scholar]
- 32.Hu C., Hoene M., Zhao X., Haring H. U., Schleicher E., Lehmann R., Han X., Xu G., Weigert C. 2010. Lipidomics analysis reveals efficient storage of hepatic triacylglycerides enriched in unsaturated fatty acids after one bout of exercise in mice. PLoS ONE. 5: e13318. [DOI] [PMC free article] [PubMed] [Google Scholar]
- 33.Dennis E. A., Deems R. A., Harkewicz R., Quehenberger O., Brown H. A., Milne S. B., Myers D. S., Glass C. K., Hardiman G., Reichart D., et al. 2010. A mouse macrophage lipidome. J. Biol. Chem. 285: 39976–39985 [DOI] [PMC free article] [PubMed] [Google Scholar]
- 34.Debois D., Bralet M. P., Le Naour F., Brunelle A., Laprevote O. 2009. In situ lipidomic analysis of nonalcoholic fatty liver by cluster TOF-SIMS imaging. Anal. Chem. 81: 2823–2831 [DOI] [PubMed] [Google Scholar]
- 35.Wang H., Wei E., Quiroga A. D., Sun X., Touret N., Lehner R. 2010. Altered lipid droplet dynamics in hepatocytes lacking triacylglycerol hydrolase expression. Mol. Biol. Cell. 21: 1991–2000 [DOI] [PMC free article] [PubMed] [Google Scholar]
- 36.Kanoh H. 1969. Biosynthesis of molecular species of phosphatidyl choline and phosphatidyl ethanolamine from radioactive precursors in rat liver slices. Biochim. Biophys. Acta. 176: 756–763 [PubMed] [Google Scholar]
- 37.Pettitt T. R., Dove S. K., Lubben A., Calaminus S. D., Wakelam M. J. 2006. Analysis of intact phosphoinositides in biological samples. J. Lipid Res. 47: 1588–1596 [DOI] [PubMed] [Google Scholar]
- 38.Deacon E. M., Pettitt T. R., Webb P., Cross T., Chahal H., Wakelam M. J., Lord J. M. 2002. Generation of diacylglycerol molecular species through the cell cycle: a role for 1-stearoyl, 2-arachidonoyl glycerol in the activation of nuclear protein kinase C-betaII at G2/M. J. Cell Sci. 115: 983–989 [DOI] [PubMed] [Google Scholar]
- 39.Krahmer N., Guo Y., Wilfling F., Hilger M., Lingrell S., Heger K., Newman H. W., Schmidt-Supprian M., Vance D. E., Mann M., et al. 2011. Phosphatidylcholine synthesis for lipid droplet expansion is mediated by localized activation of CTP:phosphocholine cytidylyltransferase. Cell Metab. 14: 504–515 [DOI] [PMC free article] [PubMed] [Google Scholar]
- 40.Paar M., Jungst C., Steiner N. A., Magnes C., Sinner F., Kolb D., Lass A., Zimmermann R., Zumbusch A., Kohlwein S. D. 2012. Remodeling of lipid droplets during lipolysis and growth in adipocytes. J. Biol. Chem. 287: 11164–11173 [DOI] [PMC free article] [PubMed] [Google Scholar]
- 41.Wiggins D., Gibbons G. F. 1992. The lipolysis/esterification cycle of hepatic triacylglycerol. Its role in the secretion of very-low-density lipoprotein and its response to hormones and sulphonylureas. Biochem. J. 284: 457–462 [DOI] [PMC free article] [PubMed] [Google Scholar]
- 42.Gibbons G. F., Wiggins D. 1995. Intracellular triacylglycerol lipase: its role in the assembly of hepatic very-low-density lipoprotein (VLDL). Adv. Enzyme Regul. 35: 179–198 [DOI] [PubMed] [Google Scholar]
- 43.Eichmann T. O., Lass A., Zimmermann R., Zechner R. 2011. Investigation of the substrate and stereoselectivity of adipose triglyceride lipase. Keystone Symposium, Lipid Biology and Lipotoxicity, poster abstract 130, 75.
Associated Data
This section collects any data citations, data availability statements, or supplementary materials included in this article.