Abstract
The purpose of this study was to evaluate poly(L-glutamic acid)-benzyl-DTPA-Gd (PG-Gd), a new biodegradable macromolecular magnetic resonance imaging contrast agent, for its pharmacokinetics and MRI enhancement in nonhuman primates. Studies were performed in rhesus monkeys at intravenous doses of 0.01, 0.02, and 0.08 mmol Gd/kg. T1-weighted MR images were acquired at 1.5T using fast spoiled gradient recalled echo and fast spin echo imaging protocols. The small-molecule contrast agent Magnevist was used as a control. PG-Gd in the monkey showed a bi-exponential disposition. The initial blood concentrations within 2 hours of PG-Gd administration were much higher than for those of Magnevist. The high blood concentration of PG-Gd was consistent with the MR imaging data, which showed prolonged circulation of PG-Gd in the blood pool. Enhancement of blood vessels and organs with a high blood perfusion (heart, liver, and kidney) was clearly visualized at 2 hours after contrast injection at the three doses used. A greater than proportional increase of the area under the blood concentration-time curve was observed when the administered single dose was increased from 0.01 mmol/kg to 0.08 mmol/kg. By 2 days after PG-Gd injection, the contrast agent was mostly cleared from all major organs, including kidney. The mean residence time was 15 hours at the 0.08 mmol/kg dose. A similar pharmacokinetic profile was observed in mice, with a mean residence time of 5.4 hours and a volume of distribution at steady-state of 85.5 mL/kg, indicating that the drug was mainly distributed in the blood compartment. Based on this pilot study, further investigations on potential systemic toxicity of PG-Gd in both rodents and large animals are needed before testing this agent in humans.
Keywords: Magnetic resonance imaging, blood pool, contrast media, polymers, non-human primate
Introduction
The ideal blood pool contrast agent for MRI is an enhancing, typically paramagnetic formulation that, following intravascular administration, remains largely in the vascular space for an extended period of time. Currently used small molecular weight gadolinium chelates are known to diffuse across vascular endothelium (outside of an intact blood-brain barrier) in both normal and neoplastic tissues. On the other hand, a macromolecular contrast media (MMCM) (molecular weight >50 kDa) prevents leakage into the interstitium and remains in the intravascular system for a prolonged time. The long intravascular half-life of MMCM allows imaging of the vasculature with a higher vessel-to-background signal ratio (1). One of the advantages of MMCM is that, by selectively reducing the T1 of blood, high-quality angiograms (including coronary artery imaging) (2), vascular abnormalities associated with certain tumors (3), atherosclerosis (4), and gross hemorrhage (5) can be detected. Another advantage is that the microvascular permeability surface area product of tumor microvessels can be more accurately assessed (6). Recently, several prototype MMCMs have been applied with considerable success in a host of experimental tumor models (6, 7). The preclinical results demonstrate strongly positive and significant correlations between MMCM-assayed tumor microvascular permeability and tumor blood volume with pathologic tumor grade, with tumor angiogenesis, and with tumor response to multiple forms of antiangiogenic/antivascular therapy (6, 7).
The first generation of blood pool agents showed little interstitial diffusion, but long blood residence times. They consisted of paramagnetic chelates covalently bound to macromolecules, such as polylysine (8), albumin (9), and polysaccharide (10, 11). These agents never reached clinical testing. A significant limitation of these MMCMs is that their clearance rate is very slow, which causes safety concerns. Prolonged circulation in the blood beyond the intended use also limit the ability to perform MRI before and soon after antiangiogenic therapy to detect early changes in tumor microvessel characteristics (12). The newer paramagnetic (Gd-based) blood pool agents have much faster clearance rates. This has been accomplished by small-molecular-weight agents such as MS-325 (EPIX) that bind reversibly to blood proteins (13). Other alternative approaches include designing macromolecular MRI contrast agents with precisely controlled molecular weight to enhance renal clearance (14, 15) and to design biodegradable MMCMs that can be cleared from the body after thorough MRI examinations are performed.
Poly(L-glutamic acid)-benzyl-DTPA-Gd (PG-Gd) is a MMCM that can be readily degraded by lysosomal enzymes to its basic component, L-glutamic acid (16). The T1 relaxivity of PG-Gd is 5-fold as great as that of Gd-DTPA at 1.5T. In rodents, MRI with PG-Gd showed enhanced vascular contrast at up to 2 hours after intravenous administration. The ability of PG-Gd to be degraded and cleared from the body makes it a favorable MRI MMCM. The purpose of this study was to evaluate and compare the preclinical pharmacokinetics and clearance of PG-Gd after intravenous administration to both rodents and non-human primates. T1-weighted dynamic and static MR images were acquired after intravenous injection to assess the potential clinical use of this new biodegradable blood-pool MMCM.
METHODS
Contrast Agent
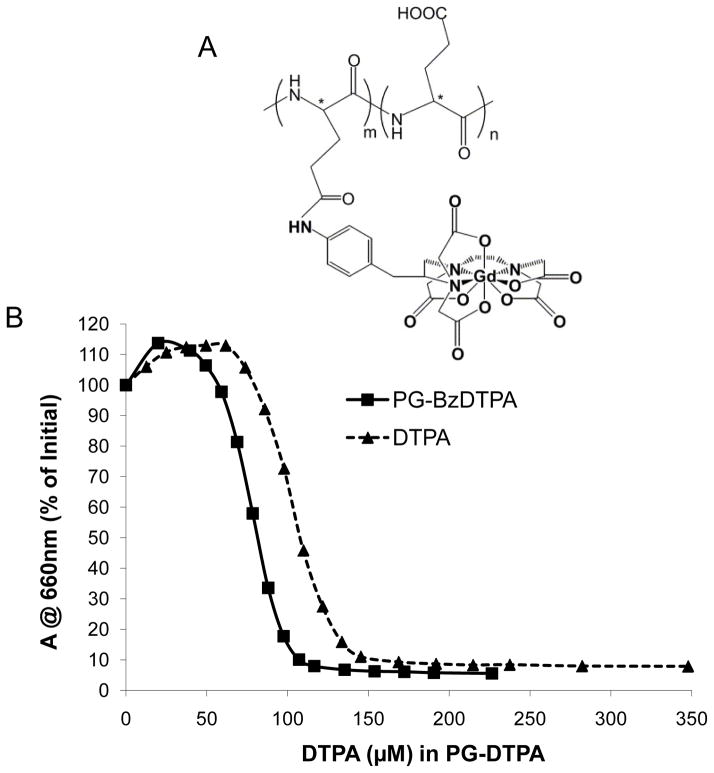
Gadopentetate dimeglumine (Magnevist) was obtained from Bayer HealthCare Pharmaceuticals, Inc. (Wayne, NJ). PG-Gd was synthesized as previously described (16, 17). The weight-average molecular weight and polydispersity of PG-Gd as measured by gel permeation chromatography were 98,000 and 1.45, respectively. Approximately 25% of the COOH groups were substituted with DTPA-Gd, with a Gd content of 12.4% on the basis of weight. The R1 relaxivities were measured at room temperature according to reported procedures (16), and the values were 14.8 mM−1s−1 and 9.8 mM−1s−1 at 1.5 T and 3.0 T, respectively. The chemical structure of PG-DTPA-Gd is shown in Figure 1A. The same synthetic batch of the contrast agent was used throughout this work.
FIGURE 1.
(A) Chemical structure of PG-Gd. (B) Stability of PG-BzDTPA-Gd complex. The stability was measured by titration of Gd-Arsenaso III complex with PG-BzDTPA or DTPA represented as IC50, the concentration of DTPA (μM) required to dissociate 50% of Gd-Arsenaso III. The IC50 values for PG-BzDTPA and DTPA are 107.6 μM and 80.6 μM, respectively.
Stability of Gd Complex
The stability was measured using a simple spectrophotometric method by competition with the colored dye 2,7-bis(o-arsenophenylazo)-1,8-dihydroxynaphthalene-3,6-disulfonic acid (arsenazo III) (18). This dye forms well-defined Gd3+-arsenazo(III) complexes that absorb strongly at 660 nm (ε = 35,000 l/mol-cm and 50,000 l/mol-cm for 1:1 and 1:2 complexes, respectively), while the uncomplexed dye absorbs little at this wavelength (ε = 650 l/mol-cm). The relative thermodynamic stabilities of Gd complexes were obtained by titration of Gd-arzenaso III with PG-BzDTPA or DTPA and measuring the concentration of equivalent DTPA (μM) required to dissociate 50% of Gd-arzenaso III (IC50): the lower the IC50 value, the higher the stability of Gd-DTPA complex.
Pharmacokinetics and Biodistribution in Mice
The mouse studies were performed in the Small Animal Imaging Facility at The University of Texas M. D. Anderson Cancer Center in accordance with institutional guidelines. Six healthy male Swiss mice (30–40 g; Charles River Laboratories, Wilmington, MA) were intravenously injected with PG-Gd at a dose of 0.08 mmol Gd/kg body weight. At 10 predetermined intervals up to 168 hours after the drug aministration, blood samples (0.5–1.0 mL) were taken by cardiac puncture from 6 mice at each sampling time, and the Gd concentrations were measured with inductively coupled plasma-mass spectroscopy (ICP-MS) performed at Galbreith Laboratories (Knoxville, TN).
For biodistribution measurements, mice were injected intravenously with PG-Gd (0.08 mmol Gd/kg) and killed at 2 hours, 2 days, or 7 days after intravenous injection of PG-Gd (6 mice were used at each time point). Heart, liver, spleen, kidney, and muscle were removed, blotted free of surface blood, transferred to counting vials, and weighed. Gadolinium concentrations were measured by ICP-MS. The uptake of Gd in various tissues was determined as the percentage of the injected dose per gram of tissue (%ID/g).
Rhesus Macaques
The rhesus macaques were housed separately in an Association for Assessment and Accreditation of Laboratory Animal Care (AAALAC)-accredited facility. The experiment was performed following M. D. Anderson Cancer Center guidelines for the conduct of non-human primate experiments and under an Institutional Animal Care and Use Committee (IACUC)-approved protocol.
Each rhesus monkey was fasted overnight but given free access to drinking water before the imaging study. Each monkey was anesthetized by intramuscular injection of ketamine hydrochloride (15 mg/kg), premedicated by intramuscular injection of atropine sulfate (0.4 mg/kg), and intubated; anesthesia was maintained by inhalation of 1–3% isoflurane. After stabilization of vital signs under anesthesia, each monkey was cannulated in the left and right saphenous veins (19–21 gauge closed intravenous catheter; Becton Dickinson Infusion Therapy Systems, Sandy, UT). The cubital vein was catheterized for emergency venous access if needed, and the catheters placed in saphenous veins in both legs were used for the injection of MRI contrast agent and withdrawal of blood samples. The monkeys were then immobilized on a vacuum-controlled “beanbag,” transferred to the MRI room, and placed in the 1.5T GE Excite HDx MRI scanner (GE Healthcare, Waukesha, WI). The electrocardiogram, pulse, respiration rate, and CO2 levels of each monkey were monitored throughout each imaging session.
Pharmacokinetics and MR Imaging in Rhesus Macaques
To evaluate the pharmacokinetics in the same nonhuman primate, one healthy female monkey (body weight: 6.7 kg) was given three single-dose injections of PG-Gd (0.08, 0.02, and 0.01 mmol Gd/kg) with a dosing interval of 2.5 months after the first dosing (0.08 mmol Gd/kg) and 4.5 months after the second dosing (0.02 mmol Gd/kg). These dosing intervals were determined to allow complete drug elimination and to avoid the potential pharmacokinetic interactions of the contrast agent. During these intervals, the monkey was housed in the original cage and given a regular diet with free access of water. One healthy, 9-year-old male monkey (body weight: 8.7 kg) was used to repeat the pharmacokinetics and MR imaging of PG-Gd at a dosage of 0.02 mmol Gd/kg. In addition, Magnevist (0.1 mmol Gd/kg; Bayer Healthcare Pharmaceuticals), a commercially available, small molecule contrast agent was also injected in both of the monkey as the control studies.
Blood samples (0.5–1.0 ml per time point) were drawn from the left saphenous vein at the following time points: before contrast injection, and at 30 min, 1 h, 2 h, 6 h, 1 d, 2 d, 3 d, 7 d and 14 d after injection. The Gd concentrations of the blood samples were quantified by ICP-MS.
Under general anesthesia, the rhesus monkeys were imaged using the 1.5T MR scanner with CRM gradient subsystem (GE Healthcare). The monkeys were positioned supinely, and all images were obtained using an 8-channel body phased array radiofrequency receive coil. Dynamic contrast-enhanced (DCE) MRI data were acquired before, during, and for 10 minutes immediately following contrast agent injection. T1-weighted fast spin echo (FSE) and fast spoiled gradient recalled echo (FSPGR) images were acquired at 30 minutes, 1 hour, and 2 hours after contrast injection. PG-Gd was injected (at 0.01, 0.02, and 0.08 mmol Gd/kg) through the right saphenous vein using an MR-compatible-injector at a rate of 0.1 mL/second, followed by a flush with 10 mL of saline at a rate of 1 mL/second. The MRI scans were repeated on day 2 post-injection. The acquisition parameters for the MRI acquisitions were as follows:
DCE-MRI scans
3D fast spoiled gradient recalled echo (FSPGR), 10 degree flip angle, TE/TR = 2.6/5.4 ms, ±31.3 kHz bandwidth, 42 × 34 cm field of view, contiguous 6-mm sections, 256 × 160 matrix, 1 excitation, ASSET parallel imaging with an acceleration factor of 2, 74 phases, scan time of 10:50 min.
T1-weighted FSE scans
2D fast spin echo (FSE), echo train length of 3, TE/TR = 19/550 ms, ±15.6 kHz bandwidth, 42 × 42 cm field of view, 5-mm sections with 1-mm gap, 256 × 224 matrix, 4 excitations, scan time of 5:39 min.
T1-weighted FSPGR scans
Same as for DCE-MRI scans, above, but only 5 phases were acquired for a scan time of 0:44 min.
To compare the results with those for a current clinically available gadolinium contrast agent, Magnevist was administered at a dose of 0.1 mmol Gd/kg (standard human dose) on a separate day in the same female monkey, and the same MRI imaging protocol was used as described above.
Pharmacokinetic Analysis
The blood concentration-time profiles after intravenous injection of PG-Gd in mice and monkeys were analyzed using noncompartmental analysis using WinNonlin ™ 5.0.1 software (Pharsight Corp., Palo Alto, CA). Mean blood concentration values from 6 mice at each sampling time point were used for the mice pharmacokinetic analysis. The area under the blood concentration-time curve (AUC) was calculated using the log-linear trapezoidal rule. The elimination half-life (t1/2) was calculated by the equation t1/2 = 0.693/K, where K was estimated from the terminal slope of the blood Gd concentration versus time curve. The systemic clearance (CL) was determined from dose/AUC, with AUC (area under the curve to infinity) by linear interpolation and extrapolation to infinity y from Clast x t1/2β/0.693 (where Clast was concentration at each last sampling point). The volume of distribution at steady-state (Vss) was determined by the equation Vss = CL × (AUMC/AUC), where AUMC is the area under the first moment curve. The mean residence time (MRT) was calculated from AUMC/AUC.
Pilot Toxicity Study in Mice
A single-dose toxicity study in mice was conducted to evaluate the potential renal toxicity of intravenous injection of PG-Gd. Nine healthy female CD1 mice (6–8 weeks old, 22.7–28.5 g, Charles River Laboratories) were intravenously injected with the same dose of 1256 mg PG-Gd/kg (125 mg PG-Gd/mL) or 1.0 mmol equivalent Gd/kg and then assigned randomly to 3 treatment groups. All the mice were weighed 3 times per week. Each group of animals was killed at specific time intervals (at 1, 3, or 14 days after intravenous injection of PG-Gd). Blood samples were collected prior to killing by cardiac puncture. Blood urea nitrogen (BUN) and creatinine were analyzed for renal toxicity. All animals were killed by exsanguination under anesthesia, and the kidneys were collected for histological evaluation. Kidney tissues were fixed in 10% neutral buffered formalin, embedded in paraffin wax, processed by routine methods for staining with hematoxylin and eosin (H&E), and then evaluated microscopically.
RESULTS
Stability of Gd Complex
The competition of Gd-Arsenaso III with increasing concentrations of PG-BzDTPA or DTPA is shown in Figure 1B. At pH 4–5 and room temperature, DTPA required a higher concentration to dissociate 50% of Gd-Arzenaso III than did PG-BzDTPA. The IC50 values for PG-BzDTPA and DTPA were 80.6 μM and 107.6 μM, respectively, which confirmed that PG-BzDTPA-Gd complex is more stable than DTPA-Gd complex.
Biodistribution and Pharmacokinetics in Mice
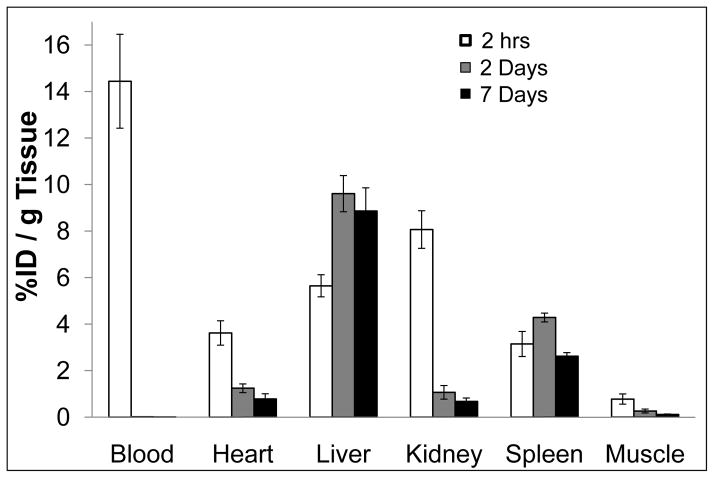
Biodistributions of PG-Gd in normal Swiss mice at 2 hours, 2 days, and 7 days after intravenous injection of PG-Gd at a dose of 0.08 mmol Gd/kg is shown in Figure 2. At 2 hours after injection, most of the PG-Gd was retained in the blood circulation (%ID/g=14.44 ± 2.02), which is critical for the blood-pool MR imaging. High uptake was found in the kidney (%ID/g=8.07 ± 0.81) and the liver (%ID/g = 5.65 ± 0.47) (Fig. 2). The kidney uptake was dramatically decreased at 2 days after injection (%ID/g = 1.07 ± 0.29, p < 0.0001 compared to the data at 2 h post-injection). At 7 days post injection, only a trace amounts of PG-Gd remained in the kidney (0.68 ± 0.15), suggesting gradual clearance of the biodegradable polymer contrast from the kidney. In contrast to the kidney, the liver uptake increased significantly to %ID/g = 9.61± 0.78 by 2 d post injection (p < 0.0001 compared to 2 h data), which did not change over a 7 days period (p=0.18 compared to 2 d data). Consistent with clearance from the blood pool 2 days after injection, the levels of Gd in the heart and the muscle also declined significantly from 2 hours to 2 days (p < 0.0001 in both cases).
FIGURE 2.
Biodistribution of PG-Gd in mice at 2 hours, 2 days, and 7 days after injection of PG-Gd at a dose of 0.08 mmol Gd/kg. The data are expressed as the percentage injected dose per gram tissue (%ID/g) and represented as the mean values of 6 mice. Bars indicate standard deviation.
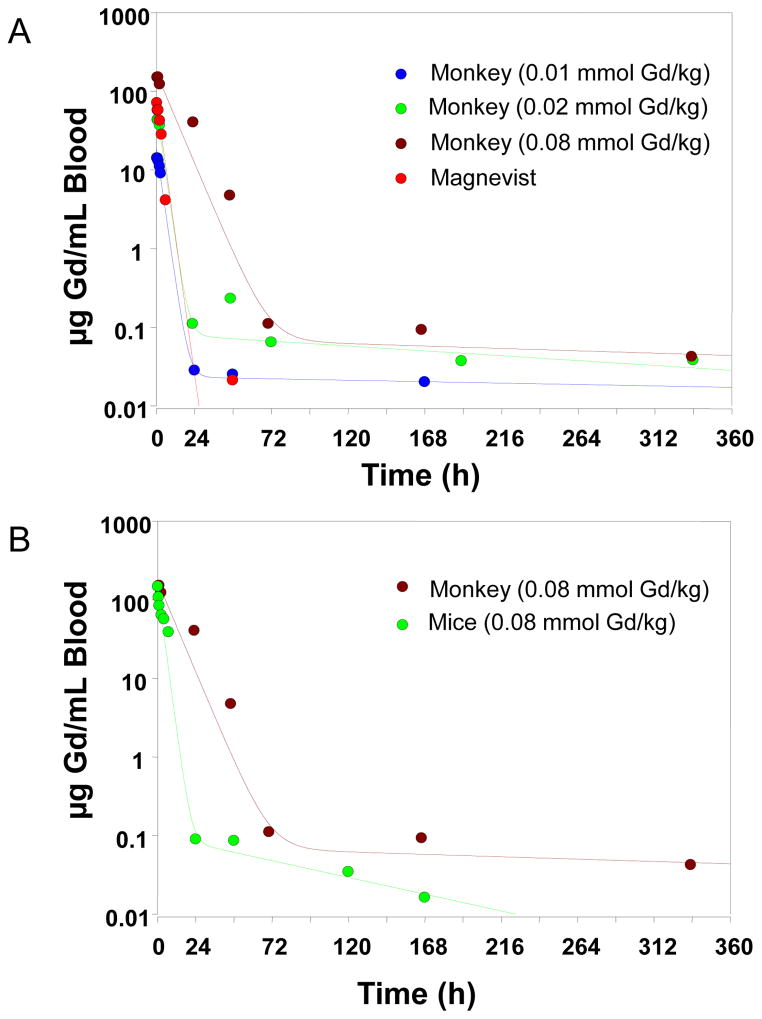
The mean blood concentration-time profile and the pharmacokinetic parameters of PG-Gd after intravenous administration of 0.08 mmol Gd/kg (equivalent to 12,560 μg Gd/kg) to mice are shown in Figure 3B and Table 1. The drug was rapidly distributed within the initial 24 hours followed by a prolonged elimination phase, with a half-life of 50.1 hours. The volume of distribution at steady-state (Vss) was estimated to be approximately 85.5 mL/kg, which is approximately 3.0 mL/mouse (based on an average mouse weight of 35 g), similar to the total blood volume of the mouse, suggesting that PG-Gd was largely distributed and circulated within the blood compartment in mice. Mean initial Gd concentration was 146.5 μg/mL at 5 min after intravenous administration of PG-Gd.
FIGURE 3.
Pharmacokinetic profiles of Gd in a monkey and mice. (A) Mean blood concentration versus time profiles for Gd after intravenous administration of PG-Gd at doses of 0.01, 0.02, and 0.08 mmol/kg and of Magnevist at a dose of 0.1 mmol/kg to monkeys. (B) Mean blood concentration versus time profiles for Gd after intravenous administration of PG-Gd at a dose of 0.08 mmol/kg to a monkey or mice. The lines represent the predicted blood concentration of PG-Gd.
Table 1.
Summary of Pharmacokinetic Parameters in Monkeys and Mice
|
|
|
|
|
|||
|---|---|---|---|---|---|---|
| Species
|
Male Monkey
|
Female Monkey
|
Mouse
|
|||
| Contrast agent | PG-Gd | Magnevist | PG-Gd | PG-Gd | PG-Gd | PG-Gd |
| Dose (mmol Gd/kg) | 0.02 | 0.1 | 0.01 | 0.02 | 0.08 | 0.08 |
| T 1/2β (h) | 4.11 | 1.32 | 4.88 | 68.4 | 185 | 50.1 |
| Vss (mL/kg) | 62.1 | 231 | 55 | 82.8 | 72.2 | 85.5 |
| AUC (mcg·h/mL blood) | 277.7 | 313 | 134.5 | 500 | 2614 | 795 |
| CL (mL/h/kg) | 11.3 | 50.1 | 11.7 | 6.28 | 4.81 | 15.8 |
| MRT (h) | 5.49 | 4.49 | 4.81 | 13.2 | 15 | 5.43 |
T 1/2β, elimination half-life; Vss, volume of distribution at steady-state; AUC, area under the blood concentration-time curve; CL, systemic clearance; MRT, mean residence time. Mice pharmacokinetic parameters represent mean values from 6 mice.
Pharmacokinetics in Rhesus Macaques
The blood concentration-time profiles of intravenously administered PG-Gd were best characterized by a bi-exponential disposition. Figure 3A shows the mean observed blood concentration-time profiles and the theoretic curve generated from WinNonlin-estimated parameters after administration of 0.01, 0.2, and 0.08 mmol Gd/kg PG-Gd. The blood showed a rapid initial distribution/elimination phase followed by a prolonged elimination phase for the clearance of PG-Gd. Various pharmacokinetic parameters associated with the disposition of PG-Gd are given in Table 1. The volume of distribution at steady-state (Vss) for PG-Gd ranged from 55 ml/kg to 82.8 mL/kg, which were similar to the total blood volume of the monkey (approximately 70–80 mL/kg), suggesting PG-Gd distributes mainly in blood rich organs and has minimal deep tissue distributions. There was a decrease in the clearances (CL) when the dose increased from 0.01 mmol/kg to 0.08 mmol/kg, suggesting a potential saturable elimination process of PG-Gd within the dose range. However, a large number of animals are needed to confirm any nonlinear pharmacokinetics. In case of the male monkey, PG-Gd showed similar Vss, but higher CL as compared with that of the female monkey at 0.02 mmol/kg dosing level.
When compared with the blood concentration-time profiles (Fig. 3A) and pharmacokinetic parameters (Table 1) of Magnevist, PG-Gd showed much higher initial drug concentrations within 2 hours of the administration compared with that of the small-molecular-weight agent Magnevist. PG-Gd also had much slower systemic clearances (4.81–11.7 mL/h/kg) than did Magnevist (CL = 50 mL/h/kg). The volume of distribution at steady-state for Magnevist was about 3–4 times higher than that for PG-Gd, suggesting that Magnevist was distributed thoroughly after the administration, whereas PG-Gd was primarily distributed to the central blood compartment.
MR Imaging
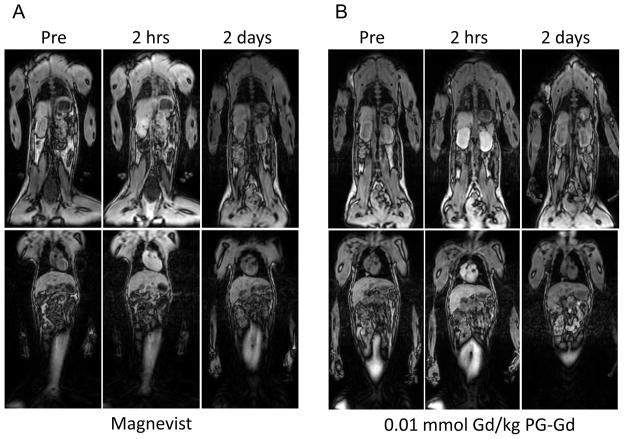
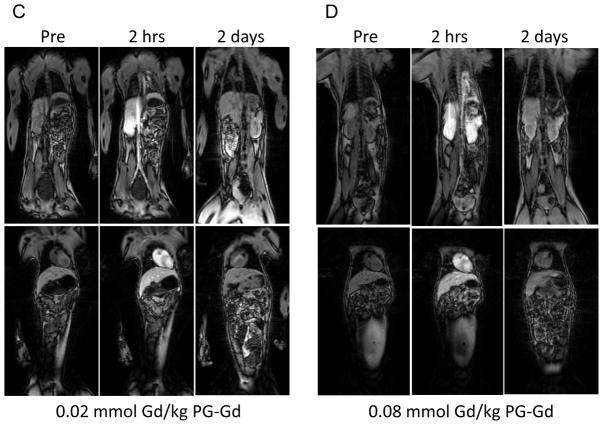
T1-weighted FSPGR images acquired before and at 2 hours and 2 days after contrast injection are shown in Figure 4. At 2 hours after injection of PG-Gd with doses from 0.01 to 0.08 mmol Gd/kg, significant contrast enhancement was clearly visualized in the vascular tree (aorta and heart) and the organs with high blood perfusion (i.e., kidney and liver). By 2 days post-injection, most of the contrast agent was cleared from all major organs including kidney. In comparison, after injection of Magnevist at a dose of 0.1 mmol Gd/kg, enhancement of all major organs including muscle was observed at 2 hours after injection. The images acquired with Magnevist had poorer contrast than those acquired with PG-Gd owing to extensive diffusion of Magnevist to the extravascular space.
FIGURE 4.
T1-weighted fast spoiled gradient echo images of monkey before contrast injection and at 2 hours, and 2 days after injection of Magnevist at 0.1 mmol Gd/kg (A), PG-Gd at 0.01 mmol Gd/kg (B), PG-Gd at 0.02 mmol Gd/kg (C), and PG-Gd at 0.08 mmol Gd/kg (D). Enhancements of blood vessel, heart, kidney, and liver were clearly visualized at 2 hours after PG-Gd injection at doses from 0.01 to 0.08 mmol Gd/kg. By 2 days post-injection, most contrast agent was cleared from all major organs including kidney. Compared with Magnevist, PG-Gd showed clearer contrast enhancement of blood vessels and other major organs.
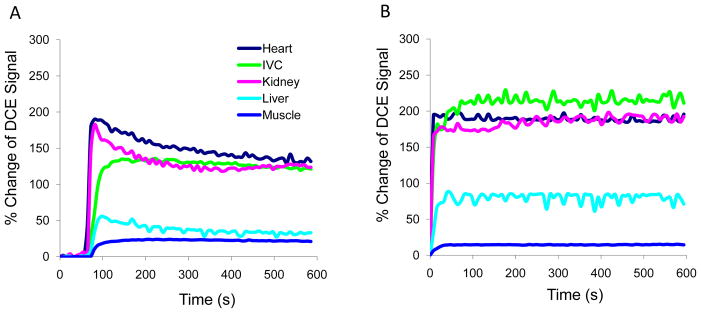
Dynamic contrast enhanced MRI with PG-Gd, represented by changes in DCE signal at an injected dose of 0.08 mmol Gd/kg, demonstrated stable enhancement in blood vessels, heart, liver, and kidney within the initial 10 minutes after injection of the contrast. Similar findings were observed with the other PG-Gd doses (0.01 and 0.02 mmol Gd/kg, data no shown). DCE signals in these organs with Magnevist at 0.1 mmol Gd/kg gradually decreased over this time frame (Fig. 5).
FIGURE 5.
Dynamic contrast enhanced (DCE) MRI signals in the major organs of the monkey at the first 10 minutes after injection of Magnevist at 0.1 mmol Gd/kg (A) and PG-Gd at 0.08 mmol Gd/kg (B). DCE MRI with PG-Gd showed stable contrast enhancement in blood vessel, heart, liver, and kidney at all doses, whereas enhancement with Magnevist gradually decreased within 10 minutes.
Pilot Toxicity Study in Mice
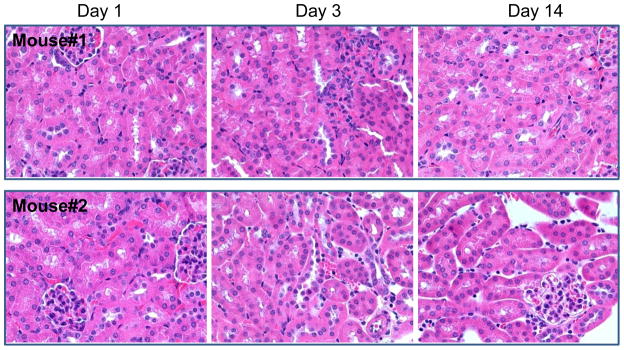
No abnormality was observed and all mice survived to the scheduled termination. BUN and creatinine levels were within normal ranges after the single-dose intravenous injections of PG-Gd at 24 hours, 3 days, and 14 days. No significant body weight loss was observed during the study. In addition, No PG-Gd-related microscopic lesions were observed in the H&E staining in the kidney (Fig. 6).
FIGURE 6.
Histology of mouse kidneys at 1, 3, and 14 days after injection of PG-Gd at a dose of 1.0 mmol equivalent Gd/kg. No microscopic evidence of renal toxicity was observed. Panel A: mouse #1 and Panel B: mouse #2. Magnification: ×400.
DISCUSSION
PG-Gd is designed as a gadolinium-based biodegradable macromolecular contrast agent that is retained in vascular system for an extended time relative to low molecular weight conventional gadolinium MR contrast agents. The relaxivity of MMCM agent is significantly increased relative to conventional MR contrast agents, which, in concert with the increased blood concentrations, leads to considerably more blood signal enhancement on MRI scans at a lower injected dose (16). In addition, PG-Gd localizes to necrotic tissues several days after administration, making it a promising agent for evaluating response to anticancer therapies (17). Gadolinium-based contrast agents have recently been the subject of intense interest as their use has been putatively linked to a rare condition called nephrogenic systemic fibrosis (NSF) (19, 20). The pathogenesis of NSF is unexplained, and the factor or factors triggering the onset of the disease are a matter of debate. It is thought that free Gd released from metal chelating agents via transmetallation may cause the toxic Gd effect on tissues of uremic patients. Therefore, for blood-pool imaging agents, the use of lower dosages of a more stable Gd-chelate complex should be safer and preferred.
Colorimetric assay with arsenazo III was performed to compare the relative stability of PG-Gd and Magnevist, a DTPA-Gd solution used in the clinic. The amount of PG-BzDTPA required to replace 50% of the arsenazo III-Gd complex was only 75% of what was required for DTPA solution, implying that PG-BzDTPA forms a more stable complex with Gd than does DTPA. Previous investigators have shown that Bz-DTPA transmetallation decreases with the introduction of benzyl groups at the ethylene C-4 and C-5 positions owning to the steric hindrance of the benzyl group, resulting in more stable metal complexes than DTPA (21).
The pharmacokinetic characteristics of PG-Gd in the monkey showed a small volume of distribution and vascular confinement of the contrast agent, which is superior than Magnevist, where the agent is largely distributed to the extravascular extracellular space (outside the central nervous system) after intravenous administration. This is confirmed by the DCE MRI data, which showed gradual reduction in signal intensity after Magnevist injection within 10 min after contrast injection, whereas stable enhancement was observed after injection of PG-Gd during the same period (Fig. 5). PG-Gd showed much higher initial blood concentrations within 2 hours of administration than did Magnevist. Blood PG-Gd concentrations dropped to a significantly lower level by 2 days after drug administration and mean residence times for PG-Gd were within 15 hours. PG-Gd had an increased elimination half life than that of Magnevist. There was a big increase in the terminal elimination half-lives when PG-Gd dose increased from 0.01 mmol/kg to 0.08 mmol/kg. This could be a result of saturable elimination of PG-Gd at higher doses which showed a much lower systemic clearance. However, limited analytical sensitivity (0.02 ppm) restricted the ability to fully characterize the blood profile following the lower dose administration. Further studies are warranted to fully characterize the terminal disposition phase of PG-Gd in a larger number of animals. Nevertheless, our study did show greater systemic clearance of Magnevist as compared with PG-Gd.
Similar pharmacokinetic profiles were observed in male rhesus macaques following intravenous administration of 0.02 mmol/kg of PG-Gd as compared with that seen in female rhesus macaques. The systemic clearance of the male monkey, however, was about 2 times higher than that of the female monkey. The difference could be attributed to a potentially higher renal glomerular filtration rate, which is proportional to body weight, and/or higher hepatic clearance of the drug in male monkey. Again, a larger number of animals are needed in order to fully evaluate the gender differences in pharmacokinetics of PG-Gd.
At 0.08 mmol Gd/kg, PG-Gd showed faster body-weight normalized total systemic clearance in mice than in monkey (Fig. 3B). Species difference in pharmacokinetics between rodent and monkey has been noted for other blood-pool imaging agents (22). These differences are attributable to differences in reticuloendothelial system (RES) uptake across animal species and a faster metabolic rate for rodents than for monkeys.
Biodistribution in mice showed accumulation of PG-Gd in the liver and spleen, consistent with RES clearance of macromolecular contrast agents. Significantly, accumulation in kidney was transient, with most of the gadolinium cleared from kidney by day 2 after contrast injection (Fig. 2). The detection of Gd in liver, spleen, and kidney cannot be used to establish the chemical form of the residual gadolinium (free Gd, oligomeric species from degraded PG-Gd, or polymeric PG-Gd) in the body. In our previous study, we have found that poly(L-glutamic acid) was degraded primarily in the liver of mice by cathepsins, and the degradation in mice peaked at 4 hours after polymer injection (23). Therefore, it is most likely that PG-Gd was degraded into oligomeric species and then cleared from the body. Further studies are needed to determine whether oligomeric glutamate-DTPA-Gd chelates are species eventually cleared from monkeys.
Previous studies in rodents have shown that blood vessels and implanted tumors could be readily visualized at a dose of 0.04 mmol Gd/kg with PG-Gd (16, 17). In female monkey at a dose of 0.02 mmol Gd/kg, inferior vena cava (IVC) and organs with high blood perfusion such as heart, liver, and kidney were clearly visualized at 2 hours after injection (Fig. 4C). In contrast, Magnevist at the clinical dose of 0.1 mmol G/kg showed much less enhancement of IVC, heart, and kidney with poorer contrast sensitivity owing to enhancement of background tissue, such as muscle. A further decrease in the dose of PG-Gd to 0.01 mmol Gd/kg resulted in clear delineation of IVC, heart, liver, and kidney, although contrast enhancement was seen at a lesser level at this dose compared with a dose of 0.02 mmol Gd/kg. Increasing the dose to 0.08 mmol Gd/kg did not show further improvement in image quality. On the basis of imaging data and pharmacokinetic data from monkeys, a dose of 0.02 mmol Gd/kg is recommended as the starting dose for future clinical trial study of PG-Gd. It should be pointed out that the signal enhancement in kidney and liver were drastically reduced by day 2 after injection. This observation may be attributed to degradation and gradual clearance of PG-Gd from the body.
Because of the renal toxicity concern, our pilot toxicity evaluation focused on the acute effect of PG-Gd on renal function and histopathology in mice. No change in renal function and no microscopic lesions were observed at a dose of 1.0 mmol Gd/kg, which is 50 times the proposed clinical dose.
CONCLUSIONS
In this study involving rhesus monkeys, the pharmacokinetics and elimination profile of PG-Gd indicated that this agent could be used as a blood-pool MR imaging agent, and that it could be excreted from the body within days after administration. Based on this pilot study, further investigations on potential systemic toxicity of PG-Gd on both rodents and large animals are needed before this agent is translated into the clinic.
Acknowledgments
Grant Support: NIH grants R01 CA119387 and John S. Dunn Foundation.
We thank Drs. Agatha Borne for her veterinary support; Dana Toomey, Julie Basham, Deborah Petit, Alfredo Santiago, and Jennifer Miller for their veterinary technical support of this study; Michelle Underwood and Krista Runge for their MR data acquisition support; and Drs. Mary J. Johansen, Peiying Yang, and Carolyn S. Van Pelt for assisting with the mouse toxicity study. We thank Michael Worley for editing the manuscript. This work was partially supported by NIH grants R01 EB000174 (CL) and the John S. Dunn Foundation (CL).
References
- 1.Knopp MV, von Tengg-Kobligk H, Floemer F, Schoenberg SO. Contrast agents for MRA: future directions. J Magn Reson Imaging. 1999;10:314–316. doi: 10.1002/(sici)1522-2586(199909)10:3<314::aid-jmri13>3.0.co;2-y. [DOI] [PubMed] [Google Scholar]
- 2.Saeed M, Wendland MF, Higgins CB. Blood pool MR contrast agents for cardiovascular imaging. J Magn Reson Imaging. 2000;12:890–898. doi: 10.1002/1522-2586(200012)12:6<890::aid-jmri12>3.0.co;2-k. [DOI] [PubMed] [Google Scholar]
- 3.Daldrup-Link HE, Brasch RC. Macromolecular contrast agents for MR mammography: current status. Eur Radiol. 2003;13:354–365. doi: 10.1007/s00330-002-1719-1. [DOI] [PubMed] [Google Scholar]
- 4.Kramer H, Morana G. Whole-body magnetic resonance angiography with blood-pool agents. Eur Radiol. 2007;17 (Suppl 2):B24–29. [PubMed] [Google Scholar]
- 5.Gupta H, Weissleder R, Bogdanov AA, Jr, Brady TJ. Experimental gastrointestinal hemorrhage: detection with contrast-enhanced MR imaging and scintigraphy. Radiology. 1995;196:239–244. doi: 10.1148/radiology.196.1.7784574. [DOI] [PubMed] [Google Scholar]
- 6.Brasch R, Turetschek K. MRI characterization of tumors and grading angiogenesis using macromolecular contrast media: Status report. Eur J Radiol. 2000;34:148–155. doi: 10.1016/s0720-048x(00)00195-9. [DOI] [PubMed] [Google Scholar]
- 7.Barrett T, Kobayashi H, Brechbiel M, Choyke PL. Macromolecular MRI contrast agents for imaging tumor angiogenesis. Eur J Radiol. 2006;60:353–366. doi: 10.1016/j.ejrad.2006.06.025. [DOI] [PubMed] [Google Scholar]
- 8.Bock JC, Kaufmann F, Felix R. Comparison of gadolinium-DTPA and macromolecular gadolinium-DTPA-polylysine for contrast-enhanced pulmonary time-of-flight magnetic resonance angiography. Invest Radiol. 1996;31:652–657. doi: 10.1097/00004424-199610000-00007. [DOI] [PubMed] [Google Scholar]
- 9.Boschi F, Marzola P, Sandri M, et al. Tumor microvasculature observed using different contrast agents: a comparison between Gd-DTPA-Albumin and B-22956/1 in an experimental model of mammary carcinoma. Magma. 2008;21:169–176. doi: 10.1007/s10334-008-0106-6. [DOI] [PubMed] [Google Scholar]
- 10.Claude BS, David RV, Jacqueline AC, Marlon BC, Richard BB, Robert FM. Gadolinium-DTPA-dextran: A macromolecular MR blood pool contrast agent1. Acad Radiol. 2004;11:1361–1369. doi: 10.1016/j.acra.2004.11.016. [DOI] [PubMed] [Google Scholar]
- 11.Lebduskova P, Kotek J, Hermann P, et al. A gadolinium(III) complex of a carboxylic-phosphorus acid derivative of diethylenetriamine covalently bound to Inulin, a potential macromolecular MRI contrast agent. Bioconjug Chem. 2004;15:881–889. doi: 10.1021/bc049966g. [DOI] [PubMed] [Google Scholar]
- 12.Kobayashi H, Kawamoto S, Star RA, Waldmann TA, Brechbiel MW, Choyke PL. Activated clearance of a biotinylated macromolecular MRI contrast agent from the blood pool using an avidin chase. Bioconjug Chem. 2003;14:1044–1047. doi: 10.1021/bc034064l. [DOI] [PubMed] [Google Scholar]
- 13.Corot CP, Violas X, Robert PMS. Comparison of different types of blood pool agents (P792, MS325, USPIO) in a rabbit MR angiography-like protocol. Invest Radiol. 2003;38:311–319. [PubMed] [Google Scholar]
- 14.Kobayashi H, Brechbiel MW. Nano-sized MRI contrast agents with dendrimer cores. Adv Drug Deliv Rev. 2005;57:2271–2286. doi: 10.1016/j.addr.2005.09.016. [DOI] [PubMed] [Google Scholar]
- 15.Kobayashi H, Kawamoto S, Jo SK, Bryant HL, Jr, Brechbiel MW, Star RA. Macromolecular MRI contrast agents with small dendrimers: pharmacokinetic differences between sizes and cores. Bioconjug Chem. 2003;14:388–394. doi: 10.1021/bc025633c. [DOI] [PubMed] [Google Scholar]
- 16.Wen X, Jackson EF, Price RE, et al. Synthesis and characterization of poly(L-glutamic acid) gadolinium chelate: a new biodegradable MRI contrast agent. Bioconjug Chem. 2004;15:1408–1415. doi: 10.1021/bc049910m. [DOI] [PubMed] [Google Scholar]
- 17.Jackson EF, Esparza-Coss E, Wen X, et al. Magnetic resonance imaging of therapy-induced necrosis using gadolinium-chelated polyglutamic acids. Int J Radiat Oncol Biol Phys. 2007;68:830–838. doi: 10.1016/j.ijrobp.2007.01.011. [DOI] [PMC free article] [PubMed] [Google Scholar]
- 18.Sherry AD, Cacheris WP, Kuan KT. Stability constants for Gd3+ binding to model DTPA-conjugates and DTPA-proteins: implications for their use as magnetic resonance contrast agents. Magn Reson Med. 1988;8:180–190. doi: 10.1002/mrm.1910080208. [DOI] [PubMed] [Google Scholar]
- 19.Ledneva E, Karie S, Launay-Vacher V, Janus N, Deray G. Renal safety of gadolinium-based contrast media in patients with chronic renal insufficiency. Radiology. 2009;250:618–628. doi: 10.1148/radiol.2503080253. [DOI] [PubMed] [Google Scholar]
- 20.Perazella MA. Current status of gadolinium toxicity in patients with kidney disease. Clin J Am Soc Nephrol. 2009;4:461–469. doi: 10.2215/CJN.06011108. [DOI] [PubMed] [Google Scholar]
- 21.Laurent S, Botteman F, Vander Elst L, Muller RN. Relaxivity and transmetallation stability of new benzyl-substituted derivatives of gadolinium-DTPA complexes. Helvetica Chimica Acta. 2004;87:1077–1089. [Google Scholar]
- 22.Parmelee DJ, Walovitch RC, Ouellet HS, Lauffer RB. Preclinical evaluation of the pharmacokinetics, biodistribution, and elimination of MS-325, a blood pool agent for magnetic resonance imaging. Invest Radiol. 1997;32:741–747. doi: 10.1097/00004424-199712000-00004. [DOI] [PubMed] [Google Scholar]
- 23.Melancon MP, Wang W, Wang Y, et al. A novel method for imaging in vivo degradation of poly(L-glutamic acid), a biodegradable drug carrier. Pharm Res. 2007;24:1217–1224. doi: 10.1007/s11095-007-9253-0. [DOI] [PMC free article] [PubMed] [Google Scholar]


