

Abstract
AIM: To compare quantities of predominant and pathogenic bacteria in mucosal and faecal samples.
METHODS: Twenty patients undergoing diagnostic colonoscopy with endoscopically and histologically normal mucosa were recruited to the study, 14 subjects of which also supplied faecal (F) samples between 15 d to 105 d post colonoscopy. Mucosal biopsies were taken from each subject from the midportion of the ascending colon (right side samples, RM) and the sigmoid (left side samples, LM). Predominant intestinal and mucosal bacteria including clostridial 16S rRNA gene clusters IV and XIVab, Bacteroidetes, Enterobacteriaceae, Bifidobacterium spp., Akkermansia muciniphila (A. muciniphila), Veillonella spp., Collinsella spp., Faecalibacterium prausnitzii (F. prausnitzii) and putative pathogens such as Escherichia coli (E. coli), Clostridium difficile (C. difficile), Helicobacter pylori (H. pylori) and Staphylococcus aureus (S. aureus) were analysed by quantitative polymerase chain reaction (qPCR). Host DNA was quantified from the mucosal samples with human glyceraldehyde 3-phosphate dehydrogenase gene targeting qPCR. Paired t tests and the Pearson correlation were applied for statistical analysis.
RESULTS: The most prominent bacterial groups were clostridial groups IV and XIVa+b and Bacteroidetes and bacterial species F. prausnitzii in both sample types. H. pylori and S. aureus were not detected and C. difficile was detected in only one mucosal sample and three faecal samples. E. coli was detected in less than half of the mucosal samples at both sites, but was present in all faecal samples. All detected bacteria, except Enterobacteriaceae, were present at higher levels in the faeces than in the mucosa, but the different locations in the colon presented comparable quantities (RM, LM and F followed by P1 for RM vs F, P2 for LM vs F and P3 for RM vs LM: 4.17 ± 0.60 log10/g, 4.16 ± 0.56 log10/g, 5.88 ± 1.92 log10/g, P1 = 0.011, P2 = 0.0069, P3 = 0.9778 for A. muciniphila; 6.25 ± 1.3 log10/g, 6.09 ± 0.81 log10/g, 8.84 ± 1.38 log10/g, P1 < 0.0001, P2 = 0.0002, P3 = 0.6893 for Bacteroidetes; 5.27 ± 1.68 log10/g, 5.38 ± 2.06 log10/g, 8.20 ± 1.14 log10/g, P1 < 0.0001, P2 ≤ 0.0001, P3 = 0.7535 for Bifidobacterium spp.; 6.44 ± 1.15 log10/g, 6.07 ±1.45 log10/g, 9.74 ±1.13 log10/g, P1 < 0.0001, P2 ≤ 0.0001, P3 = 0.637 for Clostridium cluster IV; 6.65 ± 1.23 log10/g, 6.57 ± 1.52 log10/g, 9.13 ± 0.96 log10/g, P1 < 0.0001, P2 ≤ 0.0001, P3 = 0.9317 for Clostridium cluster XIVa; 4.57 ± 1.44 log10/g, 4.63 ± 1.34 log10/g, 7.05 ± 2.48 log10/g, P1 = 0.012, P2 = 0.0357, P3 = 0.7973 for Collinsella spp.; 7.66 ± 1.50 log10/g, 7.60 ± 1.05 log10/g, 10.02 ± 2.02 log10/g, P1 ≤ 0.0001, P2 = 0.0013, P3 = 0.9919 for F. prausnitzsii; 6.17 ± 1.3 log10/g, 5.85 ± 0.93 log10/g, 7.25 ± 1.01 log10/g, P1 = 0.0243, P2 = 0.0319, P3 = 0.6982 for Veillonella spp.; 4.68 ± 1.21 log10/g, 4.71 ± 0.83 log10/g, 5.70 ± 2.00 log10/g, P1 = 0.1927, P2 = 0.0605, P3 = 0.6476 for Enterobacteriaceae). The Bifidobacterium spp. counts correlated significantly between mucosal sites and mucosal and faecal samples (Pearson correlation coefficients 0.62, P = 0.040 and 0.81, P = 0.005 between the right mucosal sample and faeces and the left mucosal sample and faeces, respectively).
CONCLUSION: Non-invasive faecal samples do not reflect bacterial counts on the mucosa at the individual level, except for bifidobacteria often analysed in probiotic intervention studies.
Keywords: Gastrointestinal microbiota, Mucosa, Faeces, Real-time quantitative polymerase chain reaction, Sampling
INTRODUCTION
Within the gastrointestinal tract, the bacterial community living dispersed in the luminal content differs from those living on the mucosal surface[1] and reflects the health status of the gastrointestinal tract[2]. The mucosal microbiota, intimately located on the host epithelium, has an active role in the host’s immunity and forms an essential part of the protective mucosal barrier against invading pathogens[3,4]. In general, the same main bacterial groups, Firmicutes, Bacteroidetes and Proteobacteria, dominate on the mucosa and in faeces, with the bacterial families of Ruminococcaeae, Actinobacteria, Prevotellaceae, Porhyromonadaceae, Lachnospiracheae and Bacteroidaceae being characteristic for the mucosal microbiota[5,6].
Durban and colleagues assessed the microbial community from four randomly located, pooled mucosal biopsy samples and faecal samples retrieved from 9 volunteers between 2 wk to 8 wk post colonoscopy[6]. They found that on family level taxonomy the mucosal microbiota was higher in richness and diversity and was presented by a comparatively steep rarefaction curve, whereas on species level taxonomy no clear distinction between the two sample types was seen. This could imply that the mucosal environment allows for a variety of microbes to thrive with less exhaustive competition and that, in faeces, the niches are less compartmentalized and thus the most efficiently growing bacterial families dominate. Although both types of microbiota were predominant in Firmicutes and Bacteroidetes, the microbial composition was clearly more dependent on the sample type (biopsy or faeces) than the individual being sampled and the mucosal microbiota was found to be underrepresented in the faecal samples[6].
Hong et al[5] recently published a study in which they applied an elaborate sampling schema which enabled the comparison of closely (1 cm apart) and distantly (left and right colon) located mucosal biopsies from 5 (five) subjects. Unexpectedly, the microbiota on the mucosal surface appeared to be unique, even when comparing closely situated sampling sites (1 cm distance)[5], even though the intestinal microbiota had previously been shown to be subject-specific in several studies[7-9]. Thus the study by Hong et al[5] raises further concerns regarding the representativeness of mucosal samples from a certain anatomical location and of faecal samples in relation to the overall mucosal microbiota. Possibly a single mucosal biopsy gives a less reliable picture of the status of the overall gastrointestinal tract than a faecal sample, as faeces represents an end-point view of the ecosystem.
Clearly, for a thorough evaluation of the species composition of the mucosa, faecal material is not a representative sample. However, in many cases the alterations in the quantities of selected bacterial groups or species in the gastrointestinal tract are of interest and, in such a setting, the alterations in bacterial quantities at different mucosal locations and in faeces may be more uniformly expressed, depending on the target species. Thus, the present study focused on the quantification of selected gastrointestinal bacterial groups or species being either dominant, potentially pathogenic, or often encountered on the mucosal surface.
MATERIALS AND METHODS
Subjects
Twenty patients (8 men and 12 women, aged 61 ± 15 years, range: 33-85 years), who underwent colonoscopy between June 2010 and Feb 2011 at the Sahlgrenska University Hospital Östra, Gothenburg, were included in the study. Colonoscopy was performed due to various abdominal complaints, such as diarrhoea, constipation and/or abdominal pain as well as lower gastrointestinal bleeding and/or iron-deficiency anaemia (Table 1). The prerequisite for inclusion into the study was normal-appearing mucosa in the entire colon, and thus patients with any significant pathology, such as colonic polyps, inflammatory bowel disease, malignancy, ischemic colitis etc., were excluded. The possibility of microscopic colitis was ruled out through light microscopic examination of biopsy specimens obtained from the mid-portion of the colon ascendens, as well as from the sigmoid. On the other hand, the presence of colonic diverticula was accepted provided there were no signs of acute diverticulitis and/or diverticulosis-associated colitis. Eight tissue specimens for analysis were obtained from the midportion of the ascending colon, as well from the sigmoid colon, using regular biopsy forceps. One of these specimens from each site was used for analysis of the microbiota. There were no complications related to the colonoscopy or biopsy procedures. In addition, faecal samples were collected post-colonoscopy (15 d to 105 d and unknown for 6 subjects) from 14 subjects. The ethics committee of the University of Gothenburg approved the study and written informed consent was obtained from each of the patients.
Table 1.
Demographic and clinical characteristics of study subjects
| Patient No. | Age | Gender | Days passed1 | Reason for referral to colonoscopy | Diverticulosis |
| 1 | 53 | F | 105 | Iron deficiency anaemia | Yes |
| 2 | 41 | M | NA | Constipations | No |
| 3 | 43 | M | NA | Functional diarrhoea | No |
| 4 | 64 | M | 98 | IBS | No |
| 5 | 85 | M | NA | Rectal bleeding | Yes |
| 6 | 75 | M | 15 | Iron deficiency anaemia | Yes |
| 7 | 63 | M | NA | IBS | No |
| 8 | 62 | F | 29 | IBS, constipation | No |
| 9 | 81 | M | NA | Iron deficiency anaemia | Yes |
| 10 | 72 | F | 23 | IBS, diarrhoea | Yes |
| 11 | 41 | F | 21 | Rectal bleeding | Yes |
| 12 | 74 | F | 26 | Iron deficiency anaemia | Yes |
| 13 | 75 | F | 26 | Follow-up after diverticulitis | Yes |
| 14 | 68 | F | 19 | IBS, diarrhoea | No |
| 15 | 47 | F | 19 | Follow-up after diverticulitis | Yes |
| 16 | 80 | F | 32 | Iron deficiency anaemia | Yes |
| 17 | 54 | M | NA | Rectal bleeding | No |
| 18 | 57 | F | 21 | Rectal bleeding | Yes |
| 19 | 33 | F | 24 | Diffuse abdominal pain | No |
| 20 | 51 | F | 28 | Rectal bleeding | No |
From colonoscopy to faeces sampling. F: Female; M: Male; NA: Not analysed; IBS: Irritable bowel syndrome.
Isolation of DNA and microbial quantification
Bacterial DNA was extracted from the mucosal and faecal samples with the Promega Wizard® Genomic DNA Purification Kit, A1125, (Promega Corporation, Madison, WI, United States) with some minor modifications applied. The mucosal samples were cut in half with scalpel knives and DNA was extracted from both pieces. Homogenisation of the samples was done by bead beating for 3 × 30 s at 6800 g in a 1.4 mL Bertin VK01 glass bead tube, before continuing according to the protocol. Extraction of bacterial DNA from faecal samples was performed as described previously[10]. The DNA concentrations were measured with a NanoDrop ND-1000 Spectrophotometer (NanoDrop Technologies, Wilmington, DE, United States) and samples were stored at -20 °C until quantitative polymerase chain reaction (qPCR) analysis.
The qPCR reactions were performed using Applied Biosystems Real-Time PCR system equipment (7500 Fast, Applied Biosystems, Foster City, CA, United States) and software applying in-house optimized assay conditions for the primer sequences presented in Table 2. Reactions were run in a 25 μL volume, except for the Helicobacter pylori (H. pylori) and Clostridium difficile (C. difficile)-targeting qPCR analysis, which were run in a 15 μL volume. Mucosal or faecal microbial DNA was applied as template in quantities of 25 ng or 5 ng respectively. All reactions were run in triplicate. For the human glyceraldehyde 3-phosphate dehydrogenase (GAPDH) gene assay, 5 ng of mucosal microbial DNA was used as template. In order to obtain standard curves, ten-fold serial dilutions ranging from 1 pg to 10 ng of the genomic DNA of selected bacterial species or human DNA (Table 2) were used. Results were expressed as log10 genomes per gram of sample (wet weight), taking into account the size and the 16S rDNA copy number of the standard species genome.
Table 2.
Real-time polymerase chain reaction primers, probes and assay conditions
| qPCR assay | Primers | Chemistry1 | Annealing temperature (°C) | Standard species | Primer reference | Reaction condition reference |
| Akkermansia muciniphila | CAGCACGTGAAGGTGGGGAC | FAST SYBR Green Mastermix; | 58 | Akkermancia muciniphila ATCC BAA-835 | Png et al[20] | This study |
| CCTTGCGGTTGGCTTCAGAT | 300 nmol/L each primer | |||||
| Bacteroidetes | GGCGACCGGCGCACGGG | Power SYBR Green Mastermix; | 65 | Bacteroides fragilis | Nakanishi et al[21] | This study |
| GRCCTTCCTCTCAGAACCC | 300 nmol/L each primer | ATCC 25285 | ||||
| Bifidobacterium spp. | CCTGGTAGTCCACGCCGTAA | FAST TaqMan Mastermix; | 60 | Bifidobacterium adolescentis | Mäkivuokko et al[22] | Mäkivuokko et al[22] |
| CAGGCGGGATGCTTAACG | 300 nmol/L each primer, | JCM 1275 | ||||
| ATCCAGCATCCACCG | ||||||
| 200 nmol/L probe | ||||||
| Clostridium cluster IV | GCACAAGCAGTGGAGT | SYBR Green Core Reagents; 1.5 nmol/L MgCl2, 250 nmol/L each primer | 62 | Clostridium leptum | Matsuki et al[23] | This study |
| CTTCCTCCGTTTTGTCAA | DSM 753 | |||||
| Clostridium cluster XIVab | GAWGAAGTATYTCGGTATGT | Power SYBR Green Mastermix; | 52 | Clostridium boltae | Song et al[24] | Lahtinen et al[25] |
| CTACGCWCCCTTTACAC | 300 nmol/L each primer | DSM 15670 | ||||
| Clostridium difficile | TTGAGCGATTTACTTCGGTAAAGA | FAST SYBR Green Mastermix; | 60 | Clostridium difficile | Lahtinen et al[25] | Lahtinen et al[25] |
| CCATCCTGTACTGGCTCACCT | 300 nmol/L each primer | ATCC 9689 | ||||
| Collinsella aerofaciens | CCCGACGGGAGGGGAT | Power SYBR Green Mastermix; | 60 | Collinsella aerofaciens ATCC25986 | Kassinen et al[26] | This study |
| CTTCTGCAGGTACAGTCTTGA | 300 nmol/L each primer | |||||
| Domain bacteria | CATRGHYGTCGTCAGCTCGT | FAST SYBR Green Mastermix; | 60 | Enterococcus faecium | This study | This study |
| GCGGTGTGTRCAAGRCCC | 200 nmol/L each primer | DGCC 2063 | ||||
| Enterobacteriaceae | TGCCGTAACTTCGGGAGAAGGCA | SYBR Green Core Reagents; | 58 | Enterococcus faecium DGCC2063 | Matsuda et al[27] | This study |
| TCAAGGACCAGTGTTCAGTGTC | 2 nmol/L MgCl2, | |||||
| 200 nmol/L each primer | ||||||
| Escherichia coli | ACTGGAATACTTCGGATTCAGATACGT | FAST TaqMan Mastermix; | 60 | Escherichia coli ATCC 11775 | Kaclíková et al[28] | This study |
| ATCCCTACAGATTCATTCCACGAAA | 100 nmol/L each primer, 30 nmol/L probe | |||||
| fam-CAGCAGCTGGGTTGGCATCAGTTATTCG-tamra | ||||||
| Faecalibacterium prausnitzii | CCCTTCAGTGCCGCAGT | SYBR Green Core Reagents; | 62 | Faecalibacterium prausnitzii ATCC 27768 | Rinttilä et al[16] | This study |
| GTCGCAGGATGTCAAGAC | 4 nmol/L MgCl2, | |||||
| 250 nmol/L each primer | ||||||
| Human GAPDH | GGTAAGGAGATGCTGCATTCG | Power SYBR Green Mastermix; | 60 | Human DNA | Png et al[20] | This study |
| CGCCCAATACGACCAAATCTAA | 300 nmol/L each primer | |||||
| Helicobacterium pylori | GAAGATAATGACGGTATCTAACGAATAA | FAST SYBR Green Mastermix; | 58 | Helicobacter pylori | Modified from Rinttilä et al[16] | This study |
| CATAGGATTTCACACCTGACTGACTAT | 400 nmol/L each primer | |||||
| Staplylococcus aureus | GCGATTGATGGTGATACGGTT | Power SYBR Green Mastermix; | 60 | Staphylococcus aureus | Brakstad et al[29] | This study |
| AGCCAAGCCTTGACGAACTAAAGC | 300 nmol/L each primer | ATCC 29213 | ||||
| Veillonella | AYCAACCTGCCCTTCAGA | Power SYBR Green Mastermix; | 60 | Veillonella parvula | Rinttilä et al[16] | This study |
| CGTCCCGATTAACAGAGCTT | 200 nmol/L each primer | DSM 2008 |
Manufactured by (Applied Biosystems, Foster City, CA). GAPDH: Glyceraldehyde 3-phosphate dehydrogenase; qPCR: Quantitative polymerase chain reaction.
Statistical analysis
For mucosal samples, the proportion of host DNA was estimated according to the GAPDH qPCR result and subtracted prior to calculations. Outlier values and target bacteria that were not normally distributed due to too low prevalence were removed from the data set. Normality of the data was checked with the D’Agostino and Pearson omnibus K2 test and comparisons within bacterial groups between sampling sites were done using paired t tests. Correlations between different sample types for each qPCR assay were analysed using Pearson’s correlation coefficient. Statistical analysis were performed with Prism 5 Version 5.01 (GraphPad Software, Inc., San Diego, United States).
RESULTS
Preliminary qPCR analysis from six mucosal and three faecal samples, showed an average percentage of human DNA of 60.74% ± 12.26% and 0.02% ± 0.02% respectively. Thus, the proportion of bacterial DNA was not further analysed for faecal samples as they were assumed to demonstrate 100% bacterial DNA. Among the bacterial groups and species analysed in this study, no alterations were detected between the colonic samples originating from the right and left sides of the colon (Figure 1). The clostridial clusters XIVab and IV, Bacteroidetes and Faecalibacterium prausnitzii (F. prausnitzii) were the most abundant bacteria in all sample types.
Figure 1.
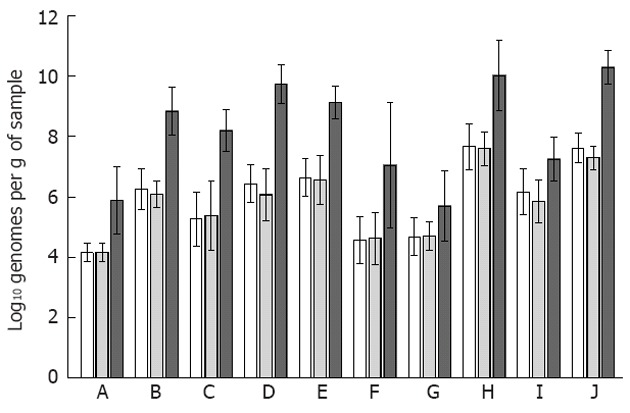
Quantities of bacterial groups detected on the mucosa and in faeces. The bacterial targets A: Akkermansia muciniphila; B: Bacteroidetes; C: Bifidobacterium spp.; D: Clostridium cluster IV; E: Clostridium cluster XIVab; F: Collinsella aerofaciens; G: Enterobacteriaceae; H: Faecalibacterium prausnitzii; I: Veillonella spp.; J: Eubacteria are represented with the three sample types side-by-side (biopsies from the right colon as white bars with pattern; biopsies from the left colon as grey bars; faecal samples with dark grey bars). The bacterial quantities between the two mucosal samples did not differ according to paired t-tests, whereas the faecal quantities of all analysed bacteria were significantly higher than those detected for either mucosal site (P < 0.05), except for Enterobacteriaceae. The error bars denote the 95% CI.
H. pylori and Staphylococcus aureus were not detected in any of the samples. C. difficile was detected in four samples, all originating from different subjects: one mucosal sample originating from the left side of the colon and three faecal samples. The C. difficile positive subjects were all female, aged 47, 74, 57 and 33 and subject to colonoscopy due to diverticulitis follow-up, iron deficiency anemia, rectal bleeding and diffuse abdominal pain. All, however, had endoscopically and histologically normal appearing mucosa. Escherichia coli (E. coli) was detected in less than half of the mucosal samples at both sites, while present in all faecal samples at log10 5.92 ± 1.04 genomes per gram of faeces. H. pylori, Staphylococcus aureus (S. aureus), C. difficile and E. coli were not included in the statistical analysis due to low prevalence.
For the whole subject group, the abundances of different bacteria appeared to follow the same trend in the mucosa and faeces (Figure 1), whereas at the individual level, only Bifidobacterium spp. quantities correlated significantly between the two mucosal sampling sites and faeces (Table 3). The two mucosal sites also correlated significantly for the quantities of Bacteroidetes, Clostridium cluster XIVab and F. prausnitzii (Table 3).
Table 3.
Pearson correlations between sample types
| Bacterial group/study period | Right colon vs left colon | Right colon vs faecal sample | Left colon vs faecal sample | |||
| Correlation coefficient | P value | Correlation coefficient | P value | Correlation coefficient | P value | |
| Akkermansia muciniphila | 0.14 | 0.63 | -0.01 | 0.97 | 0.36 | 0.26 |
| Bacteroidetes | 0.61 | 0.02 | 0.45 | 0.12 | 0.17 | 0.61 |
| Bifidobacterium | 0.71 | 0.01 | 0.62 | 0.04 | 0.81 | 0.00 |
| Clostridium Cluster IV | 0.26 | 0.39 | 0.26 | 0.44 | 0.17 | 0.64 |
| Clostridium Cluster XIVab | 0.71 | 0.00 | 0.54 | 0.06 | 0.50 | 0.09 |
| Collinsella aerofaciens | 0.38 | 0.25 | 0.63 | 0.13 | -0.87 | 0.13 |
| Eubacteria | 0.19 | 0.52 | 0.01 | 0.97 | -0.31 | 0.33 |
| Enterobacteriaceae | 0.38 | 0.20 | 0.59 | 0.03 | 0.31 | 0.35 |
| Faecalibacterium prausnitzii | 0.55 | 0.04 | 0.76 | 0.00 | 0.28 | 0.38 |
| Veillonella | 0.33 | 0.46 | 0.64 | 0.09 | 0.46 | 0.54 |
Significant correlations (P < 0.05) are designated with bold font.
DISCUSSION
The right and left segments of the colon show differences in physiology and motility, creating different environments for bacteria in the murine[11] and human[1,5] mucosa. Our aim was to analyse the quantities of predominant gastrointestinal bacteria and putative pathogenic species in relation to the site of mucosal sampling. We studied 20 patients undergoing diagnostic colonoscopy that displayed, both endoscopically and histologically, normal appearing mucosa. In addition, faecal samples were obtained from 14 subjects between 15 d to 105 d post colonoscopy to assess how well a faecal sample can represent the mucosal microbiota with a 16S rRNA gene-based qPCR. Since in whole community analysis (i.e., 16S rDNA pyrosequencing and metagenomics) the abundance data represents relative proportions of the whole with all groups affecting the result, a targeted analysis, such as qPCR, which quantifies the target independently, could allow for a less biased comparison of quantities. This possibly also results in more uniform representation between different mucosal sampling sites.
The selected bacterial quantities analysed in the present study were comparable between the two mucosal sampling sites for each individual, although previous analysis covering the overall mucosal microbiota with higher taxonomic precision have shown definite heterogeneity between different sampling sites in both humans[5] and rodents[11,12]. However, cleansing of the colon prior to colonoscopy may have distorted the mucosal microbiota at the genus level[13] and possible faecal contamination of the mucosal biopsies may diminish the degree of heterogeneity between mucosal biopsy samples. In addition, the 20 subjects that were analysed, had a considerably heterogeneous background in relation to gastrointestinal health and age, possibly resulting in a wide range of detected microbial quantities reducing the sensitivity of comparative analysis. Of the analysed bacterial groups for both mucosal and faecal quantities, only Bifidobacterium spp. correlated significantly between the different sample types (i.e., a high abundance in faeces predicted a high abundance in mucosal samples at both sites and vice versa, although the faecal quantities were on average higher than the mucosal quantities). As Bifidobacterium spp. have previously been associated with both compromised functional gastrointestinal health[7] and, in some studies, with aging[14], the subjects of the present study may present a substantially wide range of abundance for gastrointestinal bifidobacteria, enabling more evident correlation: 6 of the 20 subjects had irritable bowel syndrome or abdominal pain, and the subjects’ ages varied broadly. The two mucosal sites, the midportion of the ascending colon and the sigmoid, were also comparable in terms of Bacteroidetes, Clostridium cluster XIVab and F. prausnitzii for each subject. The wide time range between colonoscopy and faecal sampling post colonoscopy may bias the correlation analysis. Nevertheless, no statistically significant correlations were found for age, reason for referral to colonoscopy, or for the time that elapsed between colonoscopy and faecal sampling for any of the bacteria analysed (data not shown). Due to the invasive and burdensome nature of colonoscopy, no timely follow-up was possible.
In general, average levels of bacteria were higher in the faeces than in the mucosa and comparable with previously published 16S rRNA gene-targeting qPCR data[15-17]. The clostridial clusters XIVab and IV and Bacteroidetes were the most abundant bacterial groups in both sample types, in accordance with the present view of human mucosal and faecal microbiota[5-7,18]. For Enterobacteriaceae the higher abundance in faeces was not statistically significant, but a similar trend was evident between the left side mucosal and faecal samples. When analysed in relation to the eubacterial counts (i.e., as proportional values), the majority of the analysed bacteria were as prominent on the mucosa as in the faeces (data not shown), as has previously been shown with RNA-targeting fluorescent in situ hybridization for a selected set of bacterial groups[19]. However, only non-parametric analysis of the target bacteria were possible using proportional values as the data was no longer normally distributed. Nevertheless, even though Bifidobacterium spp. was the only bacterial group that correlated within individuals, for the subject group as a whole the average faecal and mucosal bacterial quantities appeared to be associated, as abundant mucosal bacteria were also abundant in faeces (Figure 1). As for the prevalence of the different bacteria, only Collinsella aerofaciens was significantly more prevalent on the mucosa (right side of the colon) than in faeces according to Fisher’s test (data not shown). F. prausnitzii was detected in all sample types with quantities above the eubacterial count (log10 7.6 ± 1.5, 7.6 ± 1.1 and 10.0 ± 2.0 bacteria per gram of sample for right colon, left colon and faecal sample, respectively; Figure 1), implying technical issues related to the analysis, as it has previously been detected at the level of log10 8 to 9[16]. The potentially pathogenic bacteria (H. pylori, S. aureus, C. difficile) were rarely detected even though 11 of the 20 study subjects were over 60 years of age and all had compromised gastrointestinal health prior to colonoscopy. E. coli, which is a common commensal gastrointestinal species, in addition to being a potential pathogen, was more prominent.
Taken together, faecal samples did not reflect quantities of bacteria in the intestinal mucosa at the individual level, except for Bifidobacterium spp. which has often been analysed in pro- and prebiotic intervention studies. Although the mucosal microbiota is site-specific in terms of use of community profiling methods, selected bacterial quantities did not differ, even between distant locations in the colon and thus less exhaustive biopsy sampling may be sufficient to evaluate bacterial quantities on the mucosa. At the group level, faecal sampling may be adequate.
ACKNOWLEDGMENTS
Julia Tennilä, Minna Eskola, Jaqueline Flach, Marianne Åkerström, and Ingrid Palmgren are acknowledged for their skilful technical assistance; We also acknowledge Ann-Louise Helminen, Helena Lindegren, Hillevi Björkquist, and Lena Munro for collecting patient samples.
COMMENTS
Background
The intestinal microbiota has been recognized as an important factor in the maintenance of good health and in the prevention of disease and has thus received a steadily increasing amount of attention in research. It has been widely acknowledged that the mucosal and faecal microbiotas are not alike and that even closely situated mucosal samples differ from each other. Thus sampling schemas highly affect the outcome when analyzing intestinal bacteria and an important research focus has been to gain a better insight into the selection of the most appropriate methodologies in each setting and to understand how the techniques compare and complement one another.
Research frontiers
The aim of the present study was to test whether quantities of distinct bacterial groups, genera or species, as opposed to a whole community analysis, could be quantified in a representative manner from mucosal samples originating from different sites in the colon and from faecal samples. Comparable bacterial quantities at different mucosal sites would allow less exhaustive biopsy sampling during colonoscopy while a correlation between mucosal and faecal quantities would allow predictions to be made on the mucosal microbiota from non-invasive faecal samples.
Innovations and breakthroughs
Real-time quantitative polymerase chain reaction (qPCR) allows independent comparison of each target bacterial group, genera and species between the different samples, whereas whole community approaches are restricted to proportional quantities. In the present study, selected gastrointestinal bacterial groups or species being either dominant, potentially pathogenic, or often encountered on the mucosal surface were quantified from three kinds of samples of up to twenty subjects. Distantly situated mucosal sites were found to have comparable bacterial quantities in an individual, whereas the faecal quantities did not reflect mucosal quantities at the individual level for most bacteria.
Applications
With quantitative analysis of selected bacteria, mucosal biopsies taken from different parts of the colon are comparable, allowing less exhaustive biopsy sampling. Faecal samples, however, poorly reflect mucosal quantities.
Terminology
Quantitative real-time PCR is based on detecting the amount of amplified product during each PCR cycle and comparing the detection threshold cycle to a standard dilution series. Primer and probe design allows a vast array of target selection and taxonomic depth to be applied.
Peer review
This study reports the analysis of several bacterial species, including resident and pathogenic bacteria present in the right and left segments of the human colon, compared with species present in faeces. The study is well conducted and the results are interesting, improving knowledge of the microbiome present in the human colon.
Footnotes
Supported by Grants from the Swedish Cancer Society and the Swedish State under the LUA-ALF Agreement
Peer reviewer: Alain L Servin, PhD, Faculty of Pharmacy, French National Institute of Health and Medical Research, Unit 756, Rue J.-B. Clément, F-922296 Châtenay-Malabry, France
S- Editor Gou SX L- Editor A E- Editor Zhang DN
References
- 1.Zoetendal EG, von Wright A, Vilpponen-Salmela T, Ben-Amor K, Akkermans AD, de Vos WM. Mucosa-associated bacteria in the human gastrointestinal tract are uniformly distributed along the colon and differ from the community recovered from feces. Appl Environ Microbiol. 2002;68:3401–3407. doi: 10.1128/AEM.68.7.3401-3407.2002. [DOI] [PMC free article] [PubMed] [Google Scholar]
- 2.Gillevet P, Sikaroodi M, Keshavarzian A, Mutlu EA. Quantitative assessment of the human gut microbiome using multitag pyrosequencing. Chem Biodivers. 2010;7:1065–1075. doi: 10.1002/cbdv.200900322. [DOI] [PMC free article] [PubMed] [Google Scholar]
- 3.Barbosa T, Rescigno M. Host-bacteria interactions in the intestine: homeostasis to chronic inflammation. Wiley Interdiscip Rev Syst Biol Med. 2010;2:80–97. doi: 10.1002/wsbm.48. [DOI] [PubMed] [Google Scholar]
- 4.Van den Abbeele P, Van de Wiele T, Verstraete W, Possemiers S. The host selects mucosal and luminal associations of coevolved gut microorganisms: a novel concept. FEMS Microbiol Rev. 2011;35:681–704. doi: 10.1111/j.1574-6976.2011.00270.x. [DOI] [PubMed] [Google Scholar]
- 5.Hong PY, Croix JA, Greenberg E, Gaskins HR, Mackie RI. Pyrosequencing-based analysis of the mucosal microbiota in healthy individuals reveals ubiquitous bacterial groups and micro-heterogeneity. PLoS One. 2011;6:e25042. doi: 10.1371/journal.pone.0025042. [DOI] [PMC free article] [PubMed] [Google Scholar]
- 6.Durbán A, Abellán JJ, Jiménez-Hernández N, Ponce M, Ponce J, Sala T, D’Auria G, Latorre A, Moya A. Assessing gut microbial diversity from feces and rectal mucosa. Microb Ecol. 2011;61:123–133. doi: 10.1007/s00248-010-9738-y. [DOI] [PubMed] [Google Scholar]
- 7.Jalanka-Tuovinen J, Salonen A, Nikkilä J, Immonen O, Kekkonen R, Lahti L, Palva A, de Vos WM. Intestinal microbiota in healthy adults: temporal analysis reveals individual and common core and relation to intestinal symptoms. PLoS One. 2011;6:e23035. doi: 10.1371/journal.pone.0023035. [DOI] [PMC free article] [PubMed] [Google Scholar]
- 8.Nam YD, Jung MJ, Roh SW, Kim MS, Bae JW. Comparative analysis of Korean human gut microbiota by barcoded pyrosequencing. PLoS One. 2011;6:e22109. doi: 10.1371/journal.pone.0022109. [DOI] [PMC free article] [PubMed] [Google Scholar]
- 9.Benson AK, Kelly SA, Legge R, Ma F, Low SJ, Kim J, Zhang M, Oh PL, Nehrenberg D, Hua K, et al. Individuality in gut microbiota composition is a complex polygenic trait shaped by multiple environmental and host genetic factors. Proc Natl Acad Sci USA. 2010;107:18933–18938. doi: 10.1073/pnas.1007028107. [DOI] [PMC free article] [PubMed] [Google Scholar]
- 10.Costabile A, Fava F, Röytiö H, Forssten SD, Olli K, Klievink J, Rowland IR, Ouwehand AC, Rastall RA, Gibson GR, et al. Impact of polydextrose on the faecal microbiota: a double-blind, crossover, placebo-controlled feeding study in healthy human subjects. Br J Nutr. 2012;108:471–481. doi: 10.1017/S0007114511005782. [DOI] [PubMed] [Google Scholar]
- 11.Wang Y, Devkota S, Musch MW, Jabri B, Nagler C, Antonopoulos DA, Chervonsky A, Chang EB. Regional mucosa-associated microbiota determine physiological expression of TLR2 and TLR4 in murine colon. PLoS One. 2010;5:e13607. doi: 10.1371/journal.pone.0013607. [DOI] [PMC free article] [PubMed] [Google Scholar]
- 12.Hu S, Wang Y, Lichtenstein L, Tao Y, Musch MW, Jabri B, Antonopoulos D, Claud EC, Chang EB. Regional differences in colonic mucosa-associated microbiota determine the physiological expression of host heat shock proteins. Am J Physiol Gastrointest Liver Physiol. 2010;299:G1266–G1275. doi: 10.1152/ajpgi.00357.2010. [DOI] [PMC free article] [PubMed] [Google Scholar]
- 13.Harrell L, Wang Y, Antonopoulos D, Young V, Lichtenstein L, Huang Y, Hanauer S, Chang E. Standard colonic lavage alters the natural state of mucosal-associated microbiota in the human colon. PLoS One. 2012;7:e32545. doi: 10.1371/journal.pone.0032545. [DOI] [PMC free article] [PubMed] [Google Scholar]
- 14.Biagi E, Candela M, Fairweather-Tait S, Franceschi C, Brigidi P. Aging of the human metaorganism: the microbial counterpart. Age (Dordr) 2012;34:247–267. doi: 10.1007/s11357-011-9217-5. [DOI] [PMC free article] [PubMed] [Google Scholar]
- 15.Gueimonde M, Ouwehand A, Huhtinen H, Salminen E, Salminen S. Qualitative and quantitative analyses of the bifidobacterial microbiota in the colonic mucosa of patients with colorectal cancer, diverticulitis and inflammatory bowel disease. World J Gastroenterol. 2007;13:3985–3989. doi: 10.3748/wjg.v13.i29.3985. [DOI] [PMC free article] [PubMed] [Google Scholar]
- 16.Rinttilä T, Kassinen A, Malinen E, Krogius L, Palva A. Development of an extensive set of 16S rDNA-targeted primers for quantification of pathogenic and indigenous bacteria in faecal samples by real-time PCR. J Appl Microbiol. 2004;97:1166–1177. doi: 10.1111/j.1365-2672.2004.02409.x. [DOI] [PubMed] [Google Scholar]
- 17.Kajander K, Krogius-Kurikka L, Rinttilä T, Karjalainen H, Palva A, Korpela R. Effects of multispecies probiotic supplementation on intestinal microbiota in irritable bowel syndrome. Aliment Pharmacol Ther. 2007;26:463–473. doi: 10.1111/j.1365-2036.2007.03391.x. [DOI] [PubMed] [Google Scholar]
- 18.Arumugam M, Raes J, Pelletier E, Le Paslier D, Yamada T, Mende DR, Fernandes GR, Tap J, Bruls T, Batto JM, et al. Enterotypes of the human gut microbiome. Nature. 2011;473:174–180. doi: 10.1038/nature09944. [DOI] [PMC free article] [PubMed] [Google Scholar]
- 19.van der Waaij LA, Harmsen HJ, Madjipour M, Kroese FG, Zwiers M, van Dullemen HM, de Boer NK, Welling GW, Jansen PL. Bacterial population analysis of human colon and terminal ileum biopsies with 16S rRNA-based fluorescent probes: commensal bacteria live in suspension and have no direct contact with epithelial cells. Inflamm Bowel Dis. 2005;11:865–871. doi: 10.1097/01.mib.0000179212.80778.d3. [DOI] [PubMed] [Google Scholar]
- 20.Png CW, Lindén SK, Gilshenan KS, Zoetendal EG, McSweeney CS, Sly LI, McGuckin MA, Florin TH. Mucolytic bacteria with increased prevalence in IBD mucosa augment in vitro utilization of mucin by other bacteria. Am J Gastroenterol. 2010;105:2420–2428. doi: 10.1038/ajg.2010.281. [DOI] [PubMed] [Google Scholar]
- 21.Nakanishi Y, Murashima K, Ohara H, Suzuki T, Hayashi H, Sakamoto M, Fukasawa T, Kubota H, Hosono A, Kono T, et al. Increase in terminal restriction fragments of Bacteroidetes-derived 16S rRNA genes after administration of short-chain fructooligosaccharides. Appl Environ Microbiol. 2006;72:6271–6276. doi: 10.1128/AEM.00477-06. [DOI] [PMC free article] [PubMed] [Google Scholar]
- 22.Mäkivuokko H, Nurmi J, Nurminen P, Stowell J, Rautonen N. In vitro effects on polydextrose by colonic bacteria and caco-2 cell cyclooxygenase gene expression. Nutr Cancer. 2005;52:94–104. doi: 10.1207/s15327914nc5201_12. [DOI] [PubMed] [Google Scholar]
- 23.Matsuki T, Watanabe K, Fujimoto J, Takada T, Tanaka R. Use of 16S rRNA gene-targeted group-specific primers for real-time PCR analysis of predominant bacteria in human feces. Appl Environ Microbiol. 2004;70:7220–7228. doi: 10.1128/AEM.70.12.7220-7228.2004. [DOI] [PMC free article] [PubMed] [Google Scholar]
- 24.Song Y, Liu C, Finegold SM. Real-time PCR quantitation of clostridia in feces of autistic children. Appl Environ Microbiol. 2004;70:6459–6465. doi: 10.1128/AEM.70.11.6459-6465.2004. [DOI] [PMC free article] [PubMed] [Google Scholar]
- 25.Lahtinen SJ, Forssten S, Aakko J, Granlund L, Rautonen N, Salminen S, Viitanen M, Ouwehand AC. Probiotic cheese containing Lactobacillus rhamnosus HN001 and Lactobacillus acidophilus NCFM® modifies subpopulations of fecal lactobacilli and Clostridium difficile in the elderly. Age (Dordr) 2012;34:133–143. doi: 10.1007/s11357-011-9208-6. [DOI] [PMC free article] [PubMed] [Google Scholar]
- 26.Kassinen A, Krogius-Kurikka L, Mäkivuokko H, Rinttilä T, Paulin L, Corander J, Malinen E, Apajalahti J, Palva A. The fecal microbiota of irritable bowel syndrome patients differs significantly from that of healthy subjects. Gastroenterology. 2007;133:24–33. doi: 10.1053/j.gastro.2007.04.005. [DOI] [PubMed] [Google Scholar]
- 27.Matsuda K, Tsuji H, Asahara T, Kado Y, Nomoto K. Sensitive quantitative detection of commensal bacteria by rRNA-targeted reverse transcription-PCR. Appl Environ Microbiol. 2007;73:32–39. doi: 10.1128/AEM.01224-06. [DOI] [PMC free article] [PubMed] [Google Scholar]
- 28.Kaclíková E, Pangallo D, Oravcová K, Drahovská H, Kuchta T. Quantification of Escherichia coli by kinetic 5’-nuclease polymerase chain reaction (real-time PCR) oriented to sfmD gene. Lett Appl Microbiol. 2005;41:132–135. doi: 10.1111/j.1472-765X.2005.01736.x. [DOI] [PubMed] [Google Scholar]
- 29.Brakstad OG, Aasbakk K, Maeland JA. Detection of Staphylococcus aureus by polymerase chain reaction amplification of the nuc gene. J Clin Microbiol. 1992;30:1654–1660. doi: 10.1128/jcm.30.7.1654-1660.1992. [DOI] [PMC free article] [PubMed] [Google Scholar]