

Abstract
The creation of caged molecules involves the attachment of protecting groups to biologically active compounds such as ligands, substrates, and drugs that can be removed under specific conditions. Photoremovable caging groups are the most common due to their ability to be removed with high spatial and temporal resolution. Here, the synthesis and photochemistry of a caged inhibitor of protein farnesyltransferase, Bhc-FTI, is described. The inhibitor was caged by alkylation of a critical thiol functional group with a Bhc moiety; while Bhc is well established as a protecting group for carboxylates and phosphates, it has not been extensively used to cage sulfhydryls. The resulting caged molecule, Bhc-FTI, can be photolyzed with UV light to release the inhibitor (FTI) that prevents Ras farnesylation, Ras membrane localization and downstream signaling. Finally, it is shown that Bhc-FTI can be uncaged by two-photon excitation to produce FTI at levels sufficient to inhibit Ras localization and alter cell morphology. Given the widespread involvement of Ras proteins in signal transduction pathways, this caged inhibitor should be useful in a plethora of studies.
Keywords: Bhc, bromohydroxycoumarin, caged thiol, enzyme inhibitor, farnesylation, Ras, photochemistry
Introduction
The creation of caged molecules involves the attachment of protecting groups to biologically active compounds such as ligands, substrates, and drugs that can be removed under specific conditions. Photoremovable caging groups are the most common due to their ability to be removed with high spatial and temporal resolution.[1] Recent developments in protecting group design that enable photocleavage via two-photon excitation have resulted in significant improvements in spatial and temporal resolution as well as in increased tissue penetration; several recent reviews of this have been published.[2] Given these useful features, caged molecules have been used in a plethora of biochemical studies ranging from probing the mechanisms of enzymatic reactions[3] to controlling cellular activity.[4] Ras proteins are small GTP-binding proteins that belong to a superfamily of regulatory polypeptides that participate in key signal transduction pathways.[5] These ubiquitous proteins, present in all eukaryotes, play crucial roles in a range of biological processes including proliferation,[6] control of cell morphology,[7] differentiation,[8] neuronal development,[9] and stem cell pluripotency.[10] Signalling via Ras-mediated pathways is also essential in many diseases including cancer,[11] autoimunity[12] and viral[13] and protozoan infections.[14] Given the critical roles of Ras proteins noted above, it would be useful to have small molecules that could inhibit Ras signaling in a spatially and temporally controllable manner. Such compounds could enable both the timing of Ras-mediated events within cells to be probed as well as the effects of spatially controlling Ras activity on celluar differentiation within a group of cells. For proper function, Ras proteins must be post-translationally modifed by the enzyme protein farnesyltransferase (PFTase).[15] Because of this requirement, the growth of cancer cells that signal via oncogenic forms of Ras can be arrested by inhibiting PFTase; [16] as a result, a large number of PFTase inhibitors have been developed including several that are available commercially including FTI, 1 (Scheme 1).[17] Hence, in principle, caged inhibitors of PFTase could be used to modulate Ras function. To design such compounds, we reasoned that functionalization of the thiol group present in 1 would greatly reduce the affinity of the resulting molecule for PFTase. Crystallographic data suggests that the thiol of 1 forms an important interaction with a Zn(II) ion positioned within the active site[18] and binding measurements with related peptides show a significant decrease in affinity upon alkylation of the corresponding thiol;[19] metal substitution experiments are also consistent with this mode of substrate-metal coordination.[20] For the caging moiety, we elected to explore the utility of the thioether-linked Bhc group.[21] While Bhc has not been extensively employed for sulfur protection,[22] it was chosen in lieu of others[23] because it has been shown to be useful for both one- and two-photon uncaging processes; that is in contrast to work with other coumarin-based thiol protecting groups that has focused primarily on one-photon cleavage. Here, we first describe the synthesis and photochemistry of a caged inhibitor of PFTase, Bhc-FTI (2). We then show that this molecule can be photolyzed with UV light to release FTI (1) that inhibits Ras localization (detected by confocal microscopy), and downstream signaling (fibroblast morphology). Finally, we show that Bhc-FTI (2) can be uncaged by two-photon excitation to produce FTI at levels sufficient to inhibit Ras localization and downstream signaling.
Scheme 1.
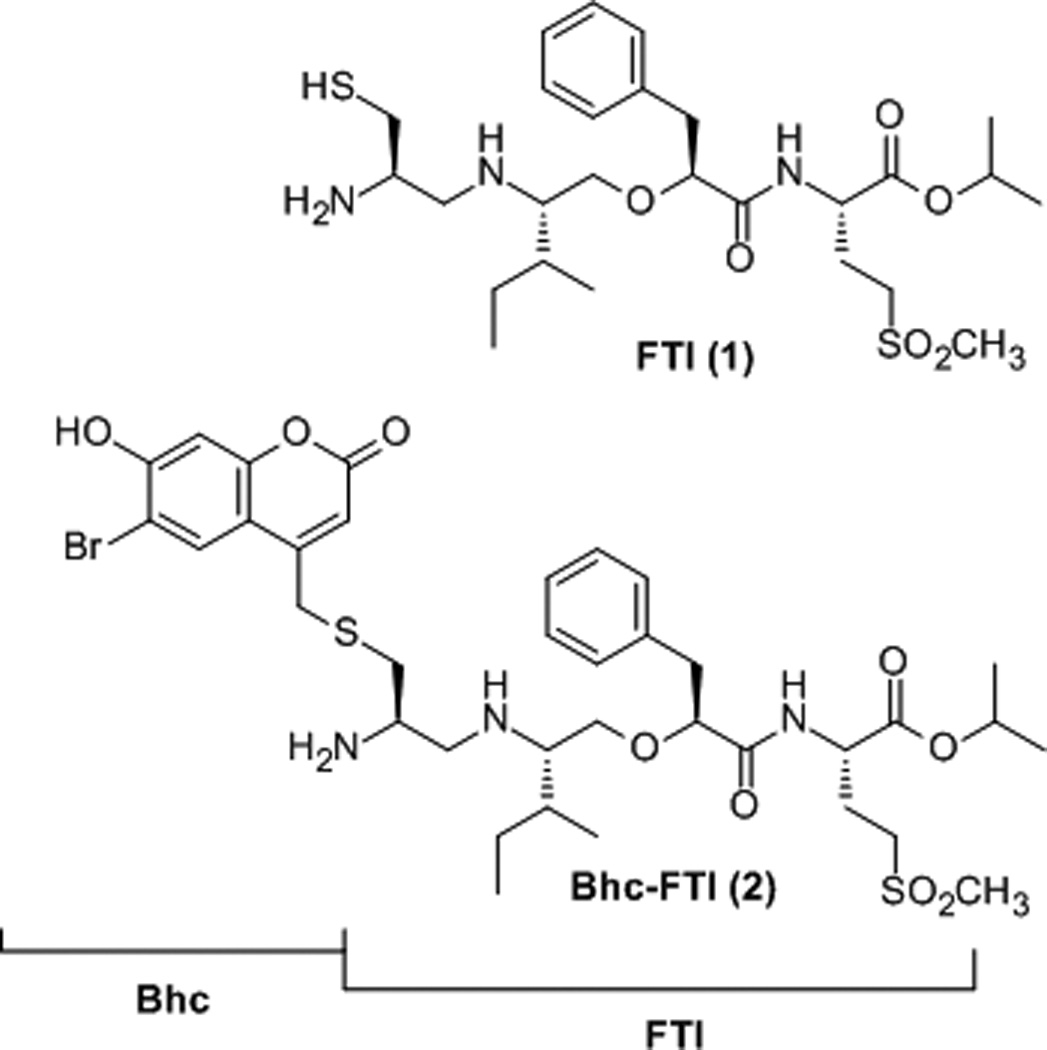
Caged compound Bhc-FTI (2) prepared from FTI (1).
Results and Discussion
Synthesis and Chemical Characterization of Caged FTI
To prepare the caged FTI analogue (2), a MOM-protected precursor of the photoremovable Bhc protecting group was synthesized; MOM-Bhc-Cl (3, Scheme 2) was elaborated from 4-bromobenzene-1,3-diol in 2 steps and this chloride was then used to alkylate FTI followed by acidolytic MOM group removal using TFA to generate the desired caged compound Bhc-FTI (2). Initially, the photolysis of the caged drug in buffered aqueous solution was studied by following the disappearance of starting material upon irradiation via HPLC analysis since the FTI product has little UV absorbance (Figure S1). Those experiments yielded a half life for Bhc-FTI of approximately 12 s in a standard Rayonet photoreactor, indicating that this molecule reacts rapidly compared with o-nitrobenzyl protected thiols (t1/2 = 5 min in the same apparatus).[23d] A quantum yield of 0.074 for Bhc-FTI uncaging was measured, which is similar to other Bhc-caged compounds.[21, 24] To characterize the products of photolysis, LC-MS experiments were performed (Figures 1 and S2). Analysis of the reaction mixture from the photolysis of Bhc-FTI (2) revealed the disappearance of starting material 2 (tR = 19 min, m/z = 812, Figure 1A) and the production of an ion at m/z = 560.3 (tR = 16.5 min, Figure 1C) in the extracted ion current chromatograms, consistent with the production of FTI (1); this was further substantiated via MS/MS analysis where the fragmentation of the new product (Figure 1F) was found to be identical with that of an authentic FTI standard (1, Figure 1E). Interestingly, MS analysis of the photolysis reaction mixture also revealed the presence of a new species with identical mass as 2 (m/z = 812) but with a different retention time (tR = 20.3 min, Figure 1D). Due to the low abundance of this isomer (less than 10% after 90% of 2 has been converted), we have not been able to unambiguously identify its structure. MS/MS analysis of that compound showed a mass spectrum distinct from that of 2 (compare Figure S2A and S2B). An ion at m/z = 471, observed in the MS/MS spectrum of both 2 and its isomer (see Figures S2 and S3) suggests that the caging group remains attached to the 2,3-diaminopropane-1-thiol residue in the rearranged product. We tentatively asign this isomeric species to be one in which the Bhc group has undergone S to N migration via a photogenerated carbocationic intermediate. Alternatively, the isomer may be a (4-methylcoumarin-3-yl) thioether derivative similar to a rearrangement product previously reported by Hagen and coworkers with a related coumarin-based protecting group. Interestingly, in that work, the formation of the isomeric product was context dependant; the isomer was observed in photolysis reactions of simple cysteine derivatives but not when the cysteine was incorporated within a peptide. Clearly, the photochemistry of coumarin-based protecting groups warrants additional study. To quantify the efficiency of photocleavage, an HPLC-based method was developed. The amount of 2 present was evaluated by its UV absorbance while the the amount of 1 produced was determined via derivatization with a thiol-reactive fluorescein iodoacetamide reagent. A plot showing the disappearance of 2 and concomitant appearance of 1 as a function of photolysis time (Figure 2) shows that 2 uncages with an efficiency of greater than 70%. Those results are consistent with measurements obtained by integration of MS EIC data (Figure S2C). Taken together, these results indicate that Bhc can be used to mask the thiol present in FTI and that it can be efficiently removed upon photolysis which suggests that it is suitable for the caging of biologically relevant thiol-containing molecules.
Scheme 2.
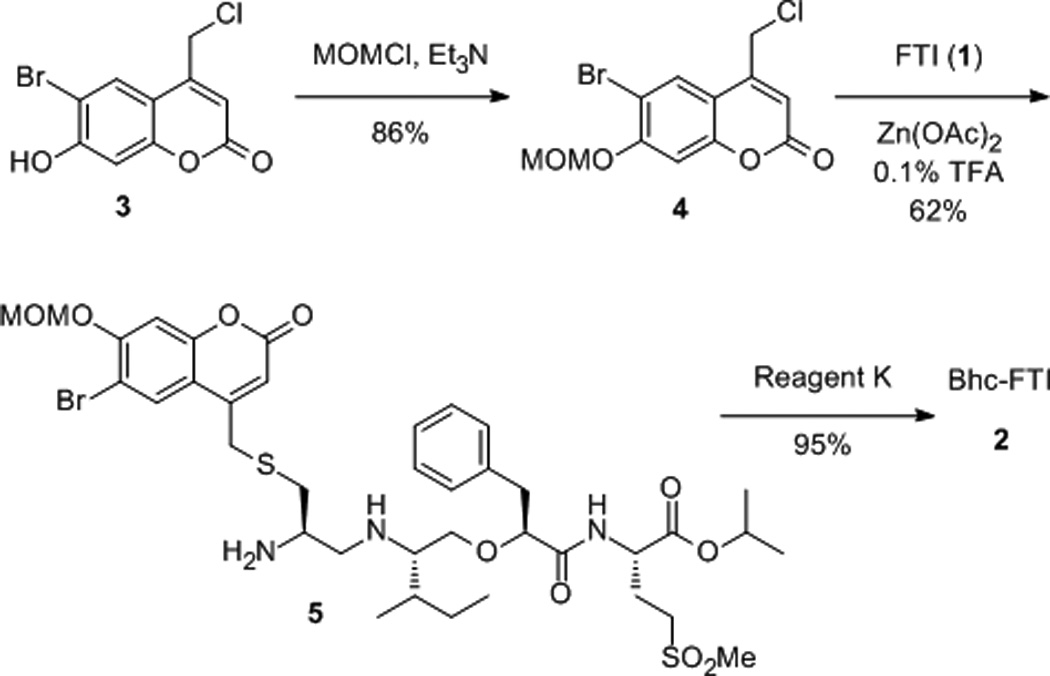
Synthesis of Bhc-FTI (2).
Figure 1.


LC-MS analysis of uncaging of 2 to form 1 by irradiation at 365 nm. Panel A: Extracted ion current (EIC) chromatogram (m/z = 810 – 815) of a sample of purified 2. Panel B: EIC chromatogram (m/z = 555 – 565) of a sample of purified 1. Panel C: EIC chromatogram (m/z = 555 – 565) of a sample of 2 after 150 s of photolysis showing the production of 1. Panel D: EIC chromatogram (m/z = 812 – 814) of a sample of 2 after 40 s of photolysis showing remaining starting material (2) and the formation of an isomeric product. Panel E: MS/MS of pure FTI (1). Panel F: MS/MS of FTI (1) produced from photolysis of 2. Irradiation was performed using a Rayonet reactor (16 × 14 W bulbs, 5 cm).
Figure 2.

Quantitation via HPLC of starting material (2) disappearance and product (1) formation as a function of irradiation time at 365 nm. For these experiments, 2 (50 µM in PBS buffer pH 7.2, 500 mM DTT) was irradiated for the times indicated using the Rayonet reactor noted above (365 nm, 16 × 14 W bulbs, 5 cm). Bhc-FTI (2) was quantified using its coumarin absorbtion while FTI (1) was quantified by derivatization with a fluorescent iodoacetamide reagent. The concentration data was fit to a simple first order process. Concentrations of Bhc-FTI (2) are represented by filled circles while concentrations of FTI (1) are shown by open circles.
Biochemical analysis of cells treated with caged FTI
Next, the biochemical effects of uncaging FTI inside cells were examined. First, the effect of FTI release on Ras processing was studied since it has been previously established that inhibition of PFTase results in blockage of subsequent processing events (proteolysis and methylation) that can be easily detected by Western blot analysis (Figure 3).[25] Photolysis at 365 nm of H-Ras MCF10A cells suspended in media in the presence of Bhc-FTI (2, 5 µM) resulted in a significant decrease in the amount of processed Ras and a concomitant increase in the level of unprocessed Ras (Figure 3, lane 4); these changes were similar to those observed with cells treated directly with FTI (lane 5). Importantly, no changes were observed in Ras processing when the cells were not irradiated (lane 3) or irradiated without Bhc-FTI (2) (lane 2). It should be noted that the above experiments were performed using less than 10 µM Bhc-FTI (2); above that concentration, some inhibition of Ras processing was observed without prior irradiation suggesting that S-alkylation of FTI greatly reduces but does not completely eliminate inhibitory activity. That observation is consistent with a previous report where alkylation of the thiol in the peptide CVIM caused a 28-fold increase in the IC50 for PFTase inhibition.[23d] It is also noteworthy that the results presented in Figure 3 were obtained after 4 min of irradiation; shorter illumination times gave measurable, but less dramatic results (Figure S4). Farnesylation of Ras is required for oncogenic mutants to cause cellular transformation because the lipid modification causes localization of Ras to the plasma membrane where it can interact with additional proteins and stimulate downstream signal transduction pathways. Accordingly, the levels of phosphorylated ERK, a known product of activated Ras, were monitored via Western blot analysis.[26] Untreated cells (Figure 3, lane 1) or cells exposed to Bhc-FTI without irradiation (lane 3) show significant levels of phosphorylated ERK (pERK1/2); in contrast, cells irradiated in the presence of Bhc-FTI (lane 4) or those exposed to free FTI (lane 5) manifested significantly decreased levels of phosphorylated ERK. Overall, these results provide compelling biochemical evidence that uncaging of Bhc-FTI results in the inhibition of Ras processing and downstream events and suggest that Ras mediated signaling can be modulated with such a caged inhibitor.
Figure 3.

Effect of Bhc-FTI (2) UV-mediated uncaging on H-Ras prenylation and ERK1/2 phosphorylation state in H-ras MCF10A cells. H-ras MCF10A cells were treated with 5 µM FTI (1) for 120 min or 5 µM Bhc-FTI (2) for 30 min and exposed to UV as indicated for 4 min in a Rayonet photoreactor (16 × 14 W bulbs, 5 cm from bulbs). After 24 h, whole cell lysates were prepared. For the H-ras immunoblot, 40 µg of protein was resolved by 15% SDS-PAGE. For the pERK1/2 immunoblot, 30 µg of protein was resolved by 10% SDS-PAGE. Total ERK2 levels were measured as a negative (loading) control since they should not change in response to treatment with the FTI. Note the faster mobility of processed Ras (P) compared with unprocessed Ras (U). Lane 1) Vehicle (0.1% DMSO (v/v)). Lane 2) Vehicle (0.1% DMSO (v/v)) followed by UV. Lane 3) Bhc-FTI (2). Lane 4) Bhc-FTI (2) followed by UV. Lane 5) FTI (1).
Cellular effects of caged FTI on Ras localization and morphology
Ultimately, the desired application of caged FTIs is to use them to control cellular properties. To assess their utility for this purpose, we first examined the ability of Bhc-FTI (2) to alter Ras localization in live cells. This was accomplished using a cell line that expresses H-Ras as an N-terminal GFP fusion (GFP-Ras).[27] Under normal conditions, GFP-Ras is farnesylated and hence localizes to the plasma membrane; in the presence of FTI (1), prenylation is inhibited resulting in cytosolic accumulation. Confocal microscope images from such experiments using Bhc-FTI (2) are shown in Figures 4 and S5. Treatment of MDCK cells expressing GFP-Ras with Bhc-FTI without irradiation (Figure 4C) results in membrane localization similar to the untreated control sample (Figure 4A). However, irradiation of the cells treated with Bhc-FTI (Figure 4D) shifts the distribution of GFP-Ras to one that is more cytosolic, similar to (although not as dramatically) what is obtained upon treatment with free FTI (Figure 4B). Control experiments in which cells were irradiated without treatment with Bhc-FTI showed no change in GFP-Ras localization (Figure 4E). These results provide direct evidence that caged FTIs can be used to modulate Ras localization in live cells. Interestingly, the change in GFP-Ras localization obtained in cells exposed to Bhc-FTI was not as great as that observed with FTI alone (compare Figure 4B with 4D). However, that difference is not consistent with the results obtained via western blotting where the extent of Ras processing and Erk activation in cells treated with photoreleased FTI was comparable to that seen with pure FTI (compare Figure 3, lanes 4 and 5). This may reflect intrinsic differences in the cell lines employed (human MCF10A versus canine MDCK) or issues related to the high levels of GFP-Ras expressed in the MDCK cell model. In reality, quantification of the extent of translocation from these images is difficult given the tightly packed nature of the MDCK cells (see Figure S5). Accordingly, we employed a different model system to explore the downstream effects of FTI release on cellular properties and complement the aforementioned biochemical results. Ciras-3 cells, a fibroblast cell line, engineered to constitutively express an oncogenic ras gene resulting in an aberrant smaller, rounded cell morphology (Figure 5A). Treatment of these cells with free FTI (1) (Figure 5B) results in their conversion to a larger and more spread phenotype. No change in morphology was observed with cells treated with Bhc-FTI without irradiation (Figure 5C). However, upon photolysis in the presence of Bhc-FTI (2) (Figure 5D), the cells take on the characteristic spread appearance signaling that the transforming effect of oncogenic ras has been abrogated. Photolysis of the cells in the absence of Bhc-FTI did not result in a change in morphology (Figure 5E). Control experiments using the parental cell line 10T1/2 that lacks oncogenic ras (Figure S7) verified that irradiation or the presence of free FTI has no effect on cell morphology due to the absence of the transforming ras mutation.
Figure 4.

GFP-H-ras localization in MDCK cells treated with Bhc-FTI (2) after 365 nm irradiation. Treatments were as follows: A) Vehicle (0.2% DMSO (v/v)). B) 1 µM FTI (1). C) 5 µM Bhc-FTI (2), no irradiation. D) 5 µM Bhc-FTI (2) plus irradiation. E) No treatment plus irradiation. F) 5 µM FTI (1). 24 h after treatment with the compounds indicated, cells in panels D and E were then exposed to UV (365 nm) for 15 min. All samples were incubated for an additional 24 h prior to imaging with a confocal microscope, 40× objective. Scale bar = 50 µm. For these experiments, photolysis reactions were performed using a UV transilluminator (6 W, 1 cm from sample).
Figure 5.

Morphology of Ciras-3 fibroblasts treated with Bhc-FTI (2) after irradiation at 365 nm. Cells were plated in the presence of the treatments noted and subjected to UV irradiation (using a 365 nm transilluminator, 6 W, 1 cm from sample) for 15 min (where indicated) and incubated for an additional 24 h prior to imaging. A) No treatment. B) 10 µM FTI (1). C) 10 µM Bhc-FTI (2). D) 10 µM Bhc-FTI (2) plus UV. E) No treatment, plus UV. F) Vehicle (0.4% DMSO (v/v)). Images were obtained from cells that were stained with AlexaFluor 488-phalloidin conjugate (after the 24 h incubation) to visualize the actin in the cell (following manufacturers protocols). Imaging was performed with an inverted confocal microscope: 60× objective. Scale bar = 50 µm.
Chemical studies of FTI release using two photon excitation
The above experiments demonstrate that caged FTIs can be uncaged in living cells and that they can be used to control Ras-mediated signaling pathways. Since it would be useful to employ these molecules for studies in tissues or whole organisms, we next investigated the ability of Bhc-FTI (2) to be uncaged by long wavelength irradiation via two-photon excitation; such a process would enable greater penetration and decrease potential UV-induced cellular damage. Accordingly, Bhc-FTI (2) was photolyzed with a Ti:sapphire laser tuned to 800 nm, and the reaction products were analyzed in a manner analogous to that described above for the one-photon experiments employing UV irradiation. The extinction coefficient of the Bhc chromophore at 400 nm is 68% of that at λmax (377 nm, Figure S8) thereby enabling two-photon excitation at 800 nm. An extracted ion current chromatogram obtained via LC-MS of the reaction mixture (Figure S9C) and subsequent MS-MS analysis (Figure S9F) confirmed the formation of FTI (1); as was noted in the UV irradiation experiments with Bhc-FTI (2), an isomer of 2 was also formed upon irradiation at 800 nm (Figure S9D). The extent of conversion of 2 to 1 via two-photon excitation was also studied. As was described above, the amount of 2 remaining was evaluated by its UV absorbance (Figure S11A) while the amount of 1 produced was determined via derivatization with a thiol-reactive fluorescein iodoacetamide reagent (Figure S11B–D). A plot showing the disappearance of 2 and concomitant appearance of 1 as a function of photolysis time (Figure 6 and Figure S11E) illustrates that approximately 20–40% of 2 can be converted to 1 after 60–120 min of irradiation; such levels of uncaging are comparable to those obtained with Bhc- and BHQ-protected carboxylates when they are irradiated via two-photon excitation in a similar size excitation volume (suitable for HPLC analysis).[21,28]
Figure 6.

Quantitation via HPLC of Bhc-FTI (2) uncaging and product (1) formation as a function of irradiation time via two-photon excitation at 800 nm. For these experiments, 2 (50 µM in PBS buffer pH 7.2, 500 mM DTT) was irradiated for the times indicated using a pulsed Ti:sapphire laser, (800 nm, 120 mW). Bhc-FTI (2) was quantified using its coumarin absorbtion while FTI (1) was quantified by derivatization with a fluorescent iodoacetamide reagent (in duplicate) and the data was fit to a simple first order process.
Analysis of cellular effects of caged FTI using two photon excitation
To study whether such levels of conversion would be physiologically useful, samples irradiated as described above were added to the MDCK cells expressing GFP-Ras and the pattern of localization was examined by confocal microscopy (Figure S11). Results similar to those observed upon UV irradiation of Bhc-FTI (2) were seen after two photon irradiation. Cells treated with the irradiated Bhc-FTI (Figure S12D) show significant cytosolic localization of GFP-Ras compared to the untreated cells (Figure S12A) suggesting that these levels of uncaging are physiologically useful. Finally, we examined the uncaging of Bhc-FTI (2) via two-photon excitation in the presence of Ciras-3 cells (Figures 7 and S13). Gratifyingly, upon irradiation at 800 nm in the presence of Bhc-FTI (2) (Figure 7D), the Ciras-3 cells take on the characteristic spread appearance signaling that the transforming effect of oncogenic Ras has been supressed. Importantly, illumination of the cells under the above conditions in the absence of Bhc-FTI did not result in a change in morphology (Figure 7E) nor did it decrease overall cell viability (Table S1).
Figure 7.

Morphology of Ciras-3 fibroblasts treated with Bhc-FTI (2). Cells were plated in the presence of the treatments noted. Following treatment, the cells were then immediately subjected to two-photon irradiation for 1 h (where indicated) and incubated an additional 24 h. A) No treatment. B) 2.5 µM FTI (1). C) 2.5 µM Bhc-FTI (2), no irradiation. D) 2.5 µM Bhc-FTI (2) + 1 h two photon irradiation. E) No treatment + 1 h two photon irradiation. F) Vehicle (0.2% DMSO (v/v)). Photolysis was performed using a Ti-sapphire laser (800 nm, 120 mW, 1 kHz, 70 fs pulses). Imaging was performed with an inverted microscope: 60× objective. Scale bar = 20 µm. Images were obtained from cells that were stained with AlexaFluor 488-phalloidin conjugate (after the 24 h incubation) to visualize the actin in the cell (following manufacturers protocols).
Conclusion
In summary, we have prepared a caged inhibitor of PFTase that liberates FTI (1) upon one- and two-photon excitation. The FTI produced, inhibits farnesylation, membrane localization of Ras and downstream signaling. While the use of Bhc-based thioethers to mask a mercaptan renders uncaging slightly less efficient (compared with phosphates and carboxylates), such thioethers are inert to background cleavage in the absence of photolysis; this property is advantageous for biological experiments that require extended incubation times. The reagent developed here sets the stage for future studies that probe Ras-mediated processes; developmental processes in C. elegans,[29] Xenopus,[30] zebrafish[31] and mice[32] involving prenylated proteins are particularly attractive for such applications. Caged FTIs such as 2 should allow the production of new prenylated proteins to be rapidly arrested at specific times during development. The ability to uncage FTI via both one- and two-photon processes also opens up the possibility of performing such experiments in tissue samples and perhaps even whole organisms where light penetration and phototoxicity are relevant concerns. This capability could be particularly useful for inhibiting prenylation at specific locations within a tissue or an organism via spatially selective irradiation. It should be noted that while they may be less selective, the caged small-molecule inhibitors of signal transduction described here have significant advantages over related antisense/RNAi-based approaches due to their ease of delivery.[33] The current challenge is to determine whether physiologically useful levels of FTI can be uncaged in those more complex systems; experiments to address that are currently in progress.
Experimental Section
General
Compound 3[21] was prepared as previously reported. All other reagents and solvents were purchased from commercial sources and used without further purification. 1H NMR spectra were recorded at 300 or 500 MHz on Varian instruments at 25 °C. HRMS was performed with a Bruker BioTOF II instrument from Bruker Daltonics, Inc. (Fremont, CA). UV spectra were obtained with a Cary 50 Bio UV-Visible Spectrophotometer (Palo Alto, CA). HPLC analysis (analytical and preparative) was performed using a Beckman model 125/166 instrument, equipped with a UV detector and C18 columns (Varian Microsorb-MV, 5 µm, 4.6 × 250 mm and Phenomenex Luna, 10 µm, 10 × 250 mm respectively). LC/MS analysis was performed employing a Thermo LCQ Deca ion trap mass spectrometer (Thermo Scientific, San Jose, CA) interfaced with an Agilent 1100 Capillary HPLC equipped with an Agilent Zorbax 300SB-C18, 5 µm, 0.5 × 150 mm column. MDCK cells stably expressing GFP-H-ras were the generous gift of Dr. Mark Philips (NYU School of Medicine). 10T1/2 and Ciras-3 mouse fibroblasts were the generous gift of Dr. Jim R. Davie (Department of Biochemistry and Molecular Biology, University of Manitoba). MCF10A and H-ras MCF10A cells were the generous gifts of Dr. Aree Moon (College of Pharmacy, Duksung Women’s University, Seoul, Korea). Dulbecco’s Modified Eagle Medium (DMEM), DMEM/F12, α-Minimum Essential Medium (α–MEM), heat-inactivated horse serum, L-glutamine, fetal bovine serum (FBS) and AlexaFluor488-phalloidin conjugate were from Invitrogen Corporation (Carlsbad, CA). Cholera toxin, insulin, and epidermal growth factor (EGF) were purchased from Sigma (St. Louis, MO). Glass-bottomed culture dishes (35 mm and 96 well plate) fitted with microwells (14 mm and 5 mm diameter for the 35 mm dishes and 96 well plate, respectively) and a No. 1.5 glass coverslip were from MatTek Corporation (Ashland, MA).
MOM-Bhc-Cl (4)
Bhc-Cl[21] (3, 200 mg, 0.69 mmol) was dissolved in THF under a nitrogen atmosphere. Triethylamine (211 µL, 1.5 mmol) was then added, followed by dropwise addition of chloromethyl methyl ether (105 µL, 1.4 mmol). The reaction was then left stirring overnight. The THF was removed in vacuo and the reaction rediluted with CHCl3 (50 mL), washed with H2O (3 × 20 mL), brine (3 × 20 mL), dried and evaporated. The crude material was then purified via column chromatography (2:1 hexane/EtOAc) to give a yellow powder in 86% yield. 1H NMR (CDCl3) δ 7.83 (1H, s) 7.17 (1H, s), 6.45 (1H, s), 5.32 (2H, s), 4.60 (2H, s), 3.52 (3H, s). HR-MS (ESI) m/z calcd for [C12H10BrClO4 + H]+ 332.9524 (79Br, 35Cl), 334.9502 (81Br, 35Cl) and 336.9479 (81Br, 37Cl); found 332.9531 (79Br, 35Cl), 334.9522 (81Br, 35Cl) and 336.9492 (81Br, 37Cl).
MOM-Bhc-FTI (5)
Compound 4 (5 mg, 16.8 µmol) and FTI (1) (5 mg, 7.9 µmol) were dissolved in a solution of 2:1:1 DMF/CH3CN/H2O containing 0.1% TFA (1 mL) under a N2 atmosphere. Zn(OAc)2 was then added (5 mg, 24 µmol) and the reaction monitored by analytical HPLC. After 2 d, the solvents were removed and the reaction purified via HPLC using a semi-preparative method (flow rate: 5 mL/min, gradient: 0% solvent B, 5 min; 0–55% B in 10 min; 55–70% B in 15 min; 70–100% B in 10 min; solvent A: H2O and 0.1% TFA, solvent B: CH3CN and 0.1% TFA). The product eluted at 57% B and was then lyophilized to give 4.5 mg of a fluffy white solid in 62% yield. 1H NMR (DMSO) δ 8.61 (1H, s) 8.13 (1H, s), 8.03 (1H, s), 7.23 (8H, m), 7.10 (1H, s), 7.00 (1H, s), 6.90 (1H, s), 6.42 (1H, s), 6.33 (1H, s), 5.42 (3H, s), 4.88 (1H, m), 4.38 (1H, m), 4.01 (3H, s), 3.98 (1H, s), 2.98 (3H, s), 2.85 (1H, m), 2.72 (1H, m), 2.18 (2H, m), 2.05 (2H, m), 1.35 (2H, m), 1.16 (6H, d), 0.80 (4H, m), 0.71 (3H, m). HR-MS (ESI) m/z calcd for [C38H54BrN3O10S2 + H]+ 856.2507 (79Br) and 858.2493 (81Br); found 856.2565 (79Br) and 858.2541 (81Br).
Bhc-FTI (2)
Compound 5 (5 mg, 5.9 µmol) was dissolved in Reagent K (825 µL TFA, 25µL H2O, 25 µL ethanedithiol, 50 µL thioanisole, 50 mg phenol) and stirred for 2 h while monitoring by analytical HPLC. After 2 h the excess TFA was removed by rotary evaporation and purified via HPLC using a semi-preparative method (flow rate: 5mL/min, gradient: 0% solvent B for 2 min; 0–50% B in 5 min; 50–80% B in 30 min; 80–100% B in 5 min; solvent A: H2O and 0.1% TFA, solvent B: CH3CN and 0.1 % TFA). The desired product eluted at 54% B and was then lyophilized to give 4.2 mg of a yellow solid in 92% yield. 1H NMR (DMSO) δ 8.61 (1H, s) 8.02 (1H, s), 7.24 (8H, m), 7.10 (1H, s), 7.00 (3H, s), 6.90 (1H, s), 6.36 (1H, s), 4.88 (1H, m), 4.37 (1H, m), 4.11 (2H, s), 3.99 (2H, s), 2.98 (3H, s), 2.88 (1H, m), 2.72 (1H, m), 2.18 (2H, m), 2.06 (2H, m), 1.35 (4H, m), 1.22 (3H, s), 1.16 (6H, d), 0.82 (4H, m), 0.75 (3H, m). HR-MS (ESI) m/z calcd for [C36H50BrN3O9S2 + H]+ 812.2245 (79Br) and 814.2230 (81Br); found 812.2252 (79Br) and 814.2242 (81Br).
Initial kinetic analysis of uncaging of 2 using 365 nm UV light
Solutions of compound 2 dissolved in PBS buffer (1 mL, 100 µM) and 1 mM DTT were placed in quartz tubes (10 × 50 mm) and irradiated with 365 nm UV light from a Rayonet reactor (16 × 14 W bulbs). Each sample was irradiated for a period ranging from 8 to 60 s. After each irradiation period, 100 µL aliquots were withdrawn and analyzed by RP-HPLC. The compounds were eluted with a gradient of 0.1% TFA in H2O and 0.1% TFA in CH3CN (Gradient 3%/mL, flow rate 1 mL/min) and monitored at 245 nm. Decay curves were plotted using Kaleidagraph 3.0 software and analyzed by non-linear regression analysis.
MS and LC-MS analysis of photolysis reactions containing 2
Samples containing 2 (10 µM, in PBS buffer containing 1 mM DTT) before and after irradiation for 2 min with 365 nm UV light from a Rayonet reactor (16 × 14 W bulbs, 5 cm distance from bulbs) were analyzed via LC-MS for the production of 1. A solution of 1 (10 µM) was also analyzed as a standard. The method utilized was as follows: flow rate: 10 µL/min, gradient: 0 % solvent B in 2 min; 0–45% solvent B in 10 min; 45–80% solvent B in 20 min; 80–100% solvent B in 5 min; solvent A: 0.1 % TFA in H2O, solvent B: 0.1% TFA in CH3CN). For two-photon experiments, samples were irradiated in a quartz cuvette (2 × 2 × 10 mm) using the laser system described below for 0–120 minutes with the laser focused to a diameter of ~1 mm.
Quantitative HPLC analysis of the extent of uncaging of 2 and the production of 1 upon photolysis
Solutions of FTI (0–50 µM) were mixed with 5-iodoacetamido fluorescein (IAF, 200 µM) in PBS buffer pH 7.2 and allowed to react for 60 min before analysis by RP-HPLC. The compounds were eluted using a C8 column with a gradient of 0.1% TFA in H2O and 0.1% TFA in MeOH (flow rate 1 mL/min, gradient: 0–40% solvent B in 20 min, 40–55% B in 15 min, 55–100% B in 5 min) and monitored by fluorescence (ex: 488, em: 510 nm). These data were used to construct a calibration curve for the derivatized FTI. For reaction analysis, solutions of 50 µM Bhc-FTI in PBS buffer pH 7.2 and 500 µM DTT were irradiated for times ranging from 0–30 sec (one-photon, 365 nm, Rayonet reactor, 16 × 14 W bulbs, 5 cm distance from bulbs) or 0–120 min (two-photon, 800 nm, Ti:sapphire laser, see below) and reacted with 700 µM IAF for 60 min before analysis by RP-HPLC. The reactions were analyzed by the aforementioned method. IAF elutes at 45% B while IAF-FTI elutes at 46% B. IAF-DTT adducts elute between 40 and 44% B.
Cell photolysis for western blot experiments using a Rayonet reactor
Aliquots of cells (3 mL) suspended in cell media (DMEM-F12) were incubated with 2 (5 µM) overnight and then placed in borosilicate glass tubes (10 × 75 mm) and irradiated with 365 nm UV light from a Rayonet reactor (16 × 14 W bulbs, 5 cm distance from bulbs). Each sample was irradiated for a period ranging from 1 to 5 min. After each irradiation, the cells were re-plated in 35 mm glass bottom microwell dishes and allowed to incubate for 24 h prior to subsequent analysis.
Photolysis of MDCK and Ciras-3 cells using a transilluminator
MDCK or Ciras-3 cells were plated in 35 mm glass bottom microwell dishes and treated as noted, followed by immediate irradiation with 365 nm UV light from a handheld lamp (UVP model UVL-56, Upland, CA, 6 W, 1 cm from sample). Cells were irradiated for time intervals ranging from 0 to 15 min. After irradiation the cells were allowed to incubate for 24 h before being visualized by microscopy. For actin staining, the cells were stained according to manufacturers protocols.
Laser apparatus for two-photon experiments
Samples were irradiated using a homebuilt, regeneratively amplified Ti:sapphire laser system.[34] That laser operates at 1 kHz with 15 µJ pulses centered at a wavelength of 800 nm. The laser pulses had a Gaussian full width at half maximum of ~70 fs. Samples were irradiated either in a quartz cuvette (2 × 2 × 10 mm, 100 µL volume) or in 96 well glass-bottomed culture dishes (MatTek Corporation, Ashland, MA) containing 100 µL samples.
Two-photon irradiation of Bhc-FTI (2) for analysis of GFP-Ras localization
A solution of 3 (100 µL, 1 mM) in PBS buffer and 1 mM DTT was placed in a quartz cuvette (2 × 2 × 10 mm) and irradiated using the laser system described above. Samples were irradiated for 30 – 120 min with the laser focused to a diameter of ~1 mm. Aliquots were removed at selected times and stored in −20 °C prior to subsequent analysis. LC-MS experiments with these samples were performed as described above. For biological experiments, an aliquot of the irradiated solution was added to MDCK cells suspended in cell media (DMEM-F12) so that the concentration of 3 (without irradiation) would be 10 µM. These cells were then incubated for 24 h before visualization via confocal microscopy.
Two-photon irradiation Ciras-3 cells in the presence of Bhc-FTI (2)
Ciras-3 cells were plated in a glass-bottomed 96 well plate and treated as noted. The cells were then immediately subjected to two-photon irradiation using 800 nm light from the laser described above focused to a spot size equal to the glass portion of the well diameter (~3 mm) for 60 or 120 min. Following irradiation, the cells were incubated an additional 24 h prior to imaging. For actin staining, the cells were stained according to manufacturers protocols.
Cell Culture and Microscopy
MDCK cells were grown in DMEM supplemented with 10% FBS. 10T1/2 and Ciras-3 cells were grown in α–MEM supplemented with FBS (10%). MCF10A and H-ras cells were grown in DMEM/F12 supplemented with horse serum (5%), hydrocortisone (0.5 mg/mL), insulin (10 mg /mL), EGF (20 ng/mL), cholera toxin (0.1 mg/mL), and L-glutamine (2 mM). All cells were grown at 37 °C with CO2 (5.0%). For experiments, cells were seeded in culture dishes at the following densities: MDCK, 1.7 × 10⁴ cells/cm2; 10T1/2, 8.3 × 10³ cells/cm2; Ciras-3, 2.5 × 10⁴ cells/cm2, MCF10A and H-ras MCF10A, 3.3 × 10⁴ cells/cm2. For microscopy, cells were seeded in 35 mm glass bottom microwell dishes (or glass–bottomed 96 well plates, depending on the experiment). Cells were treated as indicated in the figure legends, and live cells were imaged with an Olympus FluoView IX2 Inverted Confocal microscope, using a 40× or 60× objective, or with an Olympus Inverted scope, using a 20× objective.
Antibodies and immunoblotting
Cell lysates were prepared using the following buffer: 50 mM Tris-HCl, pH 7.4, 1% NP-40, 0.25% Na-deoxycholate, 150 mM NaCl, 1 mM EDTA, 1 mM PMSF, 1 mg/mL aprotinin, 1 mg/mL leupeptin, 1 mM Na3VO4, 1 mM NaF, 20 mM β-glycerophosphate. Lysates were cleared by centrifugation (16,000 × g, 10 min, 4 °C). 30–40 mg of protein was resolved using 10% or 15% SDS-polyacrylamide minigels, and then transferred to Immobilon-P PVDF membranes (Millipore, Bedford, MA). After blocking in a TBST/5% milk solution, immunoblots were incubated overnight at 4 °C using the following primary antibodies and dilutions: phospho-p44/42 MAPK (Thr-202/Tyr-204) (E10) (mouse monoclonal) (1:2000) from Cell Signaling (Beverly, MA), and total ERK2 (c-14) (rabbit polyclonal) (1:2000) and H-ras (C-20) (rabbit polyclonal) (1:500) from Santa Cruz Biotechnology (Santa Cruz, CA).. The following secondary antibodies were used: anti-mouse IgG horseradish peroxidase-linked antibody and anti-rabbit IgG horseradish peroxidase-linked antibody from Cell Signaling. Immunoblots were visualized using the Pierce SuperSignal West Pico substrate (ThermoFisher Scientific, Waltham, MA).
Supplementary Material
Acknowledgements
This work was supported by NIH grants GM 58442 (M.D.D.), CA 104609 (E.V.W.), GM 008700 (a training grant) and NSF grants CHE-0349059 (T.M.D.) and CHE-1012412 (T.M.D.).
Footnotes
Supporting information for this article is available on the WWW under http://www.chembiochem.org or from the author.
References
- 1.a) Pelliccioli AP, Wirz J. Photochem. Photobiol. Sci. 2002;1:441–458. doi: 10.1039/b200777k. [DOI] [PubMed] [Google Scholar]; b) Givens RS, Conrad PG, II, Yousef AL, Lee J-I. CRC Handb. Org. Photochem. Photobiol. (2nd Ed.) 2004. pp. 69/61–69/46. [Google Scholar]; c) Mayer G, Heckel A. Angew. Chem. Int. Ed. 2006;45:4900–4921. doi: 10.1002/anie.200600387. [DOI] [PubMed] [Google Scholar]; d) Ellis-Davies GCR. Nat. Methods. 2007;4:619–628. doi: 10.1038/nmeth1072. [DOI] [PMC free article] [PubMed] [Google Scholar]; e) Lee H-M, Larson DR, Lawrence DS. ACS Chem. Biol. 2009;4:409–427. doi: 10.1021/cb900036s. [DOI] [PMC free article] [PubMed] [Google Scholar]; f) Specht A, Bolze F, Omran Z, Nicoud J-F, Goeldner M. HFSP J. 2009;3:255–264. doi: 10.2976/1.3132954. [DOI] [PMC free article] [PubMed] [Google Scholar]; g) Riggsbee CW, Deiters A. Trends Biotechnol. 2010;28:468–475. doi: 10.1016/j.tibtech.2010.06.001. [DOI] [PMC free article] [PubMed] [Google Scholar]
- 2.a) Warther D, Gug S, Specht A, Bolze F, Nicoud JF, Mourot A, Goeldner M. Bioorg. Med. Chem. 2010;18:7753–7758. doi: 10.1016/j.bmc.2010.04.084. [DOI] [PubMed] [Google Scholar]; b) Dore TM, Wilson HC. In: Photosensitive Molecules for Controlling Biological Function. Chambers JJ, Kramer RH, editors. New York: Humana Press; 2011. pp. 57–92. [Google Scholar]
- 3.a) Loudwig S, Bayley H. In: Dynamic Studies in Biology. Goeldner M, Givens R, editors. Weinheim: Wiley-VCH; 2005. pp. 253–340. [Google Scholar]; b) Schlichting I, Almo SC, Rapp G, Wilson K, Petratos K, Lentfer A, Wittinghofer A, Kabsch W, Pai EF, et al. Nature. 1990;345:309–315. doi: 10.1038/345309a0. [DOI] [PubMed] [Google Scholar]
- 4.a) Hagen V, Bendig J, Frings S, Wiesner B, Schade B, Helm S, Lorenz D, Kaupp UB. J. Photochem. Photobiol., B. 1999;53:91–102. doi: 10.1016/s1011-1344(99)00131-1. [DOI] [PubMed] [Google Scholar]; b) Hagen V, Benndorf K, Kaupp UB. In: Dynamic Studies in Biology. Goeldner M, Givens R, editors. Weinheim: Wiley-VCH; 2005. pp. 255–252. [Google Scholar]; c) Young DD, Deiters A. Angew. Chem., Int. Ed. 2007;46:4290–4292. doi: 10.1002/anie.200700057. [DOI] [PubMed] [Google Scholar]; d) Li H, Hah J-M, Lawrence DS. J. Am. Chem. Soc. 2008;130:10474–10475. doi: 10.1021/ja803395d. [DOI] [PMC free article] [PubMed] [Google Scholar]
- 5.a) Barbacid M. Annu. Rev. Biochem. 1987;56:779–827. doi: 10.1146/annurev.bi.56.070187.004023. [DOI] [PubMed] [Google Scholar]; b) Hall A. Curr. Opin. Cell Biol. 1993;5:265–268. doi: 10.1016/0955-0674(93)90114-6. [DOI] [PubMed] [Google Scholar]
- 6.Stacey DW. Adv. Exp. Med. Biol. 1988;234:141–167. doi: 10.1007/978-1-4757-1980-2_11. [DOI] [PubMed] [Google Scholar]
- 7.Mitin N, Rossman KL, Der CJ. Curr. Biol. 2005;15:R563–R574. doi: 10.1016/j.cub.2005.07.010. [DOI] [PubMed] [Google Scholar]
- 8.Crespo P, Leon J. Cell. Mol. Life Sci. 2000;57:1613–1636. doi: 10.1007/PL00000645. [DOI] [PMC free article] [PubMed] [Google Scholar]
- 9.Hall A, Lalli G. Cold Spring Harbor Perspect. Biol. 2010;2:1–18. doi: 10.1101/cshperspect.a001818. [DOI] [PMC free article] [PubMed] [Google Scholar]
- 10.Chakrabarty K, Heumann R. Biol. Chem. 2008;389:791–798. doi: 10.1515/BC.2008.104. [DOI] [PubMed] [Google Scholar]
- 11.Young A, Lyons J, Miller AL, Phan VT, Alarcon IR, McCormick F. Adv. Cancer Res. 2009;102:1–17. doi: 10.1016/S0065-230X(09)02001-6. [DOI] [PubMed] [Google Scholar]
- 12.Mor A, Philips MR, Pillinger MH. Clin. Immunol. 2007;125:215–223. doi: 10.1016/j.clim.2007.08.008. [DOI] [PubMed] [Google Scholar]
- 13.Filippakis H, Spandidos DA, Sourvinos G. Biochim. Biophys. Acta, Mol. Cell Res. 2010;1803:777–785. doi: 10.1016/j.bbamcr.2010.03.007. [DOI] [PubMed] [Google Scholar]
- 14.Gelb MH, Van VWC, Buckner FS, Yokoyama K, Eastman R, Carpenter EP, Panethymitaki C, Brown KA, Smith DF. Mol. Biochem. Parasitol. 2003;126:155–163. doi: 10.1016/s0166-6851(02)00282-7. [DOI] [PubMed] [Google Scholar]
- 15.a) Casey PJ, Solski PA, Der CJ, Buss JE. Proc. Nat. Acad. Sci. U.S.A. 1989;86:8323–8327. doi: 10.1073/pnas.86.21.8323. [DOI] [PMC free article] [PubMed] [Google Scholar]; b) Zhang FL, Casey PJ. Annu. Rev. Biochem. 1996;65:241–269. doi: 10.1146/annurev.bi.65.070196.001325. [DOI] [PubMed] [Google Scholar]
- 16.a) Kohl NE, Omer CA, Conner MW, Anthony NJ, Davide JP, deSolms SJ, Giuliani EA, Gomez RP, Graham SL, Hamilton K. Nat Med. 1995;1:792–797. doi: 10.1038/nm0895-792. [DOI] [PubMed] [Google Scholar]; b) Sepp-Lorenzino L, Ma Z, Rands E, Kohl NE, Gibbs JB, Oliff A, Rosen N. Cancer Res. 1995;55:5302–5309. [PubMed] [Google Scholar]; c) Gelb MH, Brunsveld L, Hrycyna CA, Michaelis S, Tamanoi F, Van Voorhis WC, Waldmann H. Nat. Chem. Biol. 2006;2:518–528. doi: 10.1038/nchembio818. [DOI] [PMC free article] [PubMed] [Google Scholar]
- 17.a) Gibbs JB, Oliff A, Kohl NE. Cell. 1994;77:175–178. doi: 10.1016/0092-8674(94)90308-5. [DOI] [PubMed] [Google Scholar]; b) Gibbs RA. Curr. Opin. Drug Discovery Dev. 2000;3:585–596. [PubMed] [Google Scholar]; c) Schlitzer M, Bohm M, Sattler I, Dahse HM. Bioorg. Med. Chem. 2000;8:1991–2006. doi: 10.1016/s0968-0896(00)00138-3. [DOI] [PubMed] [Google Scholar]; d) Sebti SM, Hamilton AD. Oncogene. 2000;19:6584–6593. doi: 10.1038/sj.onc.1204146. [DOI] [PubMed] [Google Scholar]; e) Doll RJ, Kirschmeier P, Bishop WR. Curr. Opin. Drug. Disc. Devel. 2004;7:478–486. [PubMed] [Google Scholar]; f) Sousa SF, Fernandes PA, Ramos MJ. Curr. Med. Chem. 2008;15:1478–1492. doi: 10.2174/092986708784638825. [DOI] [PubMed] [Google Scholar]
- 18.a) Strickland CL, Windsor WT, Syto R, Wang L, Bond R, Wu Z, Schwartz J, Le HV, Beese LS, Weber PC. Biochemistry. 1998;37:16601–16611. doi: 10.1021/bi981197z. [DOI] [PubMed] [Google Scholar]; b) Long SB, Hancock PJ, Kral AM, Hellinga HW, Beese LS. Proc. Nat. Acad. Sci. USA. 2001;98:12948–12953. doi: 10.1073/pnas.241407898. [DOI] [PMC free article] [PubMed] [Google Scholar]
- 19.Rozema DB, Phillips ST, Poulter CD. Org. Lett. 1999;1:815–817. doi: 10.1021/ol990814o. [DOI] [PubMed] [Google Scholar]
- 20.Huang C-C, Casey PJ, Fierke CA. J. Biol. Chem. 1997;272:20–23. doi: 10.1074/jbc.272.1.20. [DOI] [PubMed] [Google Scholar]
- 21.Furuta T, Wang SSH, Dantzker JL, Dore TM, Bybee WJ, Callaway EM, Denk W, Tsien RY. Proc. Nat. Acad. Sci. USA. 1999;96:1193–1200. doi: 10.1073/pnas.96.4.1193. [DOI] [PMC free article] [PubMed] [Google Scholar]
- 22.Wosnick JH, Shoichet MS. Chem. Mater. 2007;20:55–60. [Google Scholar]
- 23.a) Chang C-y, Niblack B, Walker B, Bayley H. Chem. Biol. 1995;2:391–400. doi: 10.1016/1074-5521(95)90220-1. [DOI] [PubMed] [Google Scholar]; b) Pirrung MC, Bradley J-C. J. Org. Chem. 1995;60:1116–1117. [Google Scholar]; c) Arabaci G, Guo X-C, Beebe KD, Coggeshall KM, Pei D. J. Am. Chem. Soc. 1999;121:5085–5086. [Google Scholar]; d) DeGraw AJ, Hast MA, Xu J, Mullen D, Beese LS, Barany G, Distefano MD. Chem. Biol. Drug Des. 2008;72:171–181. doi: 10.1111/j.1747-0285.2008.00698.x. [DOI] [PMC free article] [PubMed] [Google Scholar]; e) Hagen V, Dekowski B, Kotzur N, Lechler R, Wiesner B, Briand B, Beyermann M. Chem.--Eur. J. 2008;14:1621–1627. doi: 10.1002/chem.200701142. [DOI] [PubMed] [Google Scholar]; f) Kotzur N, Briand B, Beyermann M, Hagen V. J. Am. Chem. Soc. 2009;131:16927–16931. doi: 10.1021/ja907287n. [DOI] [PubMed] [Google Scholar]
- 24.a) Montgomery HJ, Perdicakis B, Fishlock D, Lajoie GA, Jervis E, Guy GJ. Bioorg. Med. Chem. 2002;10:1919–1927. doi: 10.1016/s0968-0896(02)00050-0. [DOI] [PubMed] [Google Scholar]; b) Perdicakis B, Montgomery HJ, Abbott GL, Fishlock D, Lajoie GA, Guillemette JG, Jervis E. Bioorg. Med. Chem. 2004;13:47–57. doi: 10.1016/j.bmc.2004.10.002. [DOI] [PubMed] [Google Scholar]; c) Goard M, Aakalu G, Fedoryak OD, Quinonez C, St JJ, Poteet SJ, Schuman EM, Dore TM. Chem. Biol. 2005;12:685–693. doi: 10.1016/j.chembiol.2005.04.018. [DOI] [PubMed] [Google Scholar]
- 25.a) Gibbs JB, Pompliano DL, Mosser SD, Rands E, Lingham RB, Singh SB, Scolnick EM, Kohl NE, Oliff A. J. Biol. Chem. 1993;268:7617–7620. [PubMed] [Google Scholar]; b) Kohl NE, Koblan KS, Omer CA, Oliff A, Gibbs JB. Methods Mol. Biol. 1998;84:283–291. doi: 10.1385/0-89603-488-7:283. [DOI] [PubMed] [Google Scholar]
- 26.Kraus S, Seger R. Methods Mol. Biol. 2004;250:29–48. doi: 10.1385/1-59259-671-1:29. [DOI] [PubMed] [Google Scholar]
- 27.Choy E, Chiu VK, Silletti J, Feoktistov M, Morimoto T, Michaelson D, Ivanov IE, Philips MR. Cell. 1999;98:69–80. doi: 10.1016/S0092-8674(00)80607-8. [DOI] [PubMed] [Google Scholar]
- 28.Zhu Y, Pavlos CM, Toscano JP, Dore TM. J. Am. Chem. Soc. 2006;128:4267–4276. doi: 10.1021/ja0555320. [DOI] [PubMed] [Google Scholar]
- 29.Zand TP, Reiner J D, Der J C. Devel. Cell. 2011;20:84–96. doi: 10.1016/j.devcel.2010.12.004. [DOI] [PMC free article] [PubMed] [Google Scholar]
- 30.Goalstone ML, Sadler SE. J. Exp. Zool. 2000;286:193–203. doi: 10.1002/(sici)1097-010x(20000201)286:2<193::aid-jez11>3.0.co;2-v. [DOI] [PubMed] [Google Scholar]
- 31.Thorpe JL, Doitsidou M, Ho S-Y, Raz E, Farber SA. Dev. Cell. 2004;6:295–302. doi: 10.1016/s1534-5807(04)00032-2. [DOI] [PubMed] [Google Scholar]
- 32.Pells S, Divjak M, Romanowski P, Impey H, Hawkins NJ, Clarke AR, Hooper ML, Williamson DJ. Oncogene. 1997;15:1781–1786. doi: 10.1038/sj.onc.1201354. [DOI] [PubMed] [Google Scholar]
- 33.a) Walsh DP, Chang Y-T. Chem. Rev. 2006;106:2476–2530. doi: 10.1021/cr0404141. [DOI] [PubMed] [Google Scholar]; b) Ouyang X, Chen JK. Chem. Biol. 2010;17:590–606. doi: 10.1016/j.chembiol.2010.04.013. [DOI] [PMC free article] [PubMed] [Google Scholar]
- 34.Underwood DF, Blank DA. J. Phys. Chem. A. 2003;107:956–961. [Google Scholar]
Associated Data
This section collects any data citations, data availability statements, or supplementary materials included in this article.