Abstract
We evaluated the impact of long-term exercise on telomere dynamics in wild-derived short telomere mice (CAST/Ei) over 1 year. We observed significant telomere shortening in liver and cardiac tissues in sedentary 1-year-old mice compared with young (8 weeks) baseline mice that were attenuated in exercised 1-year-old animals. In contrast, skeletal muscle exhibited significant telomere shortening in exercise mice compared with sedentary and young mice. Telomerase enzyme activity was increased in skeletal muscle of exercise compared with sedentary animals but was similar in cardiac and liver tissues. We observed significant age-related decreases in expression of telomere-related genes that were attenuated by exercise in cardiac and skeletal muscle but not liver. Protein content of TRF1 was significantly increased in plantaris muscle with age. In summary, long-term exercise altered telomere dynamics, slowing age-related decreases in telomere length in cardiac and liver tissue but contributing to shortening in exercised skeletal muscle.
Keywords: Telomere length, Telomerase, Cast/Ei mice, Shelterin, Aging
Telomeres are stretches of repetitive DNA (5′-TTAGGGn-3′) at the ends of chromosomes that, in combination with telomere-binding proteins, serve to protect DNA ends from being detected as damaged (1). Telomere length plays an important role in maintaining genome stability and chromatin structures important to transcription (2). Telomeres shorten over time due to a combination of incomplete replication in mitotic tissues, unrepaired telomere DNA damage, and telomere end processing (3,4). In certain tissues, the ribonucleoprotein telomerase counteracts telomere shortening and can maintain and/or elongate telomeres (5). Short telomeres have been associated with cancers, age-related diseases, such as cardiovascular disease, and environmental factors (6). Numerous environmental factors have been associated with short telomeres, including modifiers of age-related diseases, with chronic exercise emerging as a factor that influences telomere length in a variety of cell types (7–10).
Physical activity and chronic endurance exercise training are associated with delayed cellular aging (11,12) and decreased morbidity and mortality (13). Longer telomere length is found in several tissues in individuals who regularly perform moderate levels of physical activity compared with sedentary peers (8–10,14). Studies by our group (8) and by Cherkas and colleagues (7) showed that telomere length was maintained in immune cells of moderately physically active individuals. Other studies in immune cells have linked fitness levels (ie, VO2max) and long-term physical activity in humans to longer immune cell telomere length (9,15). Werner and colleagues (10) showed in mouse myocardium that exercise was able to significantly increase telomerase enzyme activity and increase the expression of telomere-binding protein, TRF2, whereas decreasing gene expression of p53 and Chk2, though telomere length was unaltered after 6 months of age. In skeletal muscle, findings have been less consistent, with Ponsot and colleagues (16) reporting no change in telomere length with typical levels of physical activity, whereas two other reports indicate telomere shortening in human skeletal muscle of endurance-trained individuals (17,18). Telomere length is tissue specific (19), and exercise elicits a multiorgan stimulus that may have unique outcomes depending on the mitotic capacity of that tissue (eg, postmitotic vs mitotic cell types in the tissue of interest). Overall, these data indicate a potential “telo-protective” effect of exercise in certain tissues, consistent with the data supporting the benefits of exercise on cellular aging but may vary depending on tissue type.
Telomere length and telomerase action are regulated in part by a six-protein complex termed shelterin that functions to repress DNA damage repair (DDR) signaling (20). Shelterin’s core protein components are telomere repeat–binding factors 1 and 2 (TRF1 and TRF2) and protection of telomeres 1 (POT1a and POT1b in the mouse). TRF1 is essential in telomere length homeostasis, whereas TRF2 is critical in end-protection via T-loop formation (21,22). POT1 is vital in binding single-stranded telomere DNA and in regulating DDR at the telomere (1). When telomere shortening occurs, a DNA damage response is triggered mediated by p53 and Chk2 (23,24). Further several factors are known to associate with telomere ends, such as the heterodimer KU (70 and 80 kDa subunits), an important DDR protein. Thus, an understanding of telomere length regulation in response to aging and exercise requires examination of the shelterin components and the network of telomere-related proteins.
Thus, the purpose of the present study was to determine the effect of long-term (44 weeks) voluntary wheel running on telomere length, telomerase enzyme activity shelterin, DDR, and DNA damage response gene expression in three tissues commonly examined in relation to exercise adaptation (skeletal and cardiac muscles and liver). We performed these studies in a unique mouse strain, CAST/Ei, that displays telomere lengths shorter than many strains and similar to humans in multiple tissues (25). In the present study, three groups of mice were studied: baseline young animals (BL-8wk) and mice that either had access to a running wheel (EX-1y) or no wheel access (SED-1y) for 44 weeks from 8 to 52 weeks of age. We hypothesized that telomere length would decrease after 1 year in myocardium and liver and that exercise would attenuate any age-related shortening. In skeletal muscle, we hypothesized that telomere length would remain constant with age and exercise. We hypothesized in all tissues that messenger RNA expression of shelterin components and DNA damage repair heterodimer KU (70 and 80) would decrease with age and that exercise would attenuate these decreases, whereas DNA damage response genes p53 and Chk2 would increase with age and the increase would be blunted by exercise. We found that both telomere length and expression of telomere-related genes were altered in a tissue-specific fashion following chronic exercise exposure compared with the young and 1-year sedentary animals.
METHODS
Animals and Exercise
All animal experiments were approved by the University of Maryland Institutional Animal Care and Use Committee and conformed to the National Institutes of Health’s Guide for the Use and Care of Laboratory Animals (NIH Pub. No. 85-23, revised 1996). Tissues from 10 young (8- to 10-week-old) male CAST/Ei J mice were purchased for the BL-8wk group, and 30 additional (20 male and 10 female) 7-week-old CAST/Ei J animals were purchased for the EX-1y and SED-1y groups (Jackson Laboratory, Bar Harbor, ME). Animals were acclimated to the animal facility for 1 week prior to being randomly assigned to either an individual sedentary cage (no wheel access, n = 15) or an individual exercise cage (wheel access, n = 15). The animals were housed at 25°C on a 12-hour light–dark cycle. Animals were fed ad libitum laboratory mouse chow (Prolab RMH 3000, 5P00, LabDiet; Nestle Purina, Vevey, Switzerland) and given free access to water. The exercise cage was equipped with a voluntary running wheel and monitor system (Lafayette Instruments, Lafayette, IN). Body mass was monitored biweekly. Only 16 males and 5 females survived the full-year intervention and thus 10 EX-1y animals (eight males and two females) and 11 SED-1y animals (eight males and three females) were analyzed. The running wheels were locked for 48 hours, and food was removed 4 hours prior to euthanasia to minimize any effects of acute exercise or feeding on outcome parameters. Animals were isoflurane anesthetized and euthanized by heart dissection. Tissues were weighed, frozen in liquid nitrogen, and stored at −80°C for subsequent analyses.
Telomere Length Measurement
We used slightly modified quantitative reverse transcription–polymerase chain reaction (PCR) methods to measure telomere length (26,27). Genomic DNA was isolated and quantified using standard procedures (8). Between 12.5 and 20 ng of total genomic DNA was added to a reaction mixture containing 1XSybr Green Master mix (Applied Biosystems, Carlsbad, CA), 220 nM forward and reverse primers for the T (telomere) PCR, and 301 nM forward and 502 nM reverse for the S (single-copy gene) PCR. Cycling conditions for the T PCR were 50°C for 2 minutes, 95°C for 10 minutes followed by 30 cycles of 95°C for 10 seconds and annealing at 56°C for 1 minute with data collection. Conditions for the S PCR were 50°C for 2 minutes, 95°C for 10 minutes, 35 cycles of 95°C for 15 seconds, annealing at 56°C for 1 minute with data collection, extend 72°C for 1 minute. For the T PCR, we used the following primers (Tel 1 forward 5′-GGT TTT TGA GGG TGA GGG TGA GGG T-3′; Tel 2 reverse 5′-TCC CGA CTA TCC CTA TCC CTA TCC CT-3′) and for the S PCR (acidic ribosomal phosphatase PO, 36B4; forward 5′-AAC AAG GCA GGA GTG AGA CTG-3′; reverse 5′-CCA GGG ATA CGG GAG AAA A-3′). All samples were run in triplicate, a standard curve was run on every plate, and a reference sample was included to ensure linearity and consistency of assays. Intra-assay coefficients of variation for T and S PCRs are as follows for each tissue: liver T PCR 1.1%, S PCR 0.9%; skeletal muscle T PCR 1.8%, S PCR 1.2%; and cardiac muscle T PCR 1.32%, S PCR 0.7%. Inter-assay coefficient of variation for T PCR was 6.9% and for S PCR was 12.2%.
To confirm the quantitative reverse transcription–PCR method, mean telomere length was measured by terminal restriction fragment length analysis as described previously (28). To do this, we performed terminal restriction fragment length analysis on five to six samples across a range of telomere lengths from skeletal muscle, heart, and liver based on the quantitative reverse transcription–PCR method. Briefly, 2 μg of genomic DNA was digested overnight with Rsa1 and HpaIII (Roche, Indianapolis, IN) and electrophoresed on 0.7% agarose gels for 2 hours and visualized via ethidium bromide staining. The gel was then electrophoresed for 16 hours at 60 V to ensure adequate separation of DNA fragments. The DNA was blotted onto positively charged nylon membranes (Roche), heat cross-linked, and hybridized overnight at 50°C with the telomeric probe (digoxigenin 3′-end-labeled 5′-(CCTAAA)3) and visualized using a chemiluminescence detection system (Syngene Bio Imaging, Frederick, MD; Supplementary Figure 1). Mean terminal restriction fragment lengths were determined according to previous methods (29). We generated conversion equations from the resulting terminal restriction fragment lengths to convert T/S ratio data into kilobase data by plotting the T/S ratio of each respective sample versus the corresponding kilobase measurement from the terminal restriction fragment length assay (Supplementary Figures 1 and 2).
Telomerase Enzyme Activity
Telomerase enzyme activity was measured using a commercially available kit (Quantitative Telomerase Detection Kit; US Biomax, Rockville, MD) that utilized the Telomere Repeat Amplification Protocol (30). To ensure reliability and validity of the assay, triplicate samples, as well as internal controls provided in the kit, were assayed. Inter- and intra-assay coefficients of variation were calculated and compared with published data that used the same kit (intra- and inter-assay coefficients of variation, respectively, for gastrocnemius [10.1%, 12.6%], heart [3.7%, 5.5%], and liver [7.1%, 7.3%]). In addition, we ran heat-treated negative samples and if the heat-treated sample was at least three standard deviations above the positive sample, the data were accepted. The telomerase data were analyzed as directed by the manufacturer and as previously performed in our laboratory (8). Tissue samples were normalized for protein content prior to performing the telomerase assay. Briefly, we used the bicinchoninic acid protein assay (Pierce, Rockford, IL) to normalize each sample to 0.43 μg of protein, as previously described (8,31). Analysis was performed in one gastrocnemius, one quarter of powdered heart tissue (∼20 mg), and liver (∼50 mg) of all animals.
Reverse Transcription–PCR
Total RNA was isolated using Trizol reagent (Invitrogen, Carlsbad, CA). Reverse transcription was performed with 1 μg of total RNA using the high-capacity cDNA kit (Applied Biosystems). PCR was normalized to Gapdh for all target genes and expressed relative to the baseline group. Primer sequences for Trf1, Trf2, Ku70, Ku80, Chk2, and p53 are from Werner and colleagues ((10) Supplementary Table 1). Analysis was performed in one extensor digitorum longus (EDL), PLT (plantaris), one quarter of heart tissue (∼20 mg), and liver (∼50 mg).
Western Blotting
For GAPDH, TRF1, and TRF2, one EDL, one PLT, one quarter of powered heart (∼20 mg), and liver tissue (∼50 mg) were homogenized in lysis buffer (100 mmol/L Tris [pH 6.8], 4% sodium dodecyl sulfate, 20% glycerol, and protease inhibitor cocktail [complete mini EDTA-free; Roche]). The protein concentration of the lysate was determined as described above and 30 μg of protein was separated on 10% sodium dodecyl sulfate–polyacrylamide gels. Proteins were transferred onto polyvinylidene fluoride membranes (Immunobilon-P; Millipore, Billerica, MA) blocked in 3% non-fat dry milk for 30 minutes and exposed to primary antibodies overnight at 4°C as follows: TRF1 (C-19, SC 1977, 1:200 in 1% non-fat dry milk; Santa Cruz Biotechnologies, Santa Cruz, CA), TRF2 (H-300, SC 9143, 1:200 in 1% non-fat dry milk; Santa Cruz Biotechnologies), and GAPDH (14C10 Rabbit mAb #2118 1: 1000 in 5% bovine serum albumin; Cell Signaling, Beverly, MA). In a portion of the gastrocnemius muscle from a subset of animals, mTERT was immunoprecipitated by using 500 μg of protein and mTERT (SC-7212 H-231 rabbit polyclonal 1:200 in 1% bovine serum albumin; Santa Cruz Biotechnologies) with agarose-A protein goat anti-rabbit IgG (Sigma Aldrich, St. Louis, MO). All products were visualized using enhanced chemiluminescence (Pierce) and horseradish peroxidase as a substrate on the Gene Gnome (Syngene Bio Imaging).
Statistical Analysis
Relative band intensities from agarose gels and immunoblots were analyzed using NIH ImageJ software. All values, unless otherwise stated, are presented as mean ± SEM. Pearson product-moment correlations were calculated to correlate the percent change of telomere length and TRF1 and TRF2 percent change in protein content in SED-1y and EX-1y animals. Analysis of variance was used to analyze the three-group data using SAS version 9.2. Only omnibus p values of the three-group analyses of variance are reported in the text of the Results, with specific contrast significance values reported in the figure legends. All analyses were repeated considering sex as an independent variable and similar tendencies were observed (data not shown); thus, we collapsed all data by sex for presentation purposes. We acknowledge that the small sample of females in our cohort should be considered exploratory, but we did not observe any effects of sex for any analysis. Differences were considered significant at p < .05.
RESULTS
Chronic Exercise Modifies Age-Related Changes in Telomere Length and Telomerase Enzyme Activity
Twenty-seven CAST/Ei mice were analyzed at two different ages and with or without access to a cage-mounted, computer-monitored running wheel for 44 weeks. Skeletal muscles (gastrocnemius, EDL, and PLT), cardiac muscle, and liver were studied from young 8-week-old (BL-8wk, n = 6) mice, 1-year-old sedentary animals (SED-1y, n = 11, standard housing conditions), and 1-year-old exercised animals (EX-1y, n = 10). Mean voluntary running distance in the EX-1y group was 6475 ± 1396 m/d (mean ± SE, Table 1 and Supplementary Figure 3) over the 1-year intervention. Body and heart masses were significantly smaller in the BL-8wk animals compared with the SED-1y and EX-1y animals; gastrocnemius mass was not different among groups (Table 1). Liver mass was smaller in the BL-8wk animals compared with EX-1y but was not different from SED-1y. The differences in body and heart masses were expected and likely due to post-natal growth. Exercise did not change body mass, heart, liver, or gastrocnemius mass in comparison to SED-1y (Table 1).
Table 1.
Animal Tissue Weights and Other Phenotypes
| Phenotype | BL-8wk | EX-1y | SED-1y | p Values | |||
| Overall | Age | Exercise | BL vs EX | ||||
| Body mass (g) | 12.9 ± 0.45 (n = 6) | 16.4 ± 0.35 (n = 10) | 16.9 ± 0.34 (n = 11) | <.01 | <.01 | .28 | <.01 |
| Voluntary running distance (m/d) | — | 6475 ± 1396 (n = 10) | — | — | — | — | — |
| Gastrocnemius mass (g) | 0.07 ± 0.006 (n = 6) | 0.07 ± 0.007 (n = 4) | 0.08 ± 0.080 (n = 3) | .59 | .35 | .38 | .97 |
| Heart mass (g) | 0.08 ± 0.006 (n = 6) | 0.13 ± 0.007 (n = 4) | 0.12 ± 0.008 (n = 3) | <.01 | <.01 | .60 | <.01 |
| Liver mass (g) | 0.41 ± 0.06 (n = 6) | 0.57 ± 0.05 (n = 10) | 0.53 ± 0.04 (n = 11) | .13 | .12 | .59 | .05 |
Note : Data are presented as means ± SEM. Overall = p value for overall analysis of variance; age is the comparison between BL and SED; exercise is the comparison between EX and SED. BL-8wk = baseline 8 weeks of age; EX = exercise; SED = sedentary; 1y = 1 year of age.
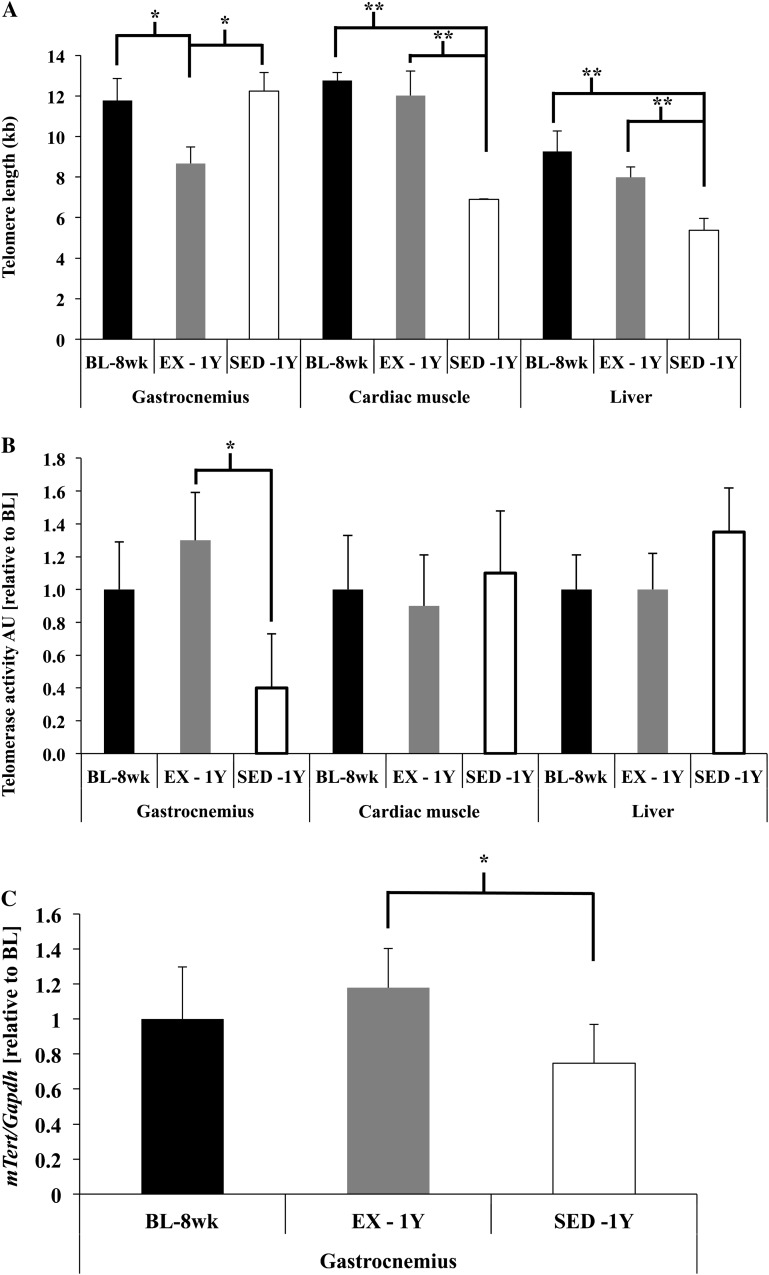
Skeletal muscle (gastrocnemius) telomere length was not significantly different due to age (p = .7) but was significantly shorter in the EX-1y animals compared with both SED-1y and BL-8wk mice (both p < .05; Figure 1A). In contrast, cardiac muscle and liver telomere lengths were shorter due to age (BL-8wk vs SED-1y, both p < .01) and exercise significantly attenuated those decreases (EX-1y vs SED-1y, both p < .01), whereas EX-1y and BL-8wk were similar in both tissues (Figure 1A). Telomerase enzyme activity was greater in gastrocnemius muscle of EX-1y animals compared with SED-1y mice (p = .02; Figure 1B) and was similar to BL-8wk. Telomerase enzyme activity was not different between BL-8wk and SED-1y, indicating no change in telomerase activity with age in skeletal muscle. Telomerase reverse transcriptase (mTERT) protein content was detected with immunoprecipitation in skeletal muscles of EX-1y and SED-1y but was not statistically different between groups (p = .30, data not shown). Although we were not able to detect a difference in protein content of mTERT, we were able to detect differences in mTert messenger RNA gene expression similar to the enzyme activity assay. mTert gene expression was significantly greater in EX-1y animals compared with SED-1y animals (p = .02) but was not different compared with BL-8wk; SED-1y and BL-8wk had similar mTert gene expression (Figure 1C.). Telomerase enzyme activity was not altered by age or exercise in either cardiac muscle or liver (Figure 1B).
Figure 1.
Telomere length and telomerase enzyme activity. (A) Telomere length (T/S ratio converted to kilobases) of skeletal muscle (gastrocnemius), cardiac muscle, and liver from baseline (BL-8wk), exercise (EX-1y), and sedentary (SED-1y) animals. Skeletal muscle telomere length was not different between the BL-8wk and SED-1y animals (p = .7) but was significantly shorter in EX-1y compared with both SED-1y and BL-8wk animals (both p < .05). Cardiac muscle telomere length was significantly different between BL-8wk and SED-1y animals (p < .001) and between EX-1y and SED-1y animals (p = .01) but was similar between BL-8wk and EX-1y. Liver telomere length was significantly different between BL-8wk and SED-1y animals (p = .005) and between EX-1y and SED-1y animals (p = .003) but was similar between BL-8wk and EX-1y. (B) Telomerase enzyme activity as determined by qualitative reverse transcription–polymerase chain reaction Telomere Repeat Amplification Protocol assay in skeletal muscle (gastrocnemius), cardiac muscle, and liver from BL-8wk, EX-1y, and SED-1y animals (values normalized to baseline across tissues). Telomerase enzyme activity was different between EX-1y and SED-1y animals in skeletal muscle (p = .03) but was not different between any groups in heart or liver. (C) mTert gene expression in gastrocnemius was significantly greater in EX-1y compared with SED-1y (p = .02) and EX-1y and BL-8wk were similar. mTert gene expression was similar between SED-1y and BL-8wk. *Indicate significantly different at p < .05. **Indicate significantly different at p < .01. BL-8wk = baseline 8 weeks of age; EX = exercise; SED = sedentary; 1y = 1 year of age.
Chronic Exercise Alters the Gene Expression and Protein Content of Some Shelterin Components
To determine if telomere-protecting components were altered in skeletal muscle, cardiac muscle, and liver in response to exercise, we measured gene expression of several telomere length–regulating genes. We examined two different skeletal muscles, the PLT (mixed oxidative and glycolytic phenotype, located in the triceps surae and activated in wheel running behavior) and the EDL (glycolytic phenotype, anterior of leg, minimal activation with wheel running (32)).
Plantaris.—
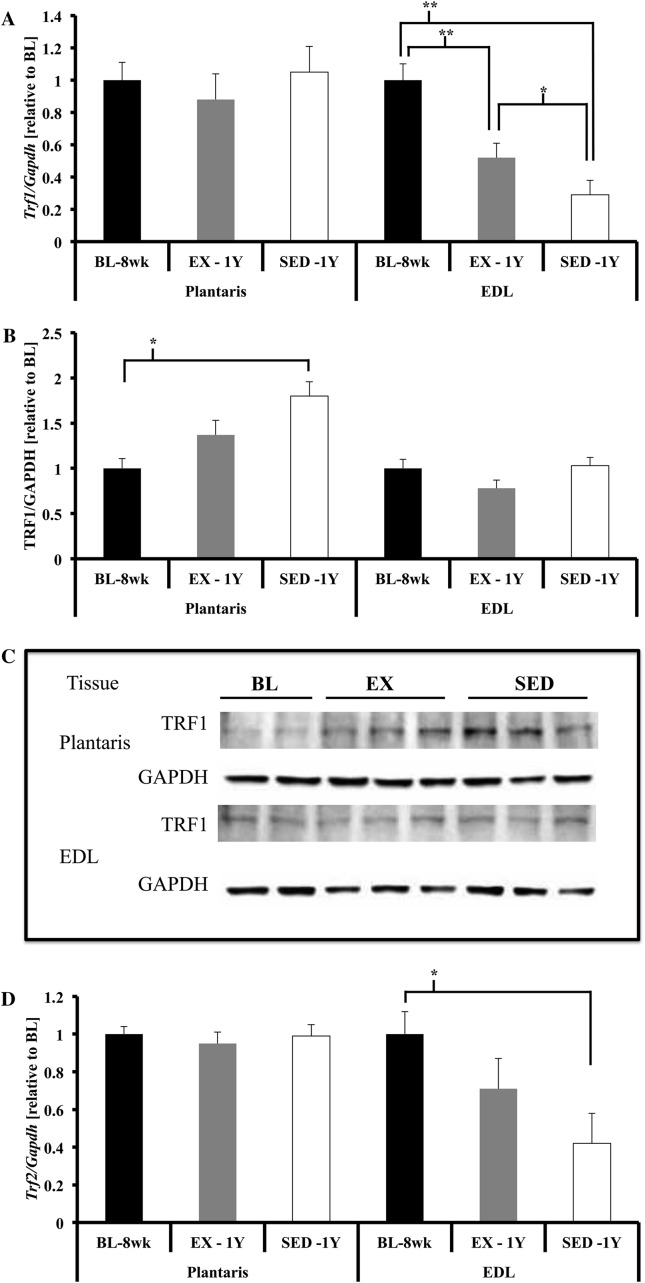
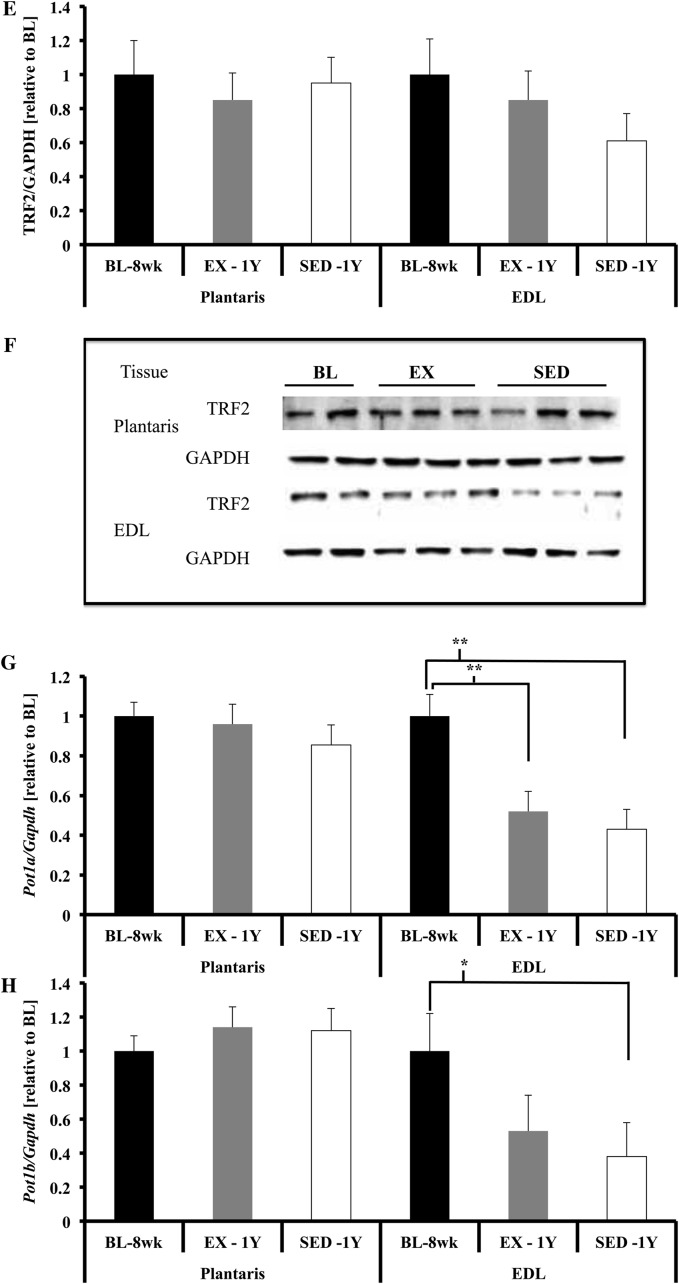
Gene expression of Trf1, Trf2, Pot1a, and Pot1b (telomere repeat–binding factor 1 and 2, protection of telomeres 1a and 1b, respectively) were not different across the three groups (data shown in Figures 2A, D, and G and 4H). We measured protein content of TRF1, TRF2, and GAPDH (normalization/loading control) in plantaris. TRF1 protein content tended to be higher in SED-1y compared with BL-8wk (p = .06; Figure 2B and C); no differences were observed for protein content of TRF2 (Figure 2E and F). We also correlated the change in telomere length with the change in TRF1 and TRF2 protein content. We hypothesized that as telomere length decreased with age, shelterin protein content would also decrease (33). We did not observe any significant correlations of percent change in telomere length with percent change in TRF1 or TRF2 protein content in the PLT (data not shown).
Figure 2.
Shelterin component gene expression in skeletal muscles. (A) Trf1 gene expression was not different in plantaris. Trf1 gene expression was significantly lower in extensor digitorum longus (EDL) of SED-1y and EX-1y animals compared with BL-8wk (both p < .01). SED-1y had lower gene expression of Trf1 compared with EX-1y animals (p = .05). (B and C) There was a significant increase in TRF1 protein content in PLT of SED-1y animals compared with BL-8wk animals (p = .02). TRF1 protein content was not different in EDL. (D) Trf2 gene expression was not different in plantaris. Trf2 gene expression was significantly lower in EDL of SED-1y compared with BL-8wk animals (p < .05). EX-1y tended to have greater Trf2 gene expression compared with SED-1y (p = .07) but was not different from BL-8wk. (E and F) No differences for either EDL or PLT TRF2 protein content were observed. (G) Pot1a gene expression was not different in plantaris. Pot1a gene expression was significantly lower in EDL of SED-1y compared with BL-8wk (age p < .01) but was similar to EX-1y. Pot1a gene expression was significantly lower in EDL of EX-1y compared with BL-8wk (p < .01). (H) Pot1b gene expression was not different in plantaris. Pot1b gene expression was significantly lower in EDL of SED-1y compared with baseline (p = .05); all other comparisons were nonsignificant. Messenger RNA abundance was assessed by reverse transcription–polymerase chain reaction and target genes were normalized to Gapdh (A, D, G, H, and I). GAPDH was used as a loading reference for protein content (B, C, E, and F). Results of densitometric analysis and representative immunoblot images are shown. *Indicate significantly different at p < .05. **Indicate significantly different at p < .01. BL-8wk = baseline 8 weeks of age; EX = exercise; SED = sedentary; 1y = 1 year of age.
Figure 4.
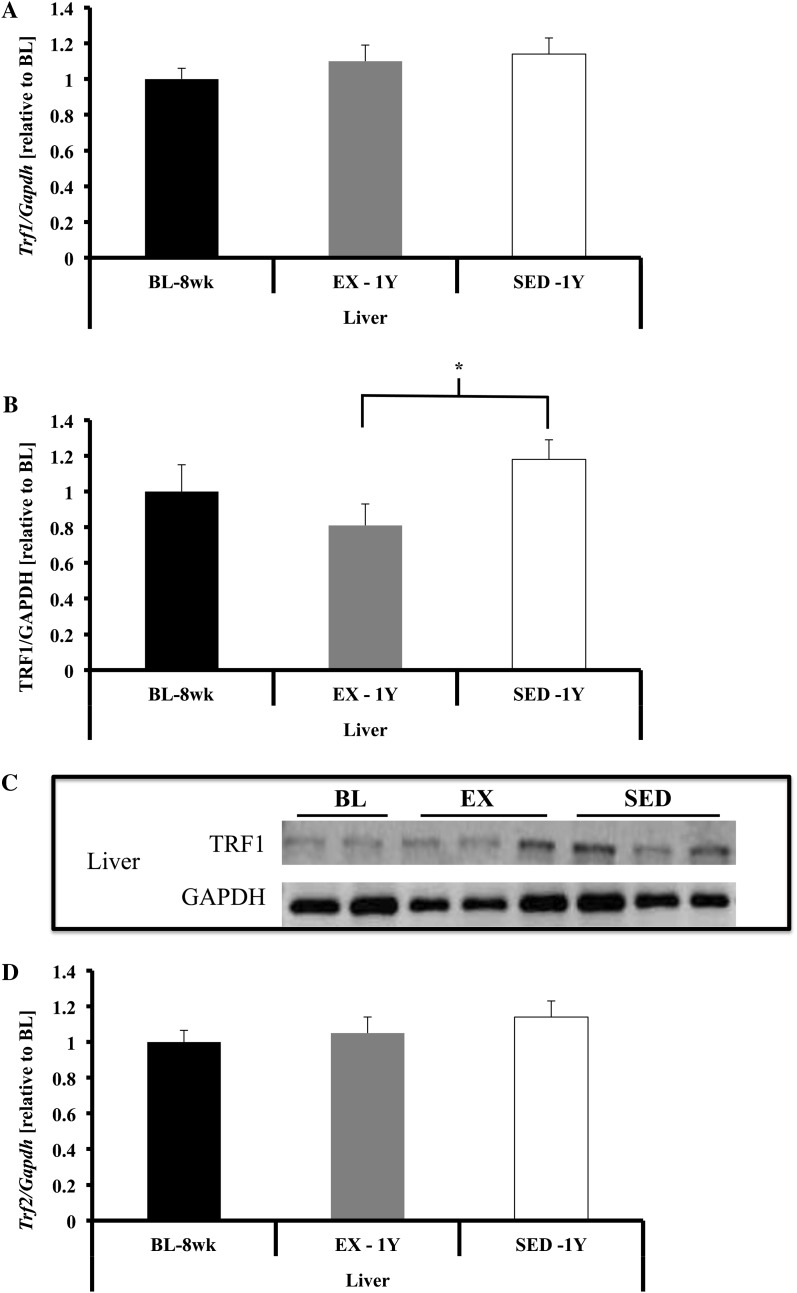
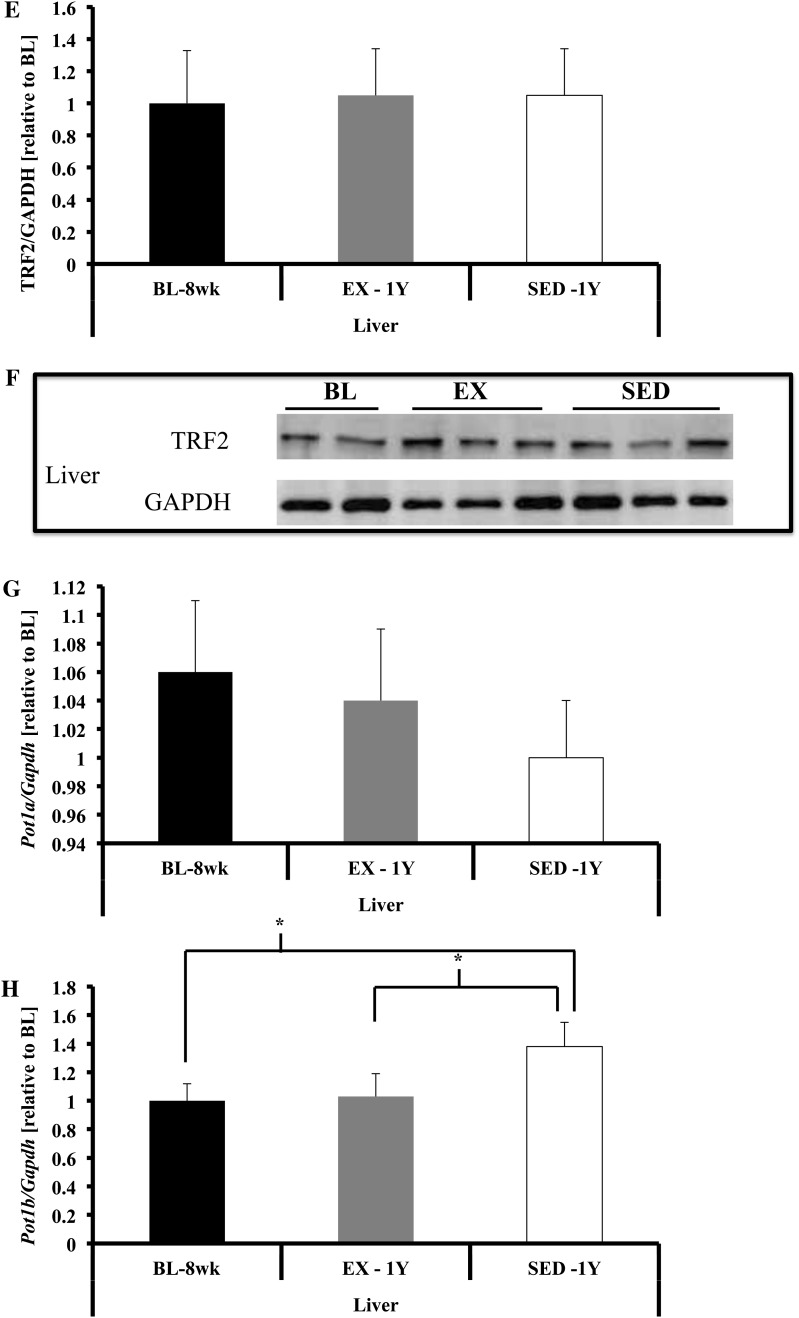
Shelterin component gene expression in liver. (A) Trf1 gene expression was not different. (B and C) TRF1 protein content was greater in SED-1y compared with EX-1y animals (p = .03) and was not different between any other groups. (D) Trf2 gene expression was not different in liver tissues. (E and F) TRF2 protein content was not significantly different in liver. (G) Pot1a gene expression was not different in liver tissues. (H) Pot1b gene expression was lower in liver of BL-8wk and EX-1y compared with SED-1y (p = .03 and p = .05, respectively) and BL-8wk and EX-1y were similar. Messenger RNA abundance was assessed by reverse transcription–polymerase chain reaction and target genes were normalized to Gapdh (A, D, G, H, and I). GAPDH was used as a loading reference for protein content (B and E). Results of densitometric analysis and representative immunoblot images are shown. *Indicate significantly different at p < .05. BL-8wk = baseline 8 weeks of age; EX = exercise; SED = sedentary; 1y = 1 year of age.
Extensor digitorum longus.—
Trf1 and Trf2 gene expression was lower in SED-1y compared with BL-8wk, and exercise blunted this age-related reduction (Trf1, p < .01; Trf2, p = .01; Figure 2A and D). Pot1a and Pot1b gene expression was also lower in SED-1y compared with BL-8wk, but no exercise effect was observed (Pot1a, p < .01; Pot1b, p = .14; Figure 2G and H).
TRF1 and TRF2 protein content (normalized to GAPDH) were not different among groups (p = .62 and p = .31, respectively; Figure 2B and E). These data indicate that long-term voluntary exercise is a potent telomere-altering stimulus both for telomere length and telomere-related gene expression in skeletal muscle. The different responses between skeletal muscle types likely stems from intrinsic (muscle fiber type composition) and extrinsic factors (neuronal activation levels) during wheel running (32).
We observed a significant negative correlation between the percent change in telomere length and percent change in TRF2 protein content (r = −.71, p = .02, data not shown) in the EX-1y EDL. This result did not support our hypothesis and indicates that the animals that lost the greatest percentage of telomere length maintained or increased TRF2 protein content. This finding supports data that when TRF2 is overexpressed in vitro, it results in telomere shortening (22). We did not observe any significant correlations between the change in telomere length and the percent change in TRF1 protein content in EDL.
Cardiac muscle.—
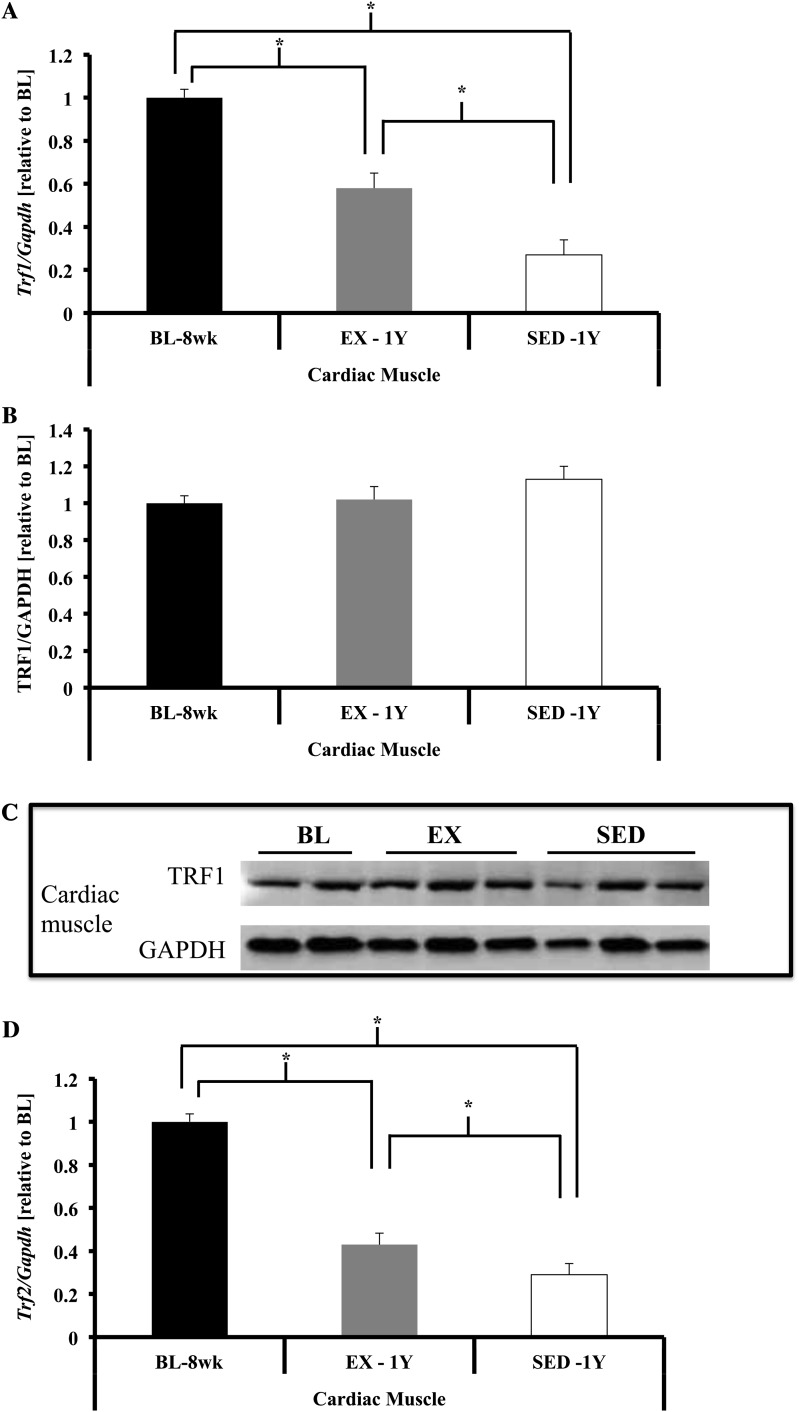
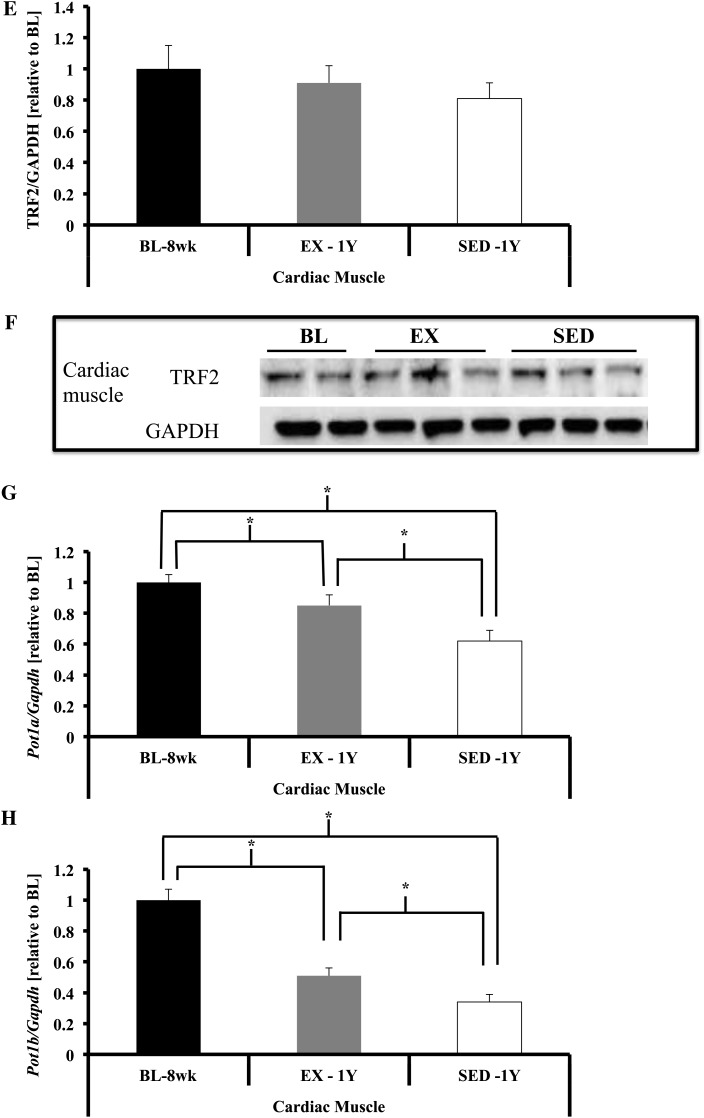
In general, cardiac muscle showed reduced gene expression of telomere-related genes with age that were attenuated with long-term voluntary exercise. Specifically, gene expression of Trf1, Trf2, Pot1a, and Pot1b were lower in SED-1y compared with BL-8wk, and this age-related reduction was blunted in EX-1y for all four genes (all p < .05; Figure 3). We measured TRF1 and TRF2 protein content (normalized to GAPDH) and did not observe any differences among groups (p = .76 and p = .59, respectively; Figure 3B and E).
Figure 3.
Shelterin component gene expression in cardiac tissue. (A) Trf1 gene expression was significantly lower in cardiac muscle of SED-1y compared with both BL-8wk and EX-1y (both p < .01), whereas EX-1y was lower compared with BL-8wk (p < .01). (B and C) No differences were observed for TRF1 protein between groups. (D) Trf2 gene expression was significantly lower in SED-1y compared with both BL-8wk and EX-1y (both p < .01), and BL-8wk was greater than EX-1y (p < .01). (E and F) TRF2 protein content was not different between any groups. (G) Pot1a gene expression was significantly lower in SED-1y compared with both BL-8wk and EX-1y (both p < .01), and BL-8wk tended to be greater than EX-1y (p = .06). (H) Pot1b gene expression was significantly lower in SED-1y compared with both BL-8wk and EX-1y (p < .01 and p = .02, respectively), and BL-8wk was greater than EX-1y (p < .01). Messenger RNA abundance was assessed by reverse transcription–polymerase chain reaction, and target genes were normalized to Gapdh (A, D, G, H, and I). GAPDH was used as a loading reference for protein content (B, C, E, and F). Results of densitometric analysis and representative immunoblot images are shown. *Indicate significantly different at p < .05. **Indicate significantly different at p < .01. BL-8wk = baseline 8 weeks of age; EX = exercise; SED = sedentary; 1y = 1 year of age.
Several significant correlations were observed in the heart for percent change in telomere length and percent change in TRF1 and TRF2 protein content in SED-1y or EX-1y animals. We observed in SED-1y animals a significant negative correlation (r = −.76, p = .01) for telomere length and TRF1 protein content and a significant positive correlation (r = .74, p = .01) for telomere length and TRF2 protein content. In the EX-1y animals, we observed a significant negative correlation (r = −.74, p = .02) between change in telomere length and change in TRF1 protein content with no correlation for TRF2. These data offer partial support for the hypothesis that as telomere length is reduced, shelterin components are also reduced; TRF2 and telomere length in the SED-1y animals were positively correlated, supporting our hypothesis. However, similar to the skeletal muscle data, TRF1 protein content changed in the opposite direction of telomere length.
Liver.—
In liver, no significant differences were observed for gene expression of Trf1, Trf2, or Pot1a across any groups (Figure 4). Gene expression of Pot1b tended to be lower in BL-8wk compared with SED-1y (p = .06) with no difference in EX-1y (Figure 4H). TRF1 protein content tended to be higher in SED-1y compared with EX-1y (p = .09; Figure 4B), whereas TRF2 was not different among groups (Figure 4E). We did not observe any significant correlations between the change in telomere length and the change in shelterin components in liver tissue.
Gene Expression of Factors Involved in DNA Damage Repair and DNA Damage Response Are Altered With Age and Exercise
Plantaris.—
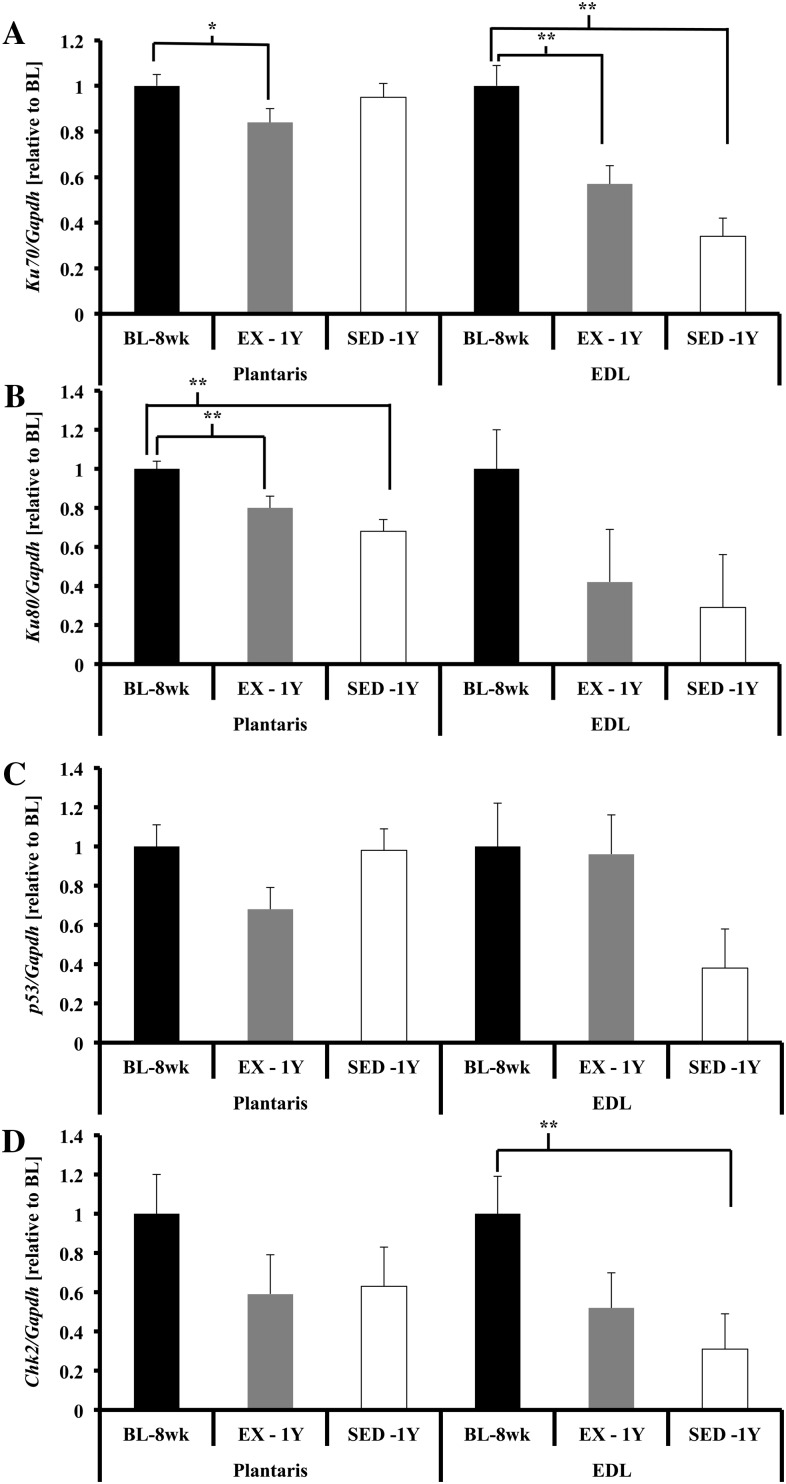
In addition to these shelterin components, several other proteins have been found to be transiently associated with telomeres, such as DDR heterodimer KU (KU70/KU80 (34)). Gene expression of Ku70 was not different among groups, whereas Ku80 gene expression was lower in SED-1y compared with BL-8wk, and chronic exercise tended to attenuate this reduction (Ku70, p = .10; Ku80, p < .01; Figure 5A and B). To investigate whether chronic exercise resulted in altered gene expression of proteins critical to the response to DNA damage, we measured p53 and Chk2; gene expression was not different across groups for either gene (Figures 5C and 6D).
Figure 5.
DNA damage repair and response gene expression in skeletal muscle. (A) Ku70 gene expression was significantly lower in plantaris of EX-1y compared with BL-8wk (p = .03), no other comparisons were significantly different. Ku70 gene expression was significantly lower in extensor digitorum longus (EDL) of SED-1y compared with BL-8wk and tended to be lower than EX-1y (p < .01 and p = .07, respectively). BL-8wk was greater than EX-1y (p <.01). (B) Ku80 gene expression was significantly lower in SED-1y compared with BL-8wk and EX-1y (p < .01 and p = .06, respectively) in plantaris. BL-8wk was greater than EX-1y (p < .01). Ku80 gene expression was significantly lower in SED-1y and EX-1y compared with BL-8wk (p = .02 and p = .05, respectively) in EDL. SED-1y and EX-1y were similar. (C) p53 gene expression was not different in plantaris. p53 gene expression tended to be lower in EDL of SED-1y compared with BL-8wk and EX-1y (both p = .06). BL-8wk and EX-1y were similar. (D) Chk2 gene expression was not different in plantaris. Chk2 gene expression was significantly lower in EDL of SED-1y compared with BL-8wk (p < .01). No other groups were different. Messenger RNA abundance was assessed by reverse transcription–polymerase chain reaction, and target genes were normalized to Gapdh. Results of densitometric analysis are shown. *Indicate significantly different at p < .05. **Indicate significantly different at p < .01. BL-8wk = baseline 8 weeks of age; EX = exercise; SED = sedentary; 1y = 1 year of age.
Figure 6.
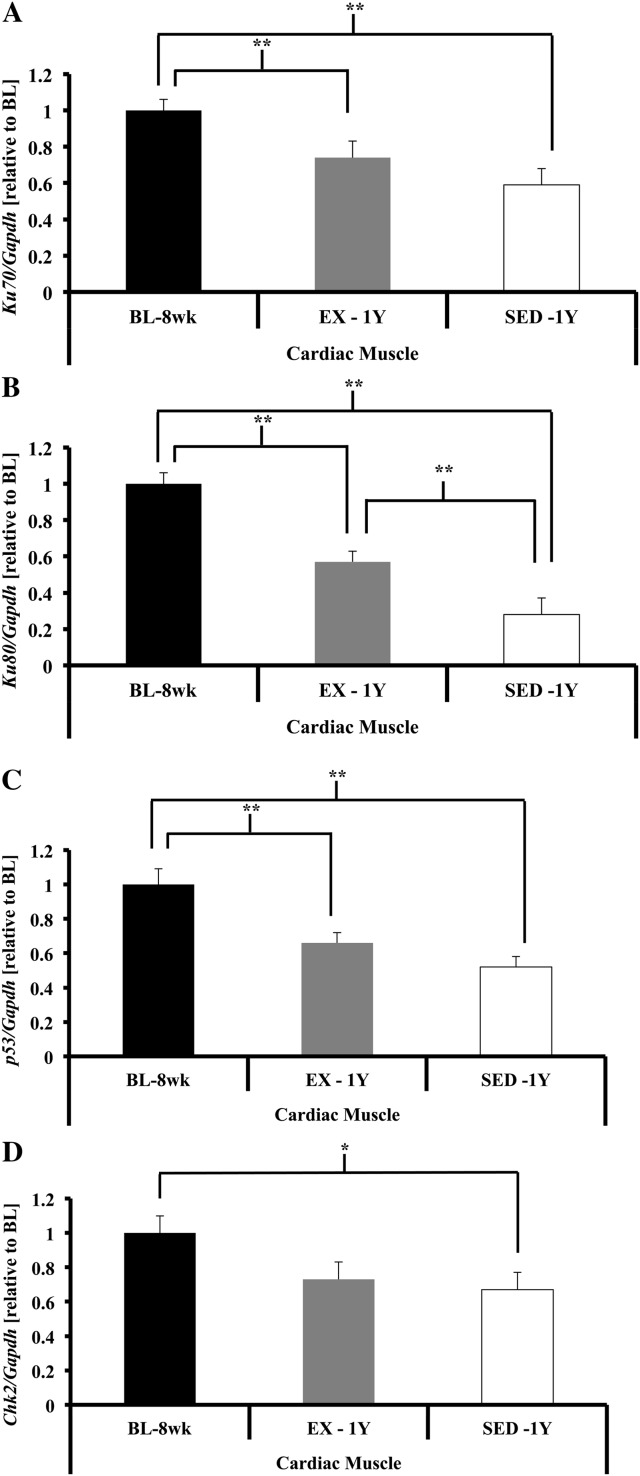
DNA damage repair and response in cardiac tissue. (A) Ku70 gene expression was significantly lower in cardiac muscle of SED-1y animals compared with BL-8wk and tended to be lower compared with EX-1y (p < .01 and p = .09, respectively). BL-8wk had greater gene expression compared with EX-1y (p < .01). (B) Ku80 gene expression was significantly lower in cardiac muscle of SED-1y compared with BL-8wk and EX-1y animals (p < .01, and p < .01, respectively). BL-8wk had greater gene expression compared with EX-1y (p < .01). (C) p53 gene expression tended to be lower in cardiac muscle of SED-1y compared with BL-8wk and tended to be lower compared with EX-1y animals (p < .01 and p = .12, respectively). BL-8wk had significantly greater gene expression compared with EX-1y (p < .01). (D) Chk2 gene expression tended to be significantly lower in cardiac muscle of SED-1y compared with BL-8wk animals (p = .03). No other comparisons were significantly different. Messenger RNA abundance was assessed by reverse transcription–polymerase chain reaction, and target genes were normalized to Gapdh. Results of densitometric analysis are shown. *Indicate significantly different at p < .05. **Indicate significantly different at p < .01. BL-8wk = baseline 8 weeks of age; EX = exercise; SED = sedentary; 1y = 1 year of age.
Extensor digitorum longus.—
Ku70 and Ku80 gene expression was lower in SED-1y compared with BL-8wk, and exercise blunted this reduction (Ku70, p < .01; Ku80, p = .05; Figure 5A and B). p53 and Chk2 gene expression tended to be lower in SED-1y compared with BL-8wk, with a tendency for exercise to attenuate the age-related reduction (p53, p = .08; Chk2, p = .06; Figure 5C and 5D).
Cardiac muscle.—
Ku70, Ku80, and p53 exhibited similar responses, with BL-8wk gene expression higher than SED-1y and EX-1y (all p < .05; Figures 6). A similar pattern was seen for Chk2 gene expression, but the differences did not reach significance (p = .07; Figure 6D).
Liver.—
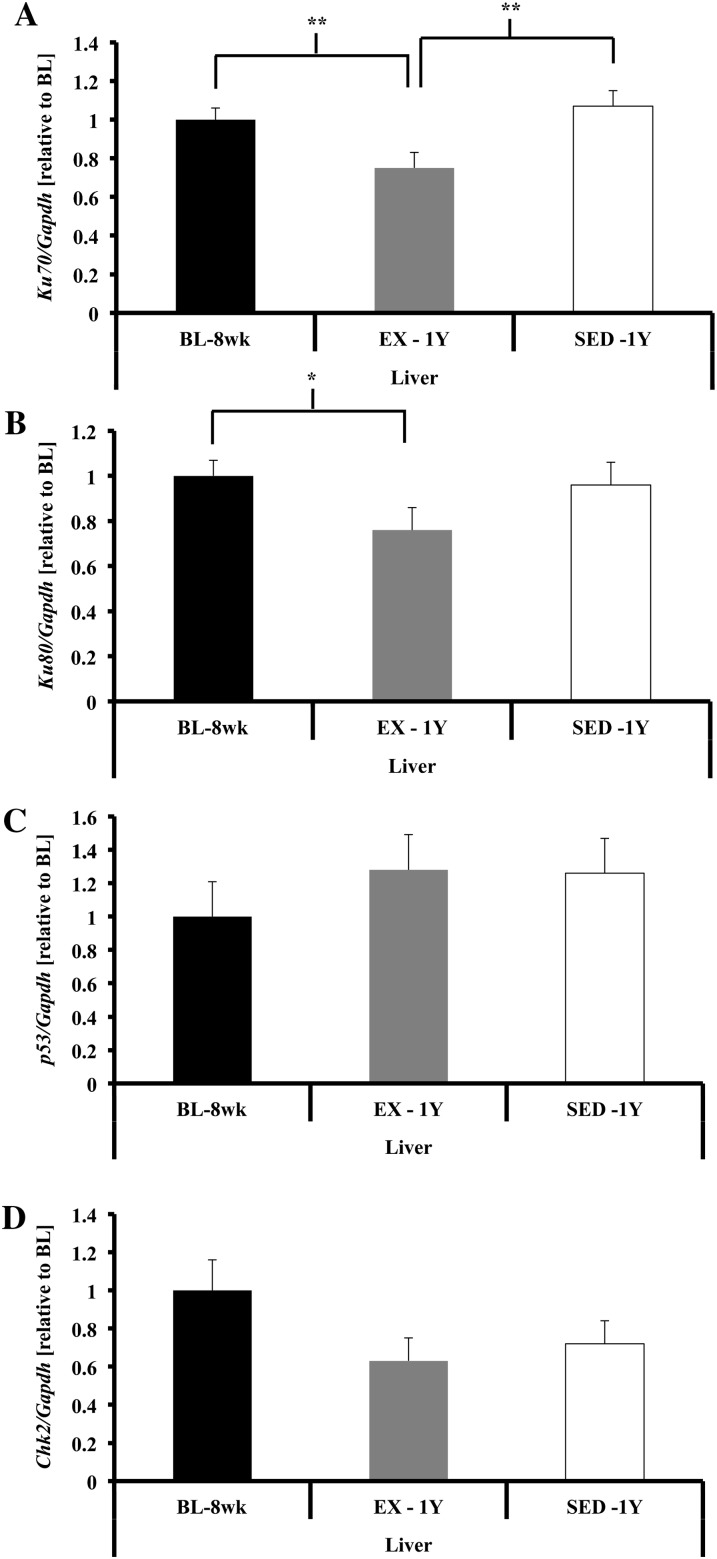
Gene expression of Ku70 was lower in EX-1y compared with both BL-8wk and SED-1y (p < .01; Figure 7A), and a similar tendency was seen for Ku80 (p = .07; Figure 7B). No differences were observed for p53 or Chk2 in any comparison (Figure 7C and D).
Figure 7.
DNA damage repair and response in liver tissue. (A) Ku70 gene expression was higher in liver of SED-1y compared with EX-1y but was similar to BL-8wk (p < .01). BL-8wk had greater gene expression compared with EX-1y (p = .01). (B) Ku80 gene expression was higher in liver of BL-8wk and tended to be higher in SED-1y compared with EX-1y animals (p = .03 and p = .07, respectively). SED-1y and BL-8wk were similar. (C) p53 gene expression was not different in liver tissue. (D) Chk2 gene expression was not different in liver tissue. Messenger RNA abundance was assessed by reverse transcription–polymerase chain reaction, and target genes were normalized to Gapdh. Results of densitometric analysis are shown. *Indicate significantly different at p < .05. **Indicate significantly different at p < .01. BL-8wk = baseline 8 weeks of age; EX = exercise; SED = sedentary; 1y = 1 year of age.
DISCUSSION
We show for the first time that chronic voluntary exercise prevented age-induced decreases in telomere length in liver and cardiac tissue in CAST/Ei mice but resulted in telomere shortening in skeletal muscle. We also observed significant alterations in gene expression of telomere-related genes providing evidence that physical activity is able to attenuate age-related changes in telomere dynamics in a tissue-specific manner. When considered together, these findings help provide cellular explanations by which chronic exercise may attenuate the aging process. Our results highlight the importance of the environment in the aging process and in particular the need to study telomere dynamics in tissues other than immune cells in response to exercise. In addition, this is the first time that CAST/Ei mice have been used to investigate the role of exercise on telomere dynamics, and these results show that short telomere strains of mice may respond differently to exercise than long telomere strains of laboratory animals (9,10).
Exercise Attenuated Age-Related Telomere Reductions in Cardiac and Liver Tissues yet Induced Telomere Length Loss in Skeletal Muscle
Several studies have demonstrated reduced telomere length with age in both humans and rodents (35–38). The present results indicate that exercise may prevent or delay the reduction in telomere length in certain tissues. In cardiac tissue of Wistar rats, telomere length decreases to a greater extent compared with other tissues such as liver, lung, kidney, and brain (37). Those authors speculated that the telomere shortening was due to unrepaired oxidative damage to telomeres (39) or due to subpopulations of dividing cardiomyocytes (40). In C57BL/6 mice, significant telomere shortening was observed in cardiac tissue of 18-month-old compared with 6-month-old animals (10). Our results are in agreement with these previous reports that cardiac tissue does undergo age-related telomere shortening in rodents, and we report for the first time that long-term exercise exposure is able to attenuate the age-related telomere shortening in cardiac tissue of CAST/Ei mice. We also observed age-related telomere shortening in liver of CAST/Ei mice; others have shown age-related telomere shortening in liver of other rodents (36). Similar to cardiac tissue, our data reveal that exercise attenuated the age-related telomere shortening observed in the liver of sedentary animals. These data demonstrate that long-term exercise is able to alter the aging process at the cellular level and provide the impetus to pursue future mechanistic studies to determine how telomere length is maintained with age in certain tissues of exercised CAST/Ei mice.
In the skeletal muscle of the exercised animals, we observed significant telomere shortening. Our data and those of others demonstrate that skeletal muscle telomeres do not shorten with age given the tissue’s postmitotic status (41,42). However, Collins and colleagues (17) measured telomere length in age- and training-matched endurance athletes with one group of individuals displaying fatigued athlete myopathic syndrome and observed shorter skeletal muscle telomere length in the fatigued athlete myopathic syndrome group compared with the healthy athletes. Rae andcolleagues (18) reported similar findings in healthy individuals with skeletal muscle telomere length shorter in endurance-trained individuals who had been training for the longest (number of years) and for the greatest duration of time per week (hours spent running). Our data in the skeletal muscle of the CAST/Ei mice that had long-term access to running wheels support these previous findings that chronic exposure to exercise is related to decreased skeletal muscle telomere length. Furthermore, these data are evidence that telomere dynamics of skeletal muscle between humans and CAST/Ei mice are qualitatively similar.
Several factors could have caused the tissue-specific response of telomere length to long-term exercise exposure. A common hypothesis for non–replicative-associated telomere shortening is unrepaired oxidative damage to telomeres (43,44). Intrinsic differences in antioxidant enzyme levels could have resulted in poor skeletal muscle reactive oxygen species scavenging, whereas cardiac muscle and liver, which have higher antioxidant capacity than skeletal muscle, maintained redox balance and prevented oxidative damage to telomeres (45). Future investigations are needed to directly test the tissue-specific response of telomere length to oxidative stress.
To our knowledge this is the first investigation to report an increase in skeletal muscle telomerase enzyme activity with any type of exercise stimulus. Our results are in contrast to those previously observed in rat skeletal muscle, where no alteration in skeletal muscle telomerase enzyme activity was observed in response to swimming training (46); however, differences in the nature of the exercise stimulus and the model organism could account for the different results. Telomerase enzyme activity is known to be very low in resting skeletal muscle (47,48), but an increase in response to exercise could reflect satellite cell proliferation or other cells infiltrating exercised muscle. In addition to greater muscle telomerase enzyme activity, we also observed increased mTert gene expression, which is believed to be the rate-limiting step in the assembly of the telomerase holoenzyme (49). Increased telomerase activity could represent an adaptation to exercise, such that as telomeres shorten in exercised muscle, the muscle cells may counteract the shortening by transiently upregulating mTERT and telomerase activity. Additionally, recent evidence has shown nuclear-independent actions of mTERT, including a role in protecting mitochondrial DNA from oxidative insults (50,51). Exercise training is known to exert powerful beneficial effects on mitochondrial function (52), suggesting an intriguing possibility for an effect of exercise on mTERT being involved in skeletal muscle mitochondrial health. Our results indicate that long-term exercise may be a telomerase-activating stimulus in skeletal muscle.
No change in telomerase activity was detected in liver or cardiac muscle with chronic exercise in CAST/Ei mice. In contrast, Werner and colleagues (10) observed that 6 months of exercise increased telomerase activity in cardiac muscle in C57BL/6 mice. Several differences between the studies should be noted that may account for contrasting telomerase results: (a) we used a different strain of mice (short telomere vs long telomere mice), (b) our exercise intervention was 6 months longer, and (c) our measurements were made in older mice. With regard to liver, ours is the first report to measure telomerase enzyme activity after a long-term exercise intervention. Radak and colleagues (46) measured liver telomerase enzyme activity in rats after short-term forced exercise training and also observed that telomerase enzyme activity was not different. Therefore, we speculate that exercise is acting through a telomerase-independent mechanism to maintain telomere length in liver tissues in short telomere mice.
Gene Expression of Shelterin Is Reduced After 1 Year of Age and Exercise Blunted This Age-Related Change
Shelterin is a six-protein complex that binds and protects telomere ends (20). Telomere repeat–binding factor 1 (TRF1) is important in telomere length homeostasis and TRF2 is critical for T-loop formation, whereas both are negative regulators of telomere length (22). The literature concerning shelterin genes and the effect of age is limited. Because it is well established that telomere length diminishes with age, we hypothesized that shelterin levels would show similar decreases. We observed significant decreases in skeletal muscle and cardiac muscle gene expression of shelterin components that were counteracted by chronic exercise. Although the magnitude of decrease in TRF1 and TRF2 protein content were not quantitatively significant in the EDL or cardiac muscle, the direction of change was similar to the change in gene expression. This could indicate that at later ages, the decrease in gene expression becomes apparent at the protein level, though we were unable to detect a decrease in protein content at our chosen time point. Interestingly, in PLT of SED-1y mice, TRF1 protein increased with telomere length maintenance compared with reduced telomere length and lower TRF1 in PLT skeletal muscle of EX-1y. TRF1 in mitotic cells is a negative regulator of telomere length (22); however, the role of TRF1 in telomere biology in postmitotic tissues, such as skeletal muscle, is less clear. Here, we show that increased TRF1 in skeletal muscle may be acting as a telomere length maintaining protein thereby preventing the typical age-associated telomere loss, where the stress of exercise in skeletal muscle prevented an age-related increase in TRF1 thus leading to telomere shortening. The role/function of TRF1 in postmitotic cell types, particularly in skeletal muscle with attention to possible fiber type differences, requires further investigation. Contrary to our hypothesis and to previous data in cardiac tissue (10), TRF1 and TRF2 protein levels did not change, in spite of significantly altered telomere length. These data indicate that telomere length in cardiac muscle may be changing independent of alterations in shelterin components. In SED-1y liver, we observed the expected finding that with increased TRF1, telomere length was shorter, whereas exercise prevented this increase in TRF1 and maintained telomere length. These results indicate important differences in the telomere biology of different tissues and that the effects of exercise and more broadly the environment are tissue specific and likely dependent on mitotic capacity of the cell types.
Gene Expression of Ku70, Ku80, p53, and Chk2 Are Altered With Age and Chronic Exercise
It has been established that short telomeres initiate a DNA damage response that is mediated by p53 and Chk2 (1,21,24). In addition, the heterodimer DNA damage repair protein KU70/80 has been observed to be transiently associated with telomere ends and may aid in the repair of damaged telomere DNA (24). Contrary to our hypothesis, we observed that gene expression of DDR, p53, and Chk2 genes were reduced with age, and this reduction was attenuated by exercise in skeletal muscle and cardiac muscle but not in liver. Several factors may help explain these contradictory results. Both p53 and Chk2 in cardiomyocytes are important in growth, hypertrophy, and myocyte replication (53,54). Considering our tissue weight data, our results in the young animals seem to indicate that the increased p53 and Chk2 gene expression may be due to growth rather than aging-associated telomere dysfunction. In addition, the mouse strain that we used is resistant to induced cardiovascular disease (55), thus other mouse strains may display increased gene expression of p53 and Chk2 due to these strain differences in disease susceptibility. These gene expression changes may indicate that the risk of cellular dysfunction is increased with age and that exercise was able to attenuate this risk in certain tissues. Therefore, age-related telomere loss may depend on tissue and also vary by species-specific telomere length, with potentially different DNA damage response and repair signaling involved.
A limitation of our work is that the majority of our findings are constrained to tissues that largely exist in a postmitotic state. In addition, the inclusion of additional time points with older animals could expand upon our findings, particularly with respect to the shelterin complex. Also the mouse strain used is known to be sensitive to infection and also to be resistant to certain age-related diseases (ie, cardiovascular disease) thus limiting the generalizability of our results. Future studies should target the relationship between cellular and functional changes with exercise and aging and potential mechanisms such as stress resistance, apoptosis, and various signaling pathways in these specific tissues.
Summary
Understanding how physical activity specifically alters telomere dynamics across a range of tissues and species is important to gain knowledge of how the environment can affect the aging process. We report for the first time significant changes in telomere length, shelterin, DDR, and cell cycle–related genes with age that are altered with chronic exercise but in a tissue-specific manner in CAST/Ei mice. These data also support the use of the CAST/Ei mouse strain in the study of telomere dynamics compared with other long-telomere mouse strains. The results of this investigation raise multiple questions about how exercise and age interact at the cellular and molecular levels among tissues and organ systems.
FUNDING
Funding was provided by the National Institutes of Health (T32 AG000268 to A.T.L and L.M.G) and the Department of Kinesiology Graduate Student Research Fund (A.T.L).
SUPPLEMENTARY MATERIAL
Supplementary material can be found at: http://biomedgerontology.oxfordjournals.org/.
Acknowledgments
We acknowledge Lindsay Wohlers for her help with animal handling and Sarah Frank for help with gene expression primer optimizations.
References
- 1.de Lange T. Shelterin: the protein complex that shapes and safeguards human telomeres. Genes Dev. 2005;19:2100–2110. doi: 10.1101/gad.1346005. [DOI] [PubMed] [Google Scholar]
- 2.Oh H, Taffet GE, Youker KA, et al. Telomerase reverse transcriptase promotes cardiac muscle cell proliferation, hypertrophy, and survival. Proc Natl Acad Sci U S A. 2001;98:10308–10313. doi: 10.1073/pnas.191169098. [DOI] [PMC free article] [PubMed] [Google Scholar]
- 3.Harley CB, Futcher AB, Greider CW. Telomeres shorten during ageing of human fibroblasts. Nature. 1990;345:458–460. doi: 10.1038/345458a0. [DOI] [PubMed] [Google Scholar]
- 4.Shay JW, Wright WE. Senescence and immortalization: role of telomeres and telomerase. Carcinogenesis. 2005;26:867–874. doi: 10.1093/carcin/bgh296. [DOI] [PubMed] [Google Scholar]
- 5.Greider CW, Blackburn EH. Tracking telomerase. Cell. 2004;116:S83–S86. doi: 10.1016/s0092-8674(04)00053-4. 81 p following S86. [DOI] [PubMed] [Google Scholar]
- 6.Ludlow AT, Roth SM. Physical activity and telomere biology: exploring the link with aging-related disease prevention. J Aging Res. 2011;2011:790378. doi: 10.4061/2011/790378. [DOI] [PMC free article] [PubMed] [Google Scholar]
- 7.Cherkas LF, Hunkin JL, Kato BS, et al. The association between physical activity in leisure time and leukocyte telomere length. Arch Intern Med. 2008;168:154–158. doi: 10.1001/archinternmed.2007.39. [DOI] [PubMed] [Google Scholar]
- 8.Ludlow AT, Zimmerman JB, Witkowski S, Hearn JW, Hatfield BD, Roth SM. Relationship between physical activity level, telomere length, and telomerase activity. Med Sci Sports Exerc. 2008;40:1764–1771. doi: 10.1249/MSS.0b013e31817c92aa. [DOI] [PMC free article] [PubMed] [Google Scholar]
- 9.Werner C, Furster T, Widmann T, et al. Physical exercise prevents cellular senescence in circulating leukocytes and in the vessel wall. Circulation. 2009;120:2438–2447. doi: 10.1161/CIRCULATIONAHA.109.861005. [DOI] [PubMed] [Google Scholar]
- 10.Werner C, Hanhoun M, Widmann T, et al. Effects of physical exercise on myocardial telomere-regulating proteins, survival pathways, and apoptosis. J Am Coll Cardiol. 2008;52:470–482. doi: 10.1016/j.jacc.2008.04.034. [DOI] [PubMed] [Google Scholar]
- 11.Holloszy JO. Exercise and longevity: studies on rats. J Gerontol. 1988;43:B149–B151. doi: 10.1093/geronj/43.6.b149. [DOI] [PubMed] [Google Scholar]
- 12.Navarro A, Gomez C, Lopez-Cepero JM, Boveris A. Beneficial effects of moderate exercise on mice aging: survival, behavior, oxidative stress, and mitochondrial electron transfer. Am J Physiol Regul Integr Comp Physiol. 2004;286:R505–R511. doi: 10.1152/ajpregu.00208.2003. [DOI] [PubMed] [Google Scholar]
- 13.Blair SN, Kohl HW, 3rd, Paffenbarger RS, Jr, Clark DG, Cooper KH, Gibbons LW. Physical fitness and all-cause mortality. A prospective study of healthy men and women. JAMA. 1989;262:2395–2401. doi: 10.1001/jama.262.17.2395. [DOI] [PubMed] [Google Scholar]
- 14.Cherkas LF, Aviv A, Valdes AM, et al. The effects of social status on biological aging as measured by white-blood-cell telomere length. Aging Cell. 2006;5:361–365. doi: 10.1111/j.1474-9726.2006.00222.x. [DOI] [PubMed] [Google Scholar]
- 15.LaRocca TJ, Seals DR, Pierce GL. Leukocyte telomere length is preserved with aging in endurance exercise-trained adults and related to maximal aerobic capacity. Mech Ageing Dev. 2010;131:165–167. doi: 10.1016/j.mad.2009.12.009. [DOI] [PMC free article] [PubMed] [Google Scholar]
- 16.Ponsot E, Lexell J, Kadi F. Skeletal muscle telomere length is not impaired in healthy physically active old women and men. Muscle Nerve. 2008;37:467–472. doi: 10.1002/mus.20964. [DOI] [PubMed] [Google Scholar]
- 17.Collins M, Renault V, Grobler LA, et al. Athletes with exercise-associated fatigue have abnormally short muscle DNA telomeres. Med Sci Sports Exerc. 2003;35:1524–1528. doi: 10.1249/01.MSS.0000084522.14168.49. [DOI] [PubMed] [Google Scholar]
- 18.Rae DE, Vignaud A, Butler-Browne GS, et al. Skeletal muscle telomere length in healthy, experienced, endurance runners. Eur J Appl Physiol. 2010;109:323–330. doi: 10.1007/s00421-010-1353-6. [DOI] [PubMed] [Google Scholar]
- 19.Cooke HJ, Smith BA. Variability at the telomeres of the human X/Y pseudoautosomal region. Cold Spring Harb Symp Quant Biol. 1986;51(Pt 1):213–219. doi: 10.1101/sqb.1986.051.01.026. [DOI] [PubMed] [Google Scholar]
- 20.de Lange T. How shelterin solves the telomere end-protection problem. Cold Spring Harb Symp Quant Biol. 2010;75:167–177. doi: 10.1101/sqb.2010.75.017. [DOI] [PubMed] [Google Scholar]
- 21.Palm W, de Lange T. How shelterin protects mammalian telomeres. Annu Rev Genet. 2008;42:301–334. doi: 10.1146/annurev.genet.41.110306.130350. [DOI] [PubMed] [Google Scholar]
- 22.Smogorzewska A, van Steensel B, Bianchi A, et al. Control of human telomere length by TRF1 and TRF2. Mol Cell Biol. 2000;20:1659–1668. doi: 10.1128/mcb.20.5.1659-1668.2000. [DOI] [PMC free article] [PubMed] [Google Scholar]
- 23.Nojima H. Protein kinases that regulate chromosome stability and their downstream targets. Genome Dyn. 2006;1:131–148. doi: 10.1159/000092505. [DOI] [PubMed] [Google Scholar]
- 24.Wang Y, Ghosh G, Hendrickson EA. Ku86 represses lethal telomere deletion events in human somatic cells. Proc Natl Acad Sci U S A. 2009;106:12430–12435. doi: 10.1073/pnas.0903362106. [DOI] [PMC free article] [PubMed] [Google Scholar]
- 25.Hemann MT, Greider CW. Wild-derived inbred mouse strains have short telomeres. Nucleic Acids Res. 2000;28:4474–4478. doi: 10.1093/nar/28.22.4474. [DOI] [PMC free article] [PubMed] [Google Scholar]
- 26.Callicott RJ, Womack JE. Real-time PCR assay for measurement of mouse telomeres. Comp Med. 2006;56:17–22. [PubMed] [Google Scholar]
- 27.Cawthon RM. Telomere measurement by quantitative PCR. Nucleic Acids Res. 2002;30:e47. doi: 10.1093/nar/30.10.e47. [DOI] [PMC free article] [PubMed] [Google Scholar]
- 28.Gardner JP, Kimura M, Chai W, et al. Telomere dynamics in macaques and humans. J Gerontol A Biol Sci Med Sci. 2007;62:367–374. doi: 10.1093/gerona/62.4.367. [DOI] [PubMed] [Google Scholar]
- 29.Ponsot E, Kadi F. Signal modelization for improved precision of assessment of minimum and mean telomere lengths. Electrophoresis. 2008;29:542–544. doi: 10.1002/elps.200700290. [DOI] [PubMed] [Google Scholar]
- 30.Wright WE, Shay JW, Piatyszek MA. Modifications of a telomeric repeat amplification protocol (TRAP) result in increased reliability, linearity and sensitivity. Nucleic Acids Res. 1995;23:3794–3795. doi: 10.1093/nar/23.18.3794. [DOI] [PMC free article] [PubMed] [Google Scholar]
- 31.Cattan V, Mercier N, Gardner JP, et al. Chronic oxidative stress induces a tissue-specific reduction in telomere length in CAST/Ei mice. Free Radic Biol Med. 2008;44:1592–1598. doi: 10.1016/j.freeradbiomed.2008.01.007. [DOI] [PubMed] [Google Scholar]
- 32.Wu H, Rothermel B, Kanatous S, et al. Activation of MEF2 by muscle activity is mediated through a calcineurin-dependent pathway. EMBO J. 2001;20:6414–6423. doi: 10.1093/emboj/20.22.6414. [DOI] [PMC free article] [PubMed] [Google Scholar]
- 33.Martinez P, Blasco MA. Role of shelterin in cancer and aging. Aging Cell. 2010;9:653–666. doi: 10.1111/j.1474-9726.2010.00596.x. [DOI] [PubMed] [Google Scholar]
- 34.Samper E, Goytisolo FA, Slijepcevic P, van Buul PP, Blasco MA. Mammalian Ku86 protein prevents telomeric fusions independently of the length of TTAGGG repeats and the G-strand overhang. EMBO Rep. 2000;1:244–252. doi: 10.1093/embo-reports/kvd051. [DOI] [PMC free article] [PubMed] [Google Scholar]
- 35.Cawthon RM, Smith KR, O’Brien E, Sivatchenko A, Kerber RA. Association between telomere length in blood and mortality in people aged 60 years or older. Lancet. 2003;361:393–395. doi: 10.1016/S0140-6736(03)12384-7. [DOI] [PubMed] [Google Scholar]
- 36.Cherif H, Tarry JL, Ozanne SE, Hales CN. Ageing and telomeres: a study into organ- and gender-specific telomere shortening. Nucleic Acids Res. 2003;31:1576–1583. doi: 10.1093/nar/gkg208. [DOI] [PMC free article] [PubMed] [Google Scholar]
- 37.Hastings R, Li NC, Lacy PS, et al. Rapid telomere attrition in cardiac tissue of the ageing Wistar rat. Experimental gerontology. 2004;39:855–857. doi: 10.1016/j.exger.2004.02.003. [DOI] [PubMed] [Google Scholar]
- 38.Levy MZ, Allsopp RC, Futcher AB, Greider CW, Harley CB. Telomere end-replication problem and cell aging. J Mol Biol. 1992;225:951–960. doi: 10.1016/0022-2836(92)90096-3. [DOI] [PubMed] [Google Scholar]
- 39.Petersen S, Saretzki G, von Zglinicki T. Preferential accumulation of single-stranded regions in telomeres of human fibroblasts. Exp Cell Res. 1998;239:152–160. doi: 10.1006/excr.1997.3893. [DOI] [PubMed] [Google Scholar]
- 40.Kajstura J, Pertoldi B, Leri A, et al. Telomere shortening is an in vivo marker of myocyte replication and aging. Am J Pathol. 2000;156:813–819. doi: 10.1016/S0002-9440(10)64949-8. [DOI] [PMC free article] [PubMed] [Google Scholar]
- 41.Decary S, Mouly V, Hamida CB, Sautet A, Barbet JP, Butler-Browne GS. Replicative potential and telomere length in human skeletal muscle: implications for satellite cell-mediated gene therapy. Hum Gene Ther. 1997;8:1429–1438. doi: 10.1089/hum.1997.8.12-1429. [DOI] [PubMed] [Google Scholar]
- 42.Renault V, Thornell LE, Eriksson PO, Butler-Browne G, Mouly V. Regenerative potential of human skeletal muscle during aging. Aging Cell. 2002;1:132–139. doi: 10.1046/j.1474-9728.2002.00017.x. [DOI] [PubMed] [Google Scholar]
- 43.Kawanishi S, Oikawa S. Mechanism of telomere shortening by oxidative stress. Ann N Y Acad Sci. 2004;1019:278–284. doi: 10.1196/annals.1297.047. [DOI] [PubMed] [Google Scholar]
- 44.von Zglinicki T, Serra V, Lorenz M, et al. Short telomeres in patients with vascular dementia: an indicator of low antioxidative capacity and a possible risk factor? Lab Invest. 2000;80:1739–1747. doi: 10.1038/labinvest.3780184. [DOI] [PubMed] [Google Scholar]
- 45.Limon-Pacheco J, Gonsebatt ME. The role of antioxidants and antioxidant-related enzymes in protective responses to environmentally induced oxidative stress. Mutat Res. 2009;674:137–147. doi: 10.1016/j.mrgentox.2008.09.015. [DOI] [PubMed] [Google Scholar]
- 46.Radak Z, Taylor AW, Sasvari M, et al. Telomerase activity is not altered by regular strenuous exercise in skeletal muscle or by sarcoma in liver of rats. Redox Rep. 2001;6:99–103. doi: 10.1179/135100001101536102. [DOI] [PubMed] [Google Scholar]
- 47.Nozawa K, Maehara K, Isobe K. Mechanism for the reduction of telomerase expression during muscle cell differentiation. J Biol Chem. 2001;276:22016–22023. doi: 10.1074/jbc.M011181200. [DOI] [PubMed] [Google Scholar]
- 48.Wernig A, Schafer R, Knauf U, et al. On the regenerative capacity of human skeletal muscle. Artif Organs. 2005;29:192–198. doi: 10.1111/j.1525-1594.2005.29033.x. [DOI] [PubMed] [Google Scholar]
- 49.Yi X, Shay JW, Wright WE. Quantitation of telomerase components and hTERT mRNA splicing patterns in immortal human cells. Nucleic Acids Res. 2001;29:4818–4825. doi: 10.1093/nar/29.23.4818. [DOI] [PMC free article] [PubMed] [Google Scholar]
- 50.Ahmed S, Passos JF, Birket MJ, et al. Telomerase does not counteract telomere shortening but protects mitochondrial function under oxidative stress. J Cell Sci. 2008;121:1046–1053. doi: 10.1242/jcs.019372. [DOI] [PubMed] [Google Scholar]
- 51.Buchner N, Zschauer TC, Lukosz M, Altschmied J, Haendeler J. Downregulation of mitochondrial telomerase reverse transcriptase induced by H2O2 is Src kinase dependent. Exp Gerontol. 2010;45:558–562. doi: 10.1016/j.exger.2010.03.003. [DOI] [PubMed] [Google Scholar]
- 52.Holloszy JO. Regulation by exercise of skeletal muscle content of mitochondria and GLUT4. J Physiol Pharmacol. 2008;59(suppl 7):5–18. [PubMed] [Google Scholar]
- 53.Anversa P, Nadal-Ginard B. Myocyte renewal and ventricular remodelling. Nature. 2002;415:240–243. doi: 10.1038/415240a. [DOI] [PubMed] [Google Scholar]
- 54.Kim YH, Heo JS, Han HJ. High glucose increase cell cycle regulatory proteins level of mouse embryonic stem cells via PI3-K/Akt and MAPKs signal pathways. J Cell Physiol. 2006;209:94–102. doi: 10.1002/jcp.20706. [DOI] [PubMed] [Google Scholar]
- 55.Mehrabian M, Allayee H, Wong J, et al. Identification of 5-lipoxygenase as a major gene contributing to atherosclerosis susceptibility in mice. Circ Res. 2002;91:120–126. doi: 10.1161/01.res.0000028008.99774.7f. [DOI] [PubMed] [Google Scholar]


