Abstract
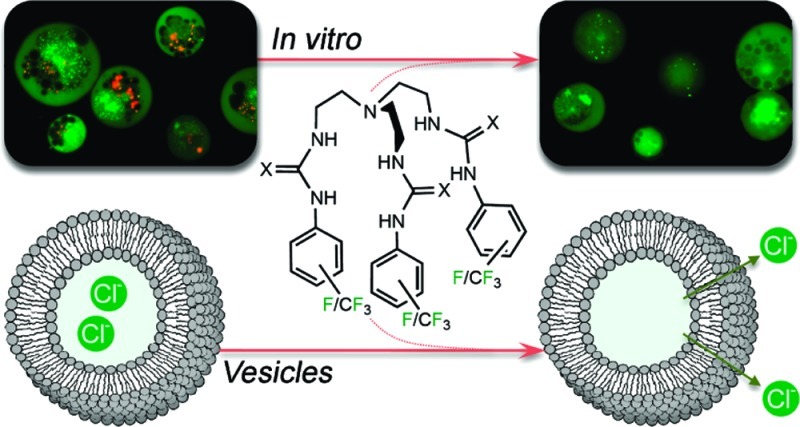
A series of easy-to-make fluorinated tripodal anion transporters containing urea and thiourea groups have been prepared and their anion transport properties studied. Vesicle anion transport assays using ion-selective electrodes show that this class of compound is capable of transporting chloride through a lipid bilayer via a variety of mechanisms, including chloride/H+ cotransport and chloride/nitrate, chloride/bicarbonate, and to a lesser extent an unusual chloride/sulfate antiport process. Calculations indicate that increasing the degree of fluorination of the tripodal transmembrane transporters increases the lipophilicity of the transporter and this is shown to be the major contributing factor in the superior transport activity of the fluorinated compounds, with a maximum transport rate achieved for clog P = 8. The most active transporter 5 contained a urea functionality appended with a 3,5-bis(trifluoromethyl)phenyl group and was able to mediate transmembrane chloride transport at receptor to lipid ratios as low as 1:250000. Proton NMR titration and single crystal X-ray diffraction revealed the ability of the tripodal receptors to bind different anions with varying affinities in a 1:1 or 2:1 stoichiometry in solution and in the solid state. We also provide evidence that the most potent anion transporters are able to induce apoptosis in human cancer cells by using a selection of in vitro viability and fluorescence assays.
Introduction
Transmembrane transport of anions across lipid bilayers is an important biological process that is normally regulated by specialized proteins embedded within the biological membrane (ion channels). Malfunctioning transport proteins can lead to a variety of pathologies, so-called ‘channelopathies’,1 including the commonly inherited disease cystic fibrosis,2 the renal disease Bartter’s syndrome and some forms of myotonia (muscle stiffness).3 This has led in recent years to an interest in the development of small molecules that can act as potential future therapeutic substitutes for these malfunctioning proteins.4 Furthermore, transport of anions in living cells is also essential in regulating membrane potentials, cell volume and intracellular pH.5 Since the alteration of pH regulation is an early event in apoptosis, it has been suggested that compounds that can change internal pH regulation, e.g. through HCl transport or through chloride/bicarbonate transport, can offer a possible approach for anticancer therapy.6,7
Although there are several examples of nonprotein natural products that can function as cation transporters, such as valinomycin,8 only few examples of natural anion transporters can be found. The most notable examples are the prodigiosins, which have been shown to function as HCl transporters and as anion antiporters, and these properties have been linked to their biological activity as anticancer agents.7,9,10 This lack of natural anionophores has led to the design of a variety of synthetic molecules that can act as transmembrane transporters for anions, including compounds based on peptide fragments,11 anion−π slides,12 steroids,13 calixpyrroles14 and calixarenes,15 and other scaffolds.4
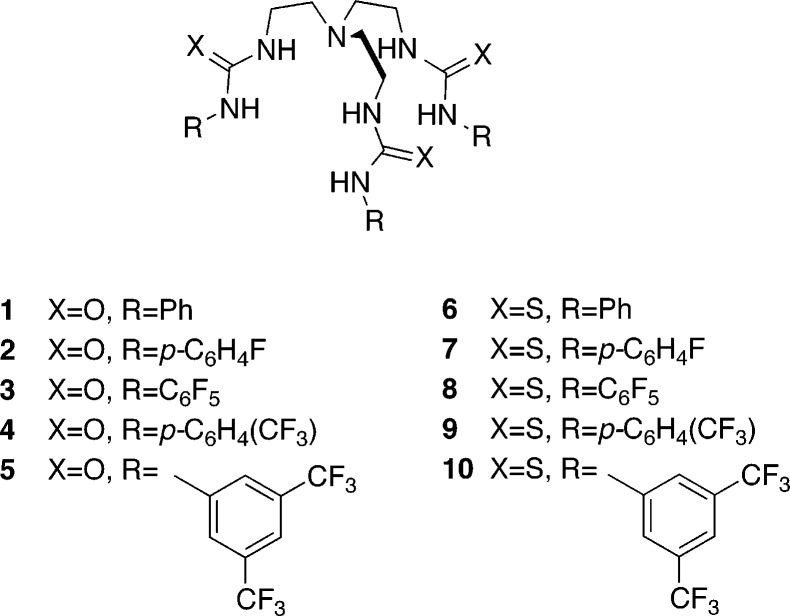
We have recently become interested in the transmembrane anion transport mediated by small, structurally simple molecules,16 including the tripodal tris-urea 1 and tris-thiourea 6 based on the tris(2-aminoethyl)amine (tren) scaffold (Chart 1).17 Reinhoudt and co-workers were the first to show that tren-based tris-amides are effective receptors for anions such as chloride.18 More recently, tren-based tris-ureas have been shown to effectively bind oxo-anions, such as sulfate and phosphate, by Ghosh,19 Custelcean,20 and others.21 The transmembrane transport abilities of tren-based anion receptors have also been investigated. D. K. Smith et al. showed that tris-amides based on tren are capable of HCl transport,22 while J. T. Davis et al. showed that tren-based receptors containing catechol moieties are capable of transporting chloride across a lipid bilayer.23 Tren-based receptors containing sulfonamide functionalities have been investigated by B. D. Smith and co-workers for their ability to transport phospholipid head groups through a lipid bilayer, i.e. for their flippase activity.24 In our previous studies on compounds 1 and 6, we found that this type of receptor is capable of transporting chloride via chloride/nitrate or chloride/bicarbonate antiport mechanisms. However, for practical applications of these anion transporters in medicinal and biological settings, it is necessary that high ion fluxes can be achieved at low transporter concentrations, without compromising other ADMET (absorption, distribution, metabolism, excretion, and toxicity) properties of the compound. A common strategy in the pharmaceutical arena to improve the physiological properties of potential new drugs is by investigating fluorinated analogues. Fluorinated compounds are often less toxic and show higher metabolic stability than their unfluorinated analogues.25 Furthermore, fluorination of aromatic compounds results in increased lipophilicity and hydrogen bond acidity, which may subsequently lead to stronger anion binding properties.26 Both characteristics are expected to be favorable for the transport of anions across a lipid bilayer.
Chart 1. Structures of Ureas 1–5 and Thioureas 6–10.
Herein we report the transmembrane transport abilities of tren-based tris-ureas 1–5 and tris-thioureas 6–10 (Chart 1), to provide insight into the relationship between the structure, anion affinity, lipophilicity and anion transport ability of the fluorinated and unfluorinated tripodal receptors 1–10. The anion binding properties in solution and the solid state are investigated and linked to anion transport abilities obtained through vesicles tests using ion-selective electrodes or fluorescence assays. The results show a significant increase of anion transport in vesicles for the fluorinated compounds compared to the unfluorinated analogues. We demonstrate that this effect is mainly due to an increase in lipophilicity, rather than to variations in anion binding affinity. We also provide initial results showing that the fluorinated compounds that display the highest anion transport activity in vesicles, possess anticancer properties, presumably by inducing apoptosis in cancer cells through anion transport.
Results and Discussion
Synthesis
We have previously reported the synthesis and properties of compounds 1 and 6.17 The synthesis and anion binding properties of receptor 3 were reported by Ghosh et al.19 All other receptors (2, 4, 5, and 7–10) are novel and could be readily synthesized in good yields by the reaction of tris(2-aminoethyl)amine with three equivalents of the appropriate iso(thio)cyanate in dry dichloromethane. Synthetic details and characterization of the compounds are described in the Supporting Information.
Anion Binding in Solution
The ability of receptors 1–10 to bind anions in solution was investigated using 1H NMR titration techniques in DMSO-d6 containing 0.5% water (with the anions added either as tetrabutylammonium (TBA) or tetraethylammonium (TEA) salts). The binding studies were performed for various anions relevant in biological systems and in transmembrane transport assays. Where possible, the change in chemical shift of the (thio)urea NH signals was fitted to a 1:1 or 1:2 binding model using the WinEQNMR2 computer program,27 and the results are summarized in Table 1. Previously reported stability constants are included for comparison.17,19 Stacked NMR plots, fitted curves, and Job plots can be found in the Supporting Information (Figures S15–S63).
Table 1. Association Constants Ka (M–1) for the Binding of Compounds 1–10 to Various Anions in DMSO-d6 Containing 0.5% Water at 298 K, Following the Most Upfield (Thio)urea NH (errors are within 15%).a.
| Cl– | SO42– | H2PO4– | HCO3– | NO3– | |
|---|---|---|---|---|---|
| Urea-Based Compounds | |||||
| 1 | 882 b | >104 b | 443 c | –b,d | –b,e |
| 2 | 575 | >104 | 452 c | 365 | –e |
| 3 | 166 | >104 f | >104 f | >104 f,g | –e,f |
| 4 | 405 | >104 | 243 c | 156 | –e |
| 5 | 517 | >104 | –h | –i | –e |
| Thiourea-Based Compounds | |||||
| 6 | 191 b | >104 b | 256 c | –b,i | –b,e |
| 7 | 179 | >104 | 227 c | –i | –e |
| 8 | 128 | >104 | 130 | –i | –e |
| 9 | 156 | –d | –h | –i | –e |
| 10 | –d | –d | –h | –i | –e |
Anions added as TBA salts, except HCO3– which was added as a TEA salt. Fitted to 1:1 model.
Previously published data.17
Data for DMSO-d6/10% water, data for DMSO-d6/0.5% water could not be fitted.
Data could not be fitted to any model.
No significant shift of NH peaks, no binding.
Data for neat DMSO-d6 by Ghosh et al.,19 values for DMSO-d6/0.5% water are expected to be lower.
2:1 model.
New peaks due to deprotonation of bound H2PO4– and subsequent binding of HPO42–.
Peak broadening.
In agreement with previously reported tripodal tris-ureas,17,19 all compounds show strong 1:1 binding with tetrabutylammonium sulfate (Ka > 104 M–1) and only limited interaction with tetrabutylammonium nitrate. Titration experiments with tetrabutylammonium chloride showed 1:1 complexation processes occurring in solution with association constants of moderate strength (Ka ≈ 102 M–1). The only receptor that did not fit to a 1:1 model was compound 10, and Job plot analysis with tetrabutylammonium chloride confirmed a mixture of 1:1 and 2:1 receptor to chloride stoichiometries (Supporting Information, Figure S22). In all cases the binding constants obtained for the more acidic thioureas are lower than for the equivalent ureas. Surprisingly, the obtained stability constants decrease with the addition of increasingly electron-withdrawing substituents. This trend is opposite to what is normally expected, since electron-withdrawing groups, such as fluorines,26 increase the hydrogen bond acidity of a receptor and hence show stronger hydrogen bond interactions with anions.28 A possible explanation for the reverse trend observed here may be due to solvent effects. The electron-withdrawing effect of the substituents not only increases the binding to anions, but it will also increase the binding to other hydrogen bond acceptors such as DMSO or water. Therefore, fluorine substitution might lead to increased competition from the solvent and hence lead to lower binding constants with anions in competitive solvents.28
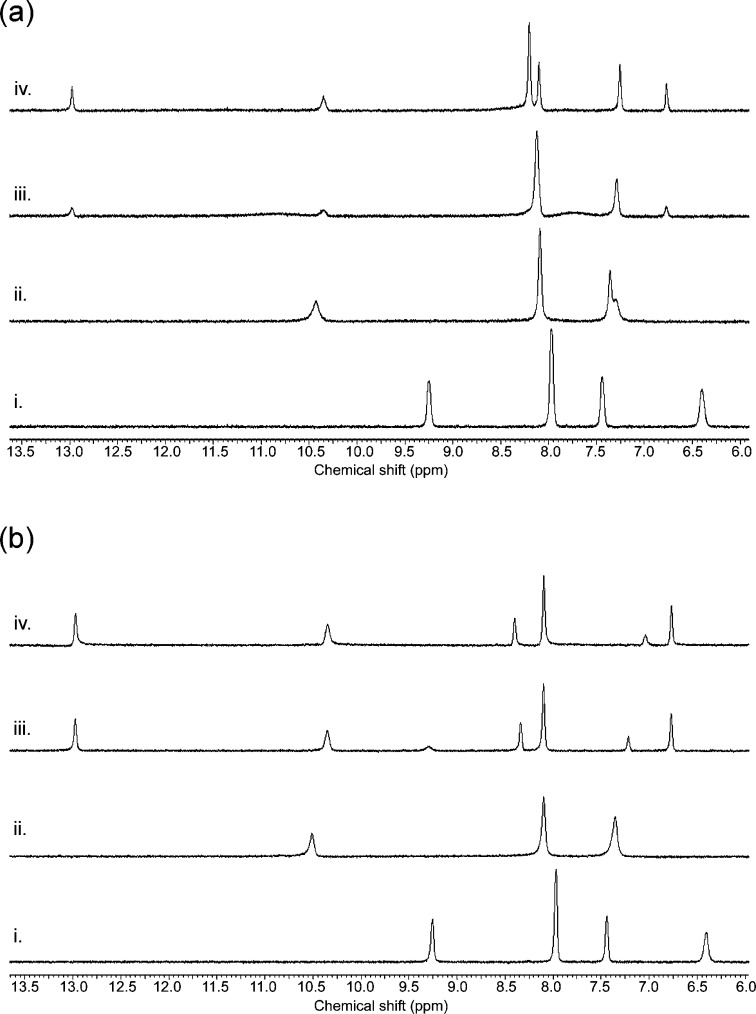
The interactions of 1–10 with tetraethylammonium bicarbonate and tetrabutylammonium dihydrogen phosphate proved to be less straightforward to interpret. Data analysis of the NMR titrations of thioureas 6–10 with tetraethylammonium bicarbonate was greatly hindered by peak broadening, which can be indicative of a proton transfer from the ligand to bicarbonate or from bound bicarbonate to free bicarbonate in solution. However, proton transfer is not the only process present, since the addition of aliquots of strong base (tetrabutylammonium hydroxide) did not yield the same spectra as did the addition of bicarbonate (compare Supporting Information Figures S52, S55, and S56 with Figures S44, S46, and S48). Although significant peak broadening also occurred upon the addition of bicarbonate to the urea compounds 1–5, the peaks could still be followed throughout the titration. However, the data could either not be fitted to any model or the 1:1 fit gave larger errors (between 10% and 15% error). This might be due to multiple equilibria in the system—deprotonation events and mixed stoichiometries being the most likely processes to occur—but Job plot analysis indicated that 1:1 stoichiometry is dominant in DMSO-d6/0.5% water solutions. Similar problems were encountered during NMR titrations with dihydrogen phosphate. When the NMR binding studies were performed in DMSO-d6/0.5% water, the data could not be fitted to a 1:1 or 2:1 binding model (Supporting Information), even though strong 1:1 complex formations have been observed for 1, 3, and 6 in neat DMSO.19,29 This problem did not occur when the titrations were repeated in DMSO-d6 containing 10% water, yielding the stability constants shown in Table 1. However, when considering the binding constants obtained for both NH functions separately, it appears that the interaction of the ligands with dihydrogen phosphate is still complex in this highly competitive solvent mixture (e.g., compound 1, Ka for aromatic urea NH is 6363 M–1 and Ka for alkyl urea NH is 443 M–1 in DMSO-d6 containing 10% water). The large difference in binding constants between the two urea NHs was also observed by Ghosh and co-workers for the interaction of 3 with dihydrogen phosphate and was attributed to desolvation of DMSO from the cavity, or to conformational changes in the receptor.19 In the case of compounds 5, 9, and 10 the NMR titration with tetrabutylammonium dihydrogen phosphate showed another unexpected result where a combination of fast and slow exchange processes were present in both DMSO-d6/0.5% water and DMSO-d6/10% water mixtures. Up to the addition of one equivalent of dihydrogen phosphate a downfield shift of the NH groups was observed, while the addition of more aliquots of anion resulted in the appearance of new peaks further downfield. This behavior has been observed previously for receptors that bind anions through multiple hydrogen bonds and has been explained by the deprotonation of bound dihydrogen phosphate and the subsequent formation of a monohydrogen phosphate complex.30 To test whether the same process occurs in the tripodal systems, we conducted NMR experiments in which one equivalent of dihydrogen phosphate was added to 5, 9, or 10, followed by the addition of aliquots of tetrabutylammonium hydroxide. This resulted in the same NMR spectra as obtained by the addition of excess dihydrogen phosphate (Figure 1). A control experiment where tetrabutylammonium hydroxide was titrated in the absence of dihydrogen phosphate did not result in the emergence of new downfield peaks, indicating that deprotonation of bound dihydrogen phosphate is responsible for the new peaks, rather than deprotonation of the receptor. It is clear that some of the tripodal tris(thio)ureas can sufficiently change the pKa of dihydrogen phosphate through multiple hydrogen bond formation to allow deprotonation of the bound anion by free dihydrogen phosphate in solution. It is possible that similar processes can account for the complex binding curves observed for the other tripodal tris-ureas and tris-thioureas 1–10 with both tetraethylammonium bicarbonate and tetrabutylammonium dihydrogen phosphate.
Figure 1.
(a) 1H NMR titration with compound 5 in DMSO-d6/0.5% water with tetrabutylammonium dihydrogen phosphate; (i) free receptor; (ii) one equivalent of tetrabutylammonium dihydrogen phosphate; (iii) 2 equivalents of tetrabutylammonium dihydrogen phosphate; (iv) 3 equivalents of tetrabutylammonium dihydrogen phosphate. (b) 1H NMR titration with compound 5 in DMSO-d6/0.5% water with tetrabutylammonium dihydrogen phosphate and TBA hydroxide; (i) free receptor; (ii) one equivalent of tetrabutylammonium dihydrogen phosphate; (iii) one equivalent of tetrabutylammonium dihydrogen phosphate + one equivalent of tetrabutylammonium OH; (iv) one equivalent of tetrabutylammonium dihydrogen phosphate +1.5 equiv of tetrabutylammonium OH.
In summary, we found that tripodal receptors 1–10 can bind anions in DMSO/water solutions according to the trend SO42– > H2PO4– > Cl– > HCO3– ≫ NO3– (e.g., compound 2, Table 1 and Supporting Information Table S1), with various deprotonation events occurring upon interaction with H2PO4– or HCO3–. We have also shown that, in competitive DMSO/water mixtures, the compounds with the most acidic NH protons have the lowest association constants—resulting in higher binding constants for the ureas compared to those of thioureas and for those of the unfluorinated compounds compared to those of the fluorinated compounds.
Anion Binding in Solid State
Binding properties in the solid state were studied by single-crystal X-ray diffraction. Crystal structures of anion complexes with tripodal tris-ureas have been reported previously by Ghosh,19 Custelcean,20 and others.21 Here we provide a comprehensive overview of the structural features in solid-state complexes of compounds 1–10 with various anions obtained by our group and others. The focus will lie on the complexes of 7 and 8 and on how the structural information can be related to the transport properties of these compounds. Method of crystallization, tables of hydrogen bonds, data collection and refinement details, and thermal ellipsoid plots can be found for each structure in the Supporting Information, CIF files are also provided.31
X-ray analysis of single crystals of compounds 2, 7, and 9 revealed a preference of the tripodal (thio)ureas to form cage-like structures. In the structure of urea 2, the cage is stabilized by two intramolecular hydrogen bonds between an oxygen atom of one arm and the NH functions of another arm (N···O distances 2.911(2) Å and 2.967(2) Å with N–H···O angles of 156° and 148°). The other two oxygen atoms are involved in intermolecular hydrogen bonds with neighboring molecules, allowing crystal packing (N···O distances 2.843(2)–3.091(2) Å and N–H···O angles between 146°–159°). A similar observation was made by Ghosh et al. for free receptor 3.19 In the case of thioureas 7 and 9, two sulfur atoms are involved in intramolecular hydrogen bonds (N···S distances 3.267(4)–3.521(2) Å and N–H···S angles 137°–168°), while the remaining sulfur atom is involved in crystal packing via intermolecular hydrogen bonds in the range 3.370(4)–3.502(4) Å and with N–H···S angles 141°–162° (Figure 2a).
Figure 2.
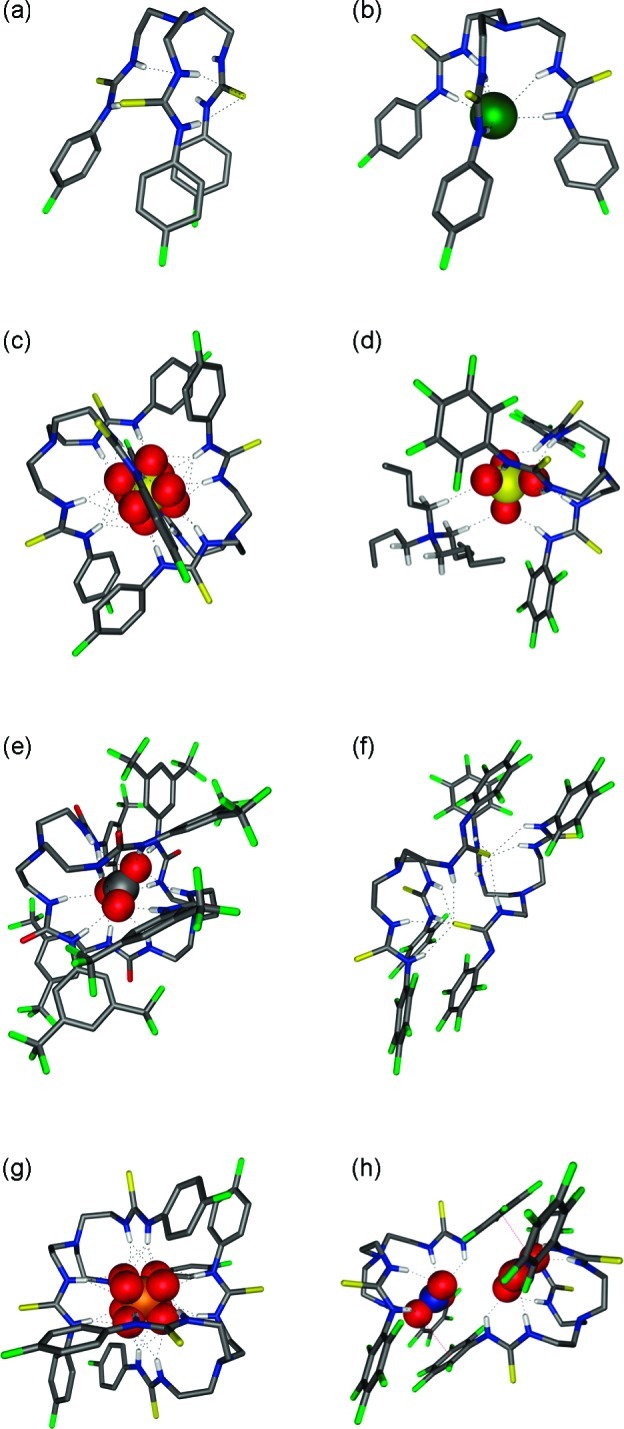
X-ray crystal structures of 5, 7, and 8 with a variety of anionic guests. Ligands are represented as wireframes, and bound anions are shown in a spacefilling view (0.6 times van der Waals radius). Solvent molecules, counterions, and noninteracting hydrogens are omitted for clarity: C (gray), H (white), N (blue), S (yellow), O (red), F (green), Cl (dark green), P (orange). Hydrogen bonds are represented by dashed lines. (a) Free ligand 7; (b) 7⊃Cl; (c) (7)2⊃SO4 (disordered sulfate); (d) 8⊃SO4·TBA; (e) (5)2⊃CO3; (f) (8-H)2; (g) (7)2⊃HPO4 (disordered hydrogen phosphate); (h) (8⊃NO3)2.
The tetrabutylammonium chloride complexes of receptors 2, 7, and 8 crystallized as 1:1 complexes, reflecting the stoichiometry observed in solution. Six hydrogen bonds, one from each NH group, stabilize the complex (Figure 2b). All N–H···Cl angles are larger than 145°, and N···Cl distances vary from 3.200(2) Å to 3.600(2) Å.
We were able to grow single crystals of tetrabutylammonium sulfate complexes of compounds 7 and 8. Even though the anion binding studies in solution showed a clear 1:1 stoichiometry with sulfate, the crystal structure obtained for (7)2⊃SO4 revealed a 2:1 complex in the solid state (Figure 2c). The disordered sulfate ion is encapsulated between two ligands and is stabilized via 14 hydrogen bonds to the six thiourea groups (Figure 2c). Eleven of these hydrogen bonds can be classified as moderate with N···O distances <3.2 Å (N···O distances from 2.840(4) Å to 3.091(4) Å), while three of them are weaker (N···O distances from 3.210(4) Å to 3.295(4) Å).32 All N–H···O angles are larger than 145°. Similar 2:1 complexes with sulfate have been reported before for other tren-based tris-urea receptors.19−21 On the other hand, the crystal structure of the complex of 8 with sulfate did show the 1:1 stoichiometry observed in solution (Figure 2d). Six strong hydrogen bonds between the sulfate oxygens and the thiourea NH functions are responsible for complex formation (N···O distances 2.757(4)–2.883(4) Å and N–H···O angles 149°–169°). In this structure, one of the TBA counterions is held in close contact to the sulfate complex via two C–H···O interactions between oxygen atoms in sulfate and CH2 groups adjacent to the positively charged nitrogen in TBA (C···O distances 3.326(5) Å (C–H···O angle 172°) and 3.334(4) Å (C–H···O angle 171°)), similar to previously reported contact ion-pair interactions between tetrabutylammonium and tripodal sulfate complexes.33
Solid-state bicarbonate interactions were studied for compounds 1, 5, and 8. We have previously reported that crystallization of 1 in the presence of TEAHCO3 resulted in a 2:1 complex of 1 with CO32– (rather than with HCO3–).17 Similar behavior was observed in crystals grown from 5 with TEAHCO3. All of these complexes ((1)2⊃CO3, (5)2⊃CO3 and previously reported19 (3)2⊃CO3) form 2:1 complexes with CO32–via twelve hydrogen bonds or more, with N–H···O angles from 142° to 174° and the majority of the N···O distances in the range of 2.829(2)–3.392(2) Å, but some weaker hydrogen bonds are also present (Figure 2e). Attempts to crystallize a bicarbonate complex of receptor 8 failed, presumably because bicarbonate functioned as a Brønsted base and deprotonated one of the thiourea NH groups instead of forming an anion complex. Thus, the crystal structure obtained was that of a dimer of deprotonated 8 (Figure 2f), stabilized by intermolecular hydrogen bonds between the remaining NH functions and the sulfur atom of the deprotonated thiourea group (five hydrogen bonds per sulfur atom, N···S distances from 3.274(4) Å to 3.451(5) Å and N–H···S angles from 140° to 170°).
As was observed in solution, the solid-state structures for dihydrogen phosphate (with 7, 8, and 10) proved to be more varied than for other anions. The complex of 8 with H2PO4– crystallized as the same 2 + 2 dimer observed for the analogous urea 3.19 This structure consists of two H2PO4– ions that are hydrogen bonded to each other. The phosphate dimer is further encapsulated by two ligand molecules, stabilized by hydrogen bonding to the (thio)urea NH functions and by anion−π interactions. On the other hand, the solid-state complexes formed by 7 and 10 with TBAH2PO4 showed the same deprotonation of bound dihydrogen phosphate as observed in solution during NMR titrations and crystallized as 2:1 complexes with HPO42– in the presence of excess TBAH2PO4. Complex (7)2⊃HPO4 is stabilized by 14 hydrogen bonds, where each NH in the two ligands contributes to one hydrogen bond (except N7–H7, which is bifurcated). Each oxygen in the phosphate anion accepts three or four hydrogen bonds. N···O distances vary between 2.800 (4) Å and 3.253(4) Å and N–H···O angles are in the range 144°–165°. Complex (10)2⊃HPO4 is stabilized by 12 hydrogen bonds, one from each NH in the six thioureas and three for each oxygen in phosphate. N···O distances vary between 2.829(6) Å and 3.047(6) Å and N–H···O angles range from 149° to 169° (Figure 2g).
Even though no binding could be observed for nitrate in solution under the conditions of the NMR titration experiments, we were able to obtain a nitrate complex in the solid state (8⊃NO3). The structure shows a nitrate ion bound inside the cavity of the ligand via six hydrogen bonds (N···O distances from 2.884(6) to 3.366(7) and N–H···O angles from 129° to 166°) in a 1:1 stoichiometry. However, closer inspection reveals a 2 + 2 dimer, where two nitrate:ligand complexes are held together via anion−π interactions. The distance between one oxygen atom of the nitrate ion and the centroid of an electron-poor aromatic ring of the second ligand is 3.013(4) Å (distance between nitrate N and the nearest aromatic carbon is 3.105(7) Å). These short distances imply a significant interaction,34 justifying the claim of a 2 + 2 stoichiometry (Figure 2h).
Figure 3 shows spacefilling models of the chloride complex of receptor 2 and the carbonate complex of compound 5. This representation shows clearly that only a small fraction of the bound anion is accessible to the environment, because the anion is completely encapsulated by one or two tripodal receptors. This would imply that the hydrophilic anions can be almost completely screened from the hydrophobic membrane by the lipophilic ligands—especially in the cases of 2:1 complexes. Such structures would be ideal for transporting anions across lipid bilayers.
Figure 3.
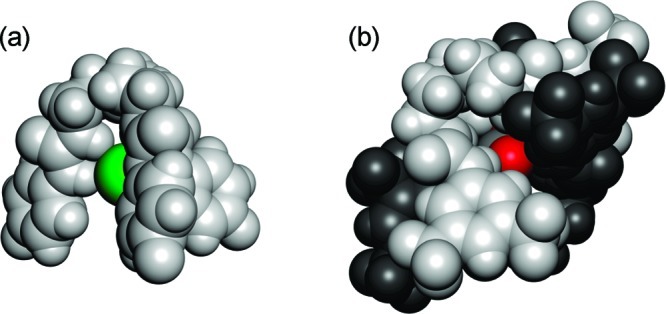
Spacefilling representations of the X-ray structures of (a) 2⊃Cl and (b) (5)2⊃CO3. Ligands are shown in grayscale and anions in color: C (gray), O (red), Cl (green).
Transport Studies
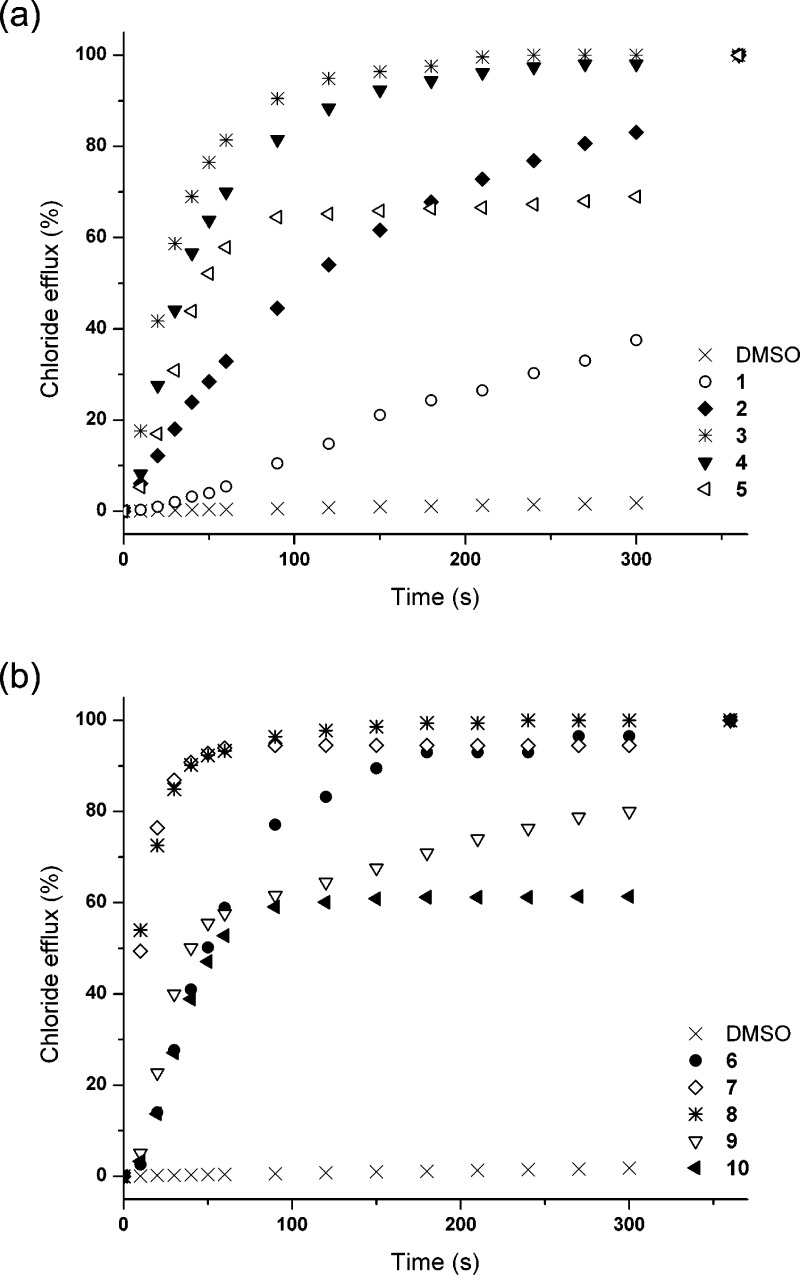
We wished to assess the ability of compounds 1–10 to transport ions across a lipid bilayer and hence assess the effect of fluorination on the transport ability of this class of compound. Ion-selective electrode (ISE) or fluorescence assays were used to monitor ion transport. In a typical assay, we prepared a series of unilamellar 1-palmitoyl-2-oleoylphosphatidylcholine (POPC) vesicles of defined size (200 nm in diameter). The vesicles were loaded with a buffered sodium chloride solution (489 mM in 5 mM phosphate buffer at pH 7.2) and suspended in an isotonic sodium nitrate solution according to literature procedures.35 Putative transporters 1–10 were added as a solution in a small amount of DMSO and the resultant transport of chloride out of the vesicles was monitored using a chloride selective electrode. At the end of the experiment, the vesicles were lysed by addition of detergent, and the final reading was used to calibrate the ISE to 100% chloride release (Figure 4). It is evident from Figure 4 that fluorination has a profound impact on the transport abilities of these systems. In all cases, the fluorinated compounds show a significantly faster release of chloride than the nonfluorinated analogues.
Figure 4.
Chloride efflux promoted by 1–10 (2% molar carrier to lipid) from unilamellar POPC vesicles loaded with 489 mM NaCl buffered to pH 7.2 with 5 mM sodium phosphate salts. The vesicles were dispersed in 489 mM NaNO3 buffered to pH 7.2 with 5 mM sodium phosphate salts. At the end of the experiment, detergent was added to lyse the vesicles and calibrate the ISE to 100% chloride efflux. Each point represents the average of three trials. DMSO was used as control. (a) Urea compounds 1–5. (b) Thiourea compounds 6–10.
Evidence for Anion Antiport Mechanism
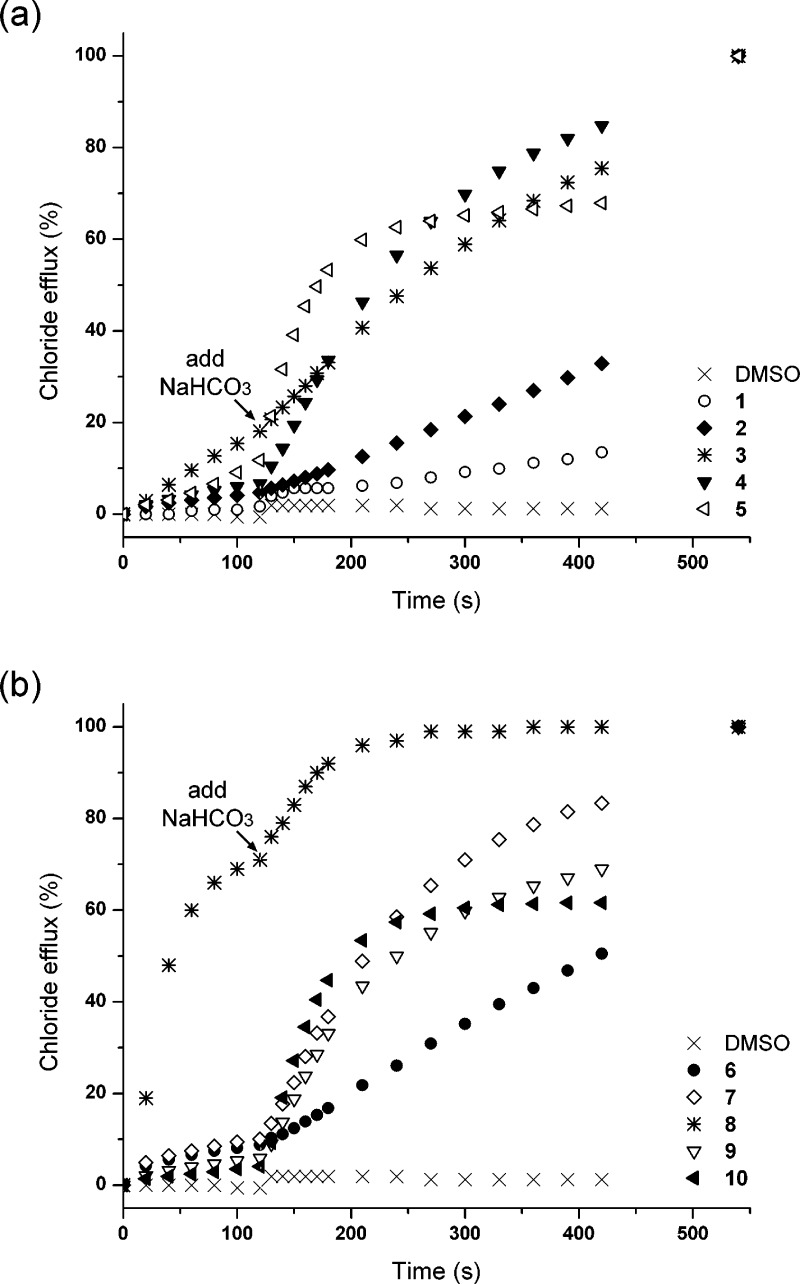
Transport of ions by simple synthetic molecules usually only occurs via passive transport mechanisms in which the charge balance across the membrane is maintained. This can be achieved by either a symport mechanism, where both an anion and a cation are transported, or by an antiport mechanism, where two anions are transported across the membrane in opposite directions.4 The chloride efflux shown in Figure 4 could be the result of Na+/Cl– or H+/Cl– symport or Cl–/NO3– antiport. We have shown previously that receptors 1 and 6 function predominantly via anion antiport mechanisms (Cl–/NO3– or Cl–/HCO3– antiport) using a variety of ISE vesicle studies and 13C NMR assays.17 To test whether the same mechanism operates for the fluorinated analogues, vesicles containing a NaCl solution were prepared and suspended in a solution of Na2SO4. Transport was initiated by the addition of receptor in a DMSO solution at a 2 mol % receptor to lipid concentration (Figure 5). With a double negative charge, sulfate is a much more hydrophilic anion than nitrate (ΔGhydr(SO42–) −1080 kJ mol–1; ΔGhydr(NO3–) −300 kJ mol–1)36 and is consequently considerably more challenging to transport across a hydrophobic membrane. As shown in Figure 5, the majority of the compounds release only a limited amount of chloride under these conditions. This strong dependence on the external anion suggests that the receptors transport chloride predominantly via an exchange mechanism. We also tested the compounds for their ability to function as chloride/bicarbonate antiporters, because this is a more biologically relevant process37 that has been linked to a number of pathologies.2,38 This was combined with the aforementioned sulfate assay, as shown in Figure 5. Two minutes after the addition of the transporters, NaHCO3 was added to the external Na2SO4 solution, which led to a marked acceleration of chloride efflux (Figure 5). However, the transport rates are still slower than those obtained for chloride/nitrate exchange (Figure 4). Even though the experimental conditions are different (40 mM NaHCO3 compared to 489 mM NaNO3), this might be explained by the reduced lipophilic nature of bicarbonate compared to nitrate (ΔGhydr(HCO3–) −335 kJ mol–1).36 In general, the chloride efflux mediated by the tripodal receptors depends on the external anion and follows the trend NO3– > HCO3– ≫ SO42–. This trend suggests that an antiport mechanism is predominant and also shows the importance of lipophilicity in the transport abilities of simple molecules. The highest transport rates are obtained for the anion with the highest lipophilicity (nitrate), rather than the anion with the highest binding constant (sulfate).
Figure 5.
Chloride efflux promoted by 1–10 (2% molar carrier to lipid) from unilamellar POPC vesicles loaded with 450 mM NaCl buffered to pH 7.2 with 20 mM sodium phosphate salts. The vesicles were dispersed in 162 mM Na2SO4 buffered to pH 7.2 with 20 mM sodium phosphate salts. At t = 120 s, a solution of NaHCO3 was added to give a 40 mM external concentration. At the end of the experiment, detergent was added to lyse the vesicles and calibrate the ISE to 100% chloride efflux. Each point represents the average of three trials. DMSO was used as control. (a) Urea compounds 1–5. (b) Thiourea compounds 6–10.
However, it must be noted that there is one exception to the general trend in this series, namely pentafluorophenyl thiourea 8. Even though the transport rates still follow NO3– > HCO3– ≫ SO42–, significant chloride efflux can be observed when sulfate is the external anion (Figure 5). The most likely explanation for this observation is H+/Cl– symport, because the X-ray structure obtained for compound 8 in the presence of TEAHCO3 revealed that the thiourea NH functionality of this compound can be easily deprotonated. Therefore a potential mechanism could be a neutral receptor transporting chloride across a membrane and then loss of HCl with the resulting anionic form of the receptor diffusing back across the membrane. This would explain why the chloride efflux is most pronounced for the compound with the most acidic (thio)urea functionality. To test this hypothesis we prepared POPC vesicles loaded with NaCl (489 mM) and 1 mM of the pH-sensitive dye 8-hydroxy-1,3,6-pyrenetrisulfonate (HPTS).39 The vesicles were suspended in a Na2SO4 solution and upon addition of the carrier the fluorescence was measured. At the end of the experiment the vesicles were lysed with detergent. The result for compound 8 showed an initial rise in the internal pH followed by a decrease (Supporting Information, Figure S96). Similar behavior has been observed previously by our group for 1 and 6(17) and by Berezin and Davis23 and was explained by an initial, small amount of HCl transport, creating a pH gradient across the membrane that could be compensated by slow transport of HNO3. In this experiment this might indicate that the initial HCl cotransport is compensated by back transport of protons leading to a lower internal pH. The same experiment was repeated for the other tripodal compounds 1–10, all of which showed an increase in internal pH, indicative of a small amount of HCl cotransport (Supporting Information, Figure S96). In most cases the rise in pH was not compensated and remained stable at higher pH, with the exception of compound 5 where the initial rise in intravesicular pH was reversed, and a decrease in pH was observed, presumably due to the back transport of protons into the vesicles.
Even though the high hydrophilicity of sulfate and the HPTS test suggest otherwise, there are still several reasons to believe that the activity observed for 8 is partly due to Cl–/SO42– antiport. First, the high binding constant for sulfate—combined with a lipophilic receptor that can easily screen the sulfate from the lipid bilayer—might compensate for the high hydrophilicity of sulfate. Second, the other related receptors all function predominantly as antiporters, as shown by the Cl–/NO3– and Cl–/HCO3– assays. A final argument is that the HPTS test indicated that the initial HCl efflux can be compensated by a back-transport mechanism. One possibility for this back transport could be the influx HSO4–, which would formally result in a Cl–/SO42– exchange mechanism. To provide further evidence to support this theory, we prepared a series of liposomes loaded with NaCl and lucigenin that were suspended in a NaCl solution (100 mM). The lack of a chloride and pH gradient rules out HCl cotransport. Lucigenin was used to monitor the internal chloride concentration, since the fluorescence of this dye is quenched by halide ions.40 The experiment was initiated by the addition of various anions (Na2SO4, NaNO3, or NaCl) followed by the addition of a methanol solution of 8. At the end of the experiment the vesicles were lysed with detergent. The result shown in Figure 6 shows a significant increase in fluorescence upon the addition of 8 when sulfate was originally added, indicating that chloride is transported out of the vesicle. When a NaNO3 solution was added instead of Na2SO4, a much faster increase in fluorescence was observed, as would be expected for an antiport process of a more lipophilic anion (Figure 6). As a control, the experiment was repeated with the addition NaCl instead of Na2SO4, and in this case the addition of compound 8 did not result in an increase in fluorescence (a small decrease in fluorescence was observed, as expected for a small influx of chloride to compensate for differences in ionic strength). The variation of the change in fluorescence in the presence of these anions suggests that the nature of the externally added anion is important and that a change in ionic strength alone is not enough to transport chloride out of the vesicle. It is therefore plausible that the increase in fluorescence seen for external sulfate is due to chloride/sulfate antiport mediated by compound 8. No change in fluorescence was observed when compound 3, 10, or methanol (blank) was added (Supporting Information, Figures S97 and S98), indicating that only 8 is able to transport sulfate. However, a small amount of chloride/sulfate antiport was observed for compound 5, which was the only other receptor that showed a significant back transport in the HPTS assays—indicating that the observed chloride/sulfate antiport might be due to HCl/HSO4– exchange. To the authors’ knowledge, this is the first time that a Cl–/SO42– antiport mechanism has been observed for a simple synthetic molecule. Although the selectivity and activity for sulfate transport is poor, it is still a remarkable result that a simple easy-to-make compound can transport a highly hydrophilic, doubly negatively charged anion across a lipid bilayer. We believe that the tripodal (thio)urea based compounds 1–10 transport anions predominantly by an antiport mechanism and that this scaffold will provide a good starting point for the challenging design of sulfate transporters.
Figure 6.
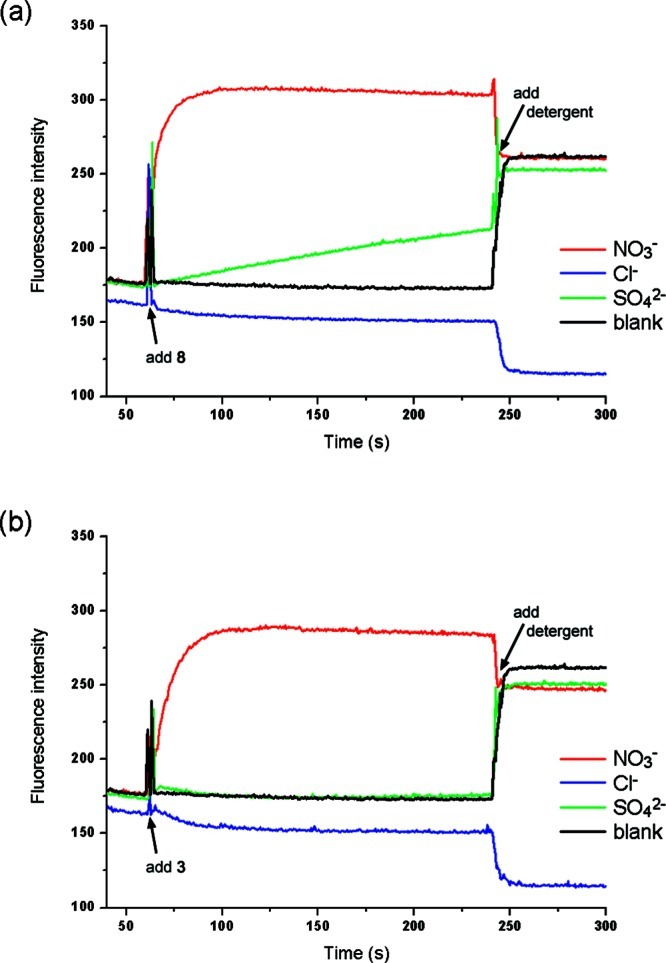
Evidence for transmembrane transport of sulfate. Unilamellar POPC vesicles were loaded with 100 mM NaCl and 2 mM lucigenin buffered to pH 7.2 with 20 mM sodium phosphate salts and dispersed in a 100 mM NaCl solution (buffered to pH 7.2). At t = 30 s, a solution of the appropriate anion was added (final concentration of 40 mM NaNO3 (red), 40 mM Na2SO4 (green) or 40 mM NaCl (blue)). At t = 60 s, a methanol solution of the putative transporter was added (2% molar carrier to lipid). At the end of the experiment (240 s), detergent was added to lyse the vesicles. Each point represents the average of three trials. A blank experiment was performed by addition of Na2SO4, followed by addition of methanol; (a) compound 8. (b) compound 3.
Evidence for Mobile Carrier Mechanism
There are three main mechanisms by which ion transport can occur: mobile carrier mechanism,4 relay mechanism,41 or pore formation (ion channel).4 On the basis of the X-ray data, a mobile carrier mechanism seems the most likely. Crystal structures of the free ligands indicate a preference for a closed cavity-like conformation, while the anion complexes form well-defined 1:1 or 2:1 entities with the anion situated inside the cavity. It seems therefore plausible that the ion transport occurs via diffusion through the bilayer of the 1:1 or 2:1 complexes observed in solution and in the solid state, rather than via the formation of channels.
To test this hypothesis, the ISE vesicle studies were repeated for vesicles consisting of POPC with 30% cholesterol. It is often suggested that cholesterol decreases the fluidity of a lipid bilayer42 and that this would have a negative effect on the transport ability of a mobile carrier, which is largely dependent on diffusion within the membrane.4 Comparing the anion transport rates of compounds 1–10 in POPC vesicles and in 7:3 POPC:cholesterol vesicles shows an observable decrease in transport activity in the presence of cholesterol for the same carrier to lipid ratio (Supporting Information, Figures S99 and S100), in agreement with a mobile carrier mechanism.
Further evidence for a carrier mechanism was obtained through classic U-tube experiments on receptors 4, 6, and 9. In these experiments the membrane is replaced by a bulk organic phase separating two aqueous phases. Transport due to the formation of channels is impossible in this case because of the large dimensions of the organic phase.4,43 The setup of the experiment involved a U-shaped tube filled with the organic phase containing 1 mM carrier. For solubility reasons, nitrobenzene was used as the organic phase. One arm of the tube was filled with an aqueous NaNO3 solution, while the other arm was filled with a NaCl solution and the chloride concentration of the NaNO3 phase was monitored with an ISE to quantify the transport through nitrobenzene. No change in chloride concentration was observed in the absence of carrier, but an increase in chloride concentration could be detected when carrier was present, indicating that these compounds can act as mobile carriers (Supporting Information, Figure S101). The extent of U-tube transport was dependent on the type of carrier according to 9, 6 > 4, the same trend as observed during the vesicle studies. This suggests that the mobile carrier mechanism shown in a bulk organic phase is also present in lipid bilayers. Even though Hill analysis of the transport data revealed increasing n values for the thioureas (Table 2) as the hydrophobicity of the compounds increases, we believe the results of the POPC/cholesterol transport studies (reduced transport rates) and U-tube experiments remain evidence in favor of a mobile carrier mechanism, and we propose in this case that we may be seeing a ‘mobile aggregate’ mediating transport rather than a channel possibly due to the hydrophobic compounds aggregating at the polar water–bilayer interface.
Table 2. Overview of Transport Assays and Lipophilicity of Compounds 1–10.
| compound | clog Pa | kinib (Cl–/NO3–) | EC50, 270sc (Cl–/NO3–) | nd (Cl–/NO3–) | kinie (Cl–/HCO3–) | EC50, 270sc (Cl–/HCO3–) | nd (Cl–/HCO3–) |
|---|---|---|---|---|---|---|---|
| Urea-Based Compounds | |||||||
| 1 | 2.06 | 0.081 | 5.6 | 1.2 | 0.024 | >5 f | –f |
| 2 | 2.53 | 0.571 | 0.43 | 1.4 | 0.081 | >5 f | –f |
| 3 | 4.43 | 1.84 | 0.24 | 1.4 | 0.250 | –g | –g |
| 4 | 4.82 | 1.35 | 0.052 | 1.1 | 0.46 | 0.24 | 1.2 |
| 5 | 7.59 | 1.01 | 0.0044 | 1.6 | 0.77 | 0.036 | 1.5 |
| Thiourea-Based Compounds | |||||||
| 6 | 5.50 | 0.97 | 0.31 | 1.9 | 0.186 | 2.3 | 1.0 |
| 7 | 5.97 | 3.3 | 0.042 | 2.9 | 0.47 | 0.35 | 1.2 |
| 8 | 7.87 | 3.2 | 0.032 | 2.4 | 0.38 | –g | –g |
| 9 | 8.26 | 1.18 | 0.077 | 4.8 | 0.47 | 0.11 | 4.8 |
| 10 | 11.03 | 0.90 | 0.042 | 5.0 | 0.76 | 0.14 | 3.8 |
clog P calculated using Spartan ’08 for Macintosh (Ghose–Crippen model).
Initial rate of chloride efflux for 2% molar carrier to lipid (% s–1).
EC50, 270s defined as concentration (mol % carrier to lipid) needed to obtain 50% efflux after 270 s.
Hill coefficient.
Initial rate of chloride efflux (after addition of NaHCO3) for 2% carrier to lipid (% s–1).
Accurate Hill analysis could not be performed due to low activity.
Meaningful Hill analysis could not be performed due to significant background transport in the absence of NaHCO3 (HCl symport and/or Cl–/SO42– antiport).
Structure–Activity Relationship
To quantify the transport abilities of 1–10, we performed a series of Hill analyses44 for the chloride efflux in both the nitrate and bicarbonate antiport tests (see Supporting Information for details). This enables us to calculate EC50, 270s values, defined as the concentration of transporter required to achieve 50% chloride release 270 s after the addition of carrier (or after the addition of bicarbonate). The values are summarized in Table 2 together with the Hill coefficients and the initial rate of chloride release promoted by 0.02 molar equivalent of transporter. These values clearly show a profound fluorination effect, with EC50, 270s values that are at least 1 order of magnitude smaller than for the unfluorinated analogue (up to 3 orders of magnitude when comparing 5 with 1). Previous studies have shown that fluorination of aromatic rings increases the lipophilicity of the molecule and that this effect is even more pronounced for the addition of a −CF3 group.26 We therefore calculated Ghose–Crippen log P values45 for the receptors using the Spartan ’08 computer program46 (Table 2). When considering only the urea compounds 1–5, a clear correlation between the lipophilicity and the EC50, 270s values can be discerned for both chloride/nitrate and chloride/bicarbonate exchange. The higher the calculated log P value (clog P), the lower the EC50, 270s value—with an EC50, 270s value for the most lipophilic compound (5) as low as 0.0044 mol % (1:22500 carrier to lipid ratio). The lipophilicity–transport relationship is less pronounced for the thioureas 6–10. Up to a clog P ≈ 8 the transport activity increases with increasing lipophilicity, but higher clog P values do not result in lower EC50, 270s values. In fact, the EC50, 270s values and the initial rate of chloride release for chloride/nitrate antiport indicate a slight decrease in activity for the most lipophilic compounds 9 and 10. An explanation for this might be found in the mobile carrier mechanism. For a mobile carrier to work, it has to diffuse into the aqueous phase or to the more polar headgroups of the lipid bilayer (at the membrane/water interphase) in order to extract and release an anion in the aqueous phase and transport it through the membrane. When the carrier is too lipophilic, this process becomes the limiting step as the carrier remains inside the lipid bilayer, hence resulting in slower transport of ions. The same argument can explain the differences in transport ability between the ureas and the thioureas. The substitution of oxygen by a sulfur atom in thioureas is known to increase the lipophilicity. This explains why compounds 6–8 show a transport activity more significantly enhanced than the analogous ureas, and why thioureas 9 and 10 (clog P 8.26 and 11.03, respectively) prove to be too lipophilic and show decreased transport activity compared to those of ureas 4 and 5.
Previous reports on cholapod-based anion transporters indicate that increased binding constants can lead to increased transport ability.13,35 However, such a correlation is not observed in this series of tripodal anion transporters. Comparison of the association constants of 1–10 with chloride (Table 1) with the EC50, 270s values (Table 2) reveals a reverse trend where the best transport ability is observed for the receptor with the lowest binding constant. However, this correlation is not exact, and discrepancies can be found for both the ureas and the thioureas (e.g., compounds 3 and 8 have the lowest binding constants but not the lowest EC50, 270s values). Overall it seems that the observed enhanced transport rates of the fluorinated receptors are mainly due to the impact of fluorination on lipophilicity, rather than the influence on binding strength. Although there is clearly an upper limit to the lipophilicity of potential mobile carriers, this can provide a useful guideline in the design of future anion transporters.
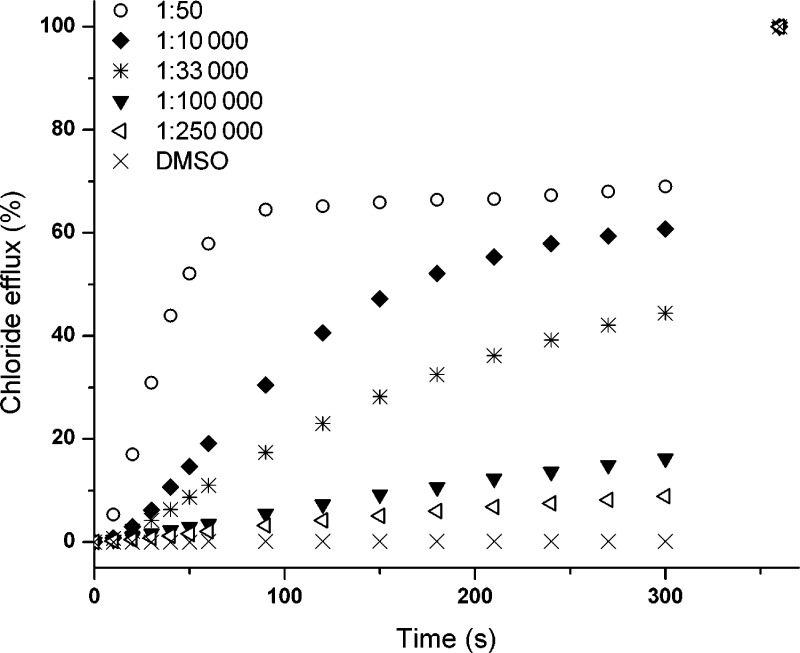
The exceptionally low EC50, 270s value for compound 5 led us to investigate the lowest concentration able to mediate observable chloride transport (Figure 7). Carrier to lipid ratios as low as 1:100000 and even 1:250000 were still able to mediate reasonable amounts of chloride efflux within the time scale of the experiment—which is a remarkable result for such a structurally simple molecule (and is in the range of the more complex cholapods, still some of the best mobile carriers reported to date).13 Despite the activity at low concentrations, Figure 7 also shows that compound 5 never reaches 100% chloride efflux. At a loading of 2 mol % (1:50 carrier to lipid) an initial fast release of chloride is observed, but after one minute the chloride efflux slows down dramatically, and the maximum chloride release that could be achieved was 70%, in both chloride/nitrate and chloride/bicarbonate assays. Changing the carrier concentration did not improve chloride effluxes, and similar behavior was observed for compounds 9 and 10 (see Figures 4 and 5). There are various processes that could cause this limited maximum efflux, but none could be determined with reasonable certainty. It was thought that competition with binding events to phosphate buffer or to phospholipid headgroups—resulting in so-called flippase activity24—could explain the sudden change in chloride release rate; however, exchanging phosphate for HEPES buffer resulted in the same behavior, and no significant flippase activity could be detected within a reasonable time-scale (Supporting Information, Figure S118 and S120). Another explanation may be that at 70% efflux, the chloride gradient is too small to allow transport by carrier 5, 9, or 10. However, this was contradicted by repeating the ISE experiment with a smaller initial gradient (200 mM NaCl instead of 500 mM), which again resulted in exactly the same behavior where the chloride efflux stops when 70% efflux is reached (Supporting Information, Figure S119). It is also possible that the chloride efflux does not reach levels higher than 70% because the externally added transporters cannot reach all of the vesicles. This suggestion becomes more likely when considering the relatively high Hill coefficients of the thiourea compounds (n = 3–5, Table 2), indicating that these compounds can form aggregates (or show other forms of cooperativity, although channel formation seems unlikely as discussed above). Since preincorporation into the vesicles was not possible due to poor solubility in organic solvents, the theory was tested by repeating the ISE experiments using more dilute vesicle solutions or by adding the transporters in discrete steps to enhance distribution into all of the vesicles. However, this only led to a small increase in chloride efflux, indicating that delivery to the vesicles is not a major problem (Supporting Information, Figures S121 and S122). Since this behavior was observed for the three most lipophilic compounds, it is possible that lipophilicity plays an important role (e.g., competition from precipitation in the aqueous phase), but this could not be proven. However, a maximum chloride efflux might be considered a positive characteristic in a biological setting because a total efflux of all chloride would kill any healthy cell, and the fact remains that the fluorinated compounds retain high transport activity at low concentrations.
Figure 7.
Chloride efflux promoted by various concentrations of 5 from unilamellar POPC vesicles loaded with 489 mM NaCl buffered to pH 7.2 with 5 mM sodium phosphate salts and dispersed in 489 mM NaNO3 buffered to pH 7.2 with 5 mM sodium phosphate salts. At the end of the experiment, detergent was added to lyse the vesicles and calibrate the ISE to 100% chloride efflux. Each point represents the average of three trials. DMSO was used as control. Carrier to lipid ratios of 1:50, 1:10000, 1:33000, 1:100000, and 1:250000 were used.
In Vitro Cytotoxicity in Cancer Cell Lines
The anion transport activity of ureas 1–5 and thioureas 6–10 prompted us to investigate the in vitro bioactivity of these receptors on tumor cell lines by the evaluation of cell viability, estimation of the pH changes in acidic cell compartments by acridine orange staining and by nuclear Hoechst staining for the assessment of apoptotic cell death induction (experimental details are listed in the Supporting Information). Apoptosis is an important biological consequence of exposure to extrinsic agents, and has been claimed to be modulated or triggered when the intracellular pH (pHi) drops below 7.0.47 The pHi in transformed or cancerous cells generally remains neutral or slightly more alkaline than in normal cells and is regulated by a variety of pHi homeostatic mechanisms, including Na+/H+ cotransport, Na+-dependent and -independent Cl–/HCO3– exchangers, vacuolar type H+-ATPase (V-ATPase), and other mechanisms.48 Matsuyama and co-workers suggested in 2000 that alteration of pHi regulation is an early event in apoptosis—preceding cytochrome C release from mitochondria and facilitating caspase activation—and they proposed that pHi regulatory mechanisms may offer new approaches for tumor therapy.6 Natural molecules like prodigiosins and tambjamines and their derivatives, as well as bafilomycin A1, are able to lower pHi through HCl transport across cell membranes and thereby lead to apoptosis.49 It has been suggested that this represents the main reason for the anticancer activity of the prodigiosins.7
The in vitro cytotoxic activity of receptors 1–10 was tested on a collection of different cancer cell lines of diverse origin, in casu human small-cell lung carcinoma (SCLC) cell line GLC4, human colon adenocarcinoma cell lines HT29 and DLD1, human colon adenocarcinoma from lymph node metastasis cell line SW620, squamous cell carcinoma from tongue (CAL27 cell line) and from mouth floor (HN4 cell line). Initially, a single-point (10 μM) screening assay was used to evaluate the cytotoxicity of receptors 1–10 (Figure 8). In this test, the cells were counted, and an MTT assay was performed in order to evaluate cell viability and proliferation by measuring the level of mitochondrial dehydrogenase activity.50 When only considering the single-point cell viability data for cell line GLC4, it is clear that receptors 4, 5, and 7–10 display significant cytotoxic effects, while no effect is observed for receptors 1–3 and 6. Comparing this result with the EC50, 270s values of Table 2 reveals that only the receptors possessing significant anion antiport activity can function as anticancer agents, since the EC50, 270s values of the cytotoxic molecules are at least 1 order of magnitude better than those obtained for the noncytotoxic compounds 1–3 and 6. It is also evident from Figure 8 that all thioureas (and in particular receptors 8, 9, and 10) display a more widespread cytotoxic effect across the panel of cell lines used in this work, which might be due to the general increased toxicity of thioureas compared to that of ureas.51 GLC4, HN4, and CAL27 were identified as the most sensitive cell lines for these types of compounds, and on the basis of the promising single-point data on these cell lines, we decided to quantify the cytotoxicity by collecting dose–response curves for receptors 4–10 in a 24 h viability assay in GLC4, HN4, and CAL27 cell lines (Supporting Information, Figures S123–S125). The dose–response curves allowed us to determine the IC50 values reported in Table 3. This data suggests that receptors 8 and 9 are the most efficient molecules to reduce cell viability followed by receptor 10.
Figure 8.
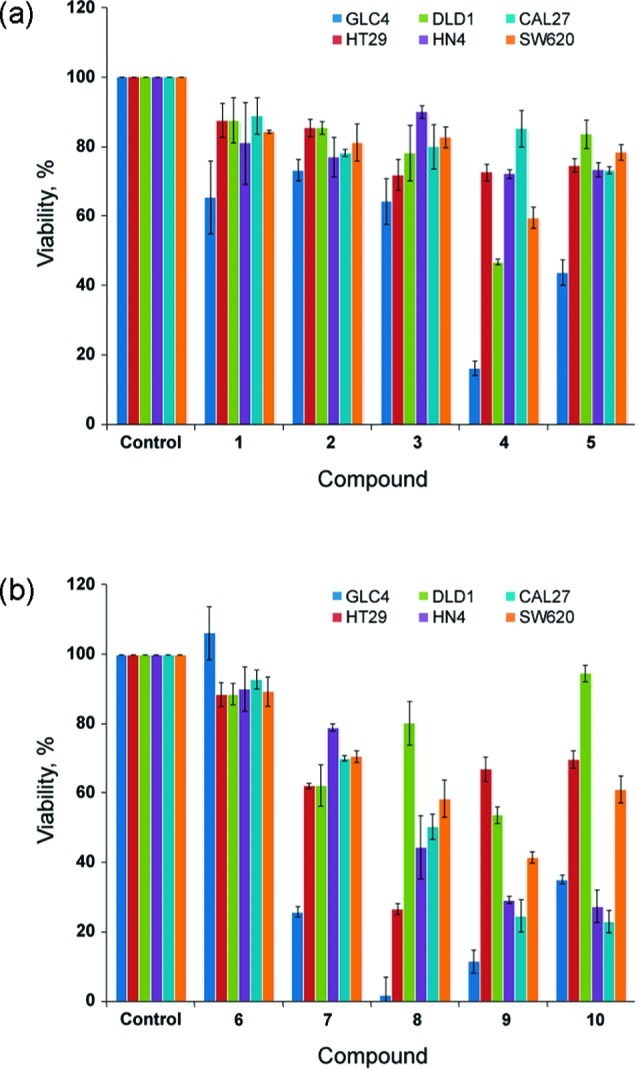
Single-point screening of receptors 1–10 (10 μM) tested on a collection of different cancer cell lines, from left to right, GLC4, HT29, DLD1, HN4, CAL27, and SW620; (a) 24-h cell viability of cell exposure to ureas 1–5; (b) 24-h cell viability of cell exposure to thioureas 6–10.
Table 3. IC50 Values of Receptors 4, 5, 8, 9, and 10 Obtained from MTT Assays on GLC4, HN4 and CAL27 Cell Lines at 24 h Exposure Timea.
| receptors | GLC4 | CAL27 | HN4 |
|---|---|---|---|
| 4 | 7.18 ± 0.91 | 25.77 ± 8.31 | 27.63 ± 3.35 |
| 5 | 5.12 ± 0.98 | 10.93 ± 1.88 | 14.73 ± 0.81 |
| 8 | 2.43 ± 0.14 | 12.16 ± 1.61 | 11.04 ± 0.04 |
| 9 | 2.70 ± 0.04 | 10.98 ± 0.80 | 8.71 ± 0.79 |
| 10 | 3.05 ± 0.06 | 10.76 ± 0.82 | 9.05 ± 0.52 |
Results represent a mean of three independent experiments with standard deviation and are in μM.
To further investigate the mechanism by which receptors 1–10 can display cytotoxic effects and to test the in vitro ionophoric activity of these compounds, the effect of the tripodal receptors on GLC4 cell lines was studied using vital staining with acridine orange (AO). This cell-permeable dye accumulates in acidic compartments, such as lysosomes, exhibiting a characteristic orange fluorescence emission in its protonated state, whereas it emits green fluorescence at higher pH.53 When GLC4 cells were stained with AO, granular orange fluorescence was observed in the cytoplasm (Figure 9a), suggesting that the orange fluorescence is due to acidified lysosomes. Cells treated with receptors 4, 7, 8, and 9 showed a complete disappearance of orange emission, indicating that these receptors can alter the intracellular pH. Partial disappearance of the orange staining of the granules was obtained after exposure to receptors 5 and 10 (data not shown). On the other hand, cells treated with receptors 1, 2, 3, and 6 showed no changes in fluorescence. The cells were incubated for 1 h with 10 μM (receptors 1, 2, 3, 6, and 7) or the IC50 dose (receptors 4, 5, 8, 9, and 10) of the relevant receptors, and the fluorescence due to AO was monitored. Representative results are depicted in Figure 9 (additional results can be found in the Supporting Information, Figures S126 and S127). The obtained results correlate well with the activity observed in the vesicle assays. Only active anionophores (EC50, 270s < 0.1 mol % for chloride/nitrate antiport or EC50, 270s < 1.0 mol % for chloride/bicarbonate antiport) induce an increase in the lysosomal pH, whereas the inactive receptors 1, 2, 3, and 6 did not affect intracellular pH. Combining the results obtained in the vesicle assays with the in vitro AO staining results leads us to suggest that an anion antiport mechanism such as Cl–/HCO3– exchange could be responsible for the increase in internal pH, similar to recently reported synthetic tambjamines,54 although other mechanisms such as H+/Cl– cotransport processes cannot be ruled out. If the lipophilicity is the main determining factor for the antiport activity, it is reasonable to suggest that the most lipophilic compounds are also the best symporters. This is even more likely for compounds 1–10, since the most lipophilic compounds also contain the most acidic (thio)urea functionalities and are therefore likely to be good HCl cotransporters. Because HPTS fluorescence assays indicated that 1–10 can transport HCl, H+/Cl– cotransport can also be another cause for the increase in lysosomal pH.
Figure 9.
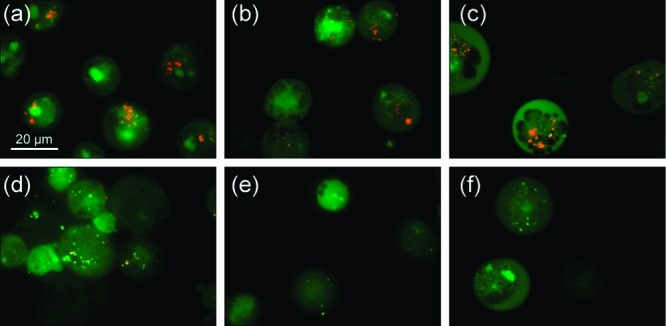
Acridine orange staining of GLC4 cell line after exposure of 1 h to different receptors: (a) untreated cells (control), (b) cells treated with receptor 2, (c) cells treated with receptor 3, (d) cells treated with receptor 7, (e) cells treated with receptor 8, (f) cells treated with receptor 9. (a–c) Cells with granular orange fluorescence in the cytoplasm; (d–f) cells with complete disappearance of orange fluorescence cytoplasm granules.
Apoptotic stimuli induce changes in the nuclear morphology, including nuclear condensation, fragmentation, holes in the nuclei of dead cells and appearance of apoptotic bodies, which can be identified by fluorescence microscopy. Hoechst 33342 staining was performed in order to confirm that apoptosis was the cell death mechanism following exposure to tripodal compounds 1–10. In GLC4 cell line treated with receptors 4, 7, 8, and 9, we were able to identify condensation of the nuclei (Figure 10c, d, e, respectively) and the presence of ‘bean-shaped’ nuclei (Figure 10f). Comparable results were obtained with cells exposed to receptors 5 and 10 (data not shown). On the other hand, cells treated with receptors 1, 2, 3, and 6 showed no nuclear morphology changes (Figure 10b and Figures S128 and S129 in Supporting Information). Again, these results correlate well with the activity as anion exchangers studied in liposome models, where only the most active transporters are able to induce apoptosis. In summary, it seems that the cytotoxicity displayed by receptors 1–10 is due to apoptosis, which is induced by changes in the internal pH regulation due to the chloride/bicarbonate antiport or HCl symport activity of the receptors.
Figure 10.
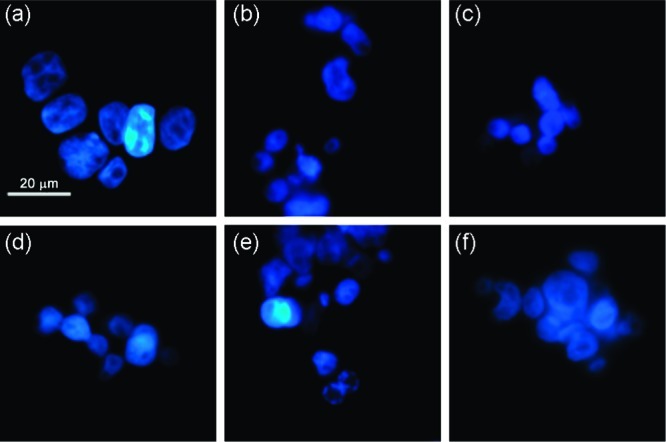
Hoechst 33342 staining of GLC4 cell line after exposure to different receptors for 24 h: (a) untreated cells (control), (b) cells treated with receptor 2, (c) cells treated with receptor 4, (d) cells treated with receptor 7, (e) cells treated with receptor 8, (f) cells treated with receptor 9. (a–c) Cells with normal nuclear morphology; (d–f) cells with condensation of the nuclei and nuclei with “bean shape”.
Conclusions
We have shown that fluorination of previously reported tripodal anion transporters can result in a significant increase of orders of magnitude in the transmembrane transport activity of this type of compound, leading to detectable anion transmembrane fluxes at transporter to lipid ratios of 1:250000. Vesicle studies and U-tube experiments using ion-selective electrodes and fluorescent dyes indicate that compounds 1–10 function as mobile carriers that can mediate the transport of anions predominantly via an anion exchange mechanism, including chloride/nitrate, chloride/bicarbonate and a small amount of chloride/sulfate antiport, even though HCl symport can also occur. We propose that the main reason for the superior activity of the fluorinated receptors is due to their high lipophilicity, rather than to the differences in anion binding that were observed using 1H NMR titrations and single-crystal X-ray crystallography. We have also provided initial evidence that the active fluorinated anion transporters can function as anticancer agents in vitro. We suggest that apoptosis triggered by changes in the intracellular pH, brought on by the ion transport ability of the fluorinated tripodal receptors, is responsible for the observed antitumor activity.
Acknowledgments
P.A.G. thanks the EPSRC and the NSF for funding (M.W.) and the EPSRC for access to the crystallographic facilties at the University of Southampton. Additionally we thank the University of Southampton for a postgraduate scholarship (N.B.). This work has been partially supported by a grant from the Spanish government (F.I.S.) and the European Union (PI10/00338).
Supporting Information Available
Synthesis and characterization of the receptors, stability constant determination, stack plots and fitplots of the 1H NMR titrations with various anions in DMSO/water solutions, Job plots in DMSO/water solutions, details about the X-ray structure determination, details and figures about the X-ray crystal structures, various vesicle assay methods, Hill plots, U-tube experiments, cell viability assays, acridine orange staining assays, Hoechst 33342 staining assays, supporting figures, and complete ref (38b). This material is available free of charge via the Internet at http://pubs.acs.org.
Supplementary Material
References
- Ashcroft F. M.Ion Channels and Disease; Academic Press: San Diego and London, 2000. [Google Scholar]
- a Higgins C. Nature 1992, 358, 536. [DOI] [PubMed] [Google Scholar]; b Choi J. Y.; Muallem D.; Kiselyov K.; Lee M. G.; Thomas P. J.; Muallem S. Nature 2001, 410, 94–97. [DOI] [PMC free article] [PubMed] [Google Scholar]
- a Jentsch T. J.; Hubner C. A.; Fuhrmann J. C. Nat. Cell Biol. 2004, 6, 1039–1047. [DOI] [PubMed] [Google Scholar]; b Jentsch T. J.; Maritzen T.; Zdebik A. A. J. Clin. Invest. 2005, 115, 2039–2046. [DOI] [PMC free article] [PubMed] [Google Scholar]
- a Davis J. T.; Okunola O.; Quesada R. Chem. Soc. Rev. 2010, 39, 3843–3862. [DOI] [PubMed] [Google Scholar]; b Brotherhood P. R.; Davis A. P. Chem. Soc. Rev. 2010, 39, 3633–3647. [DOI] [PubMed] [Google Scholar]; c Gokel G. W.; Barkey N. New J. Chem. 2009, 33, 947–963. [Google Scholar]; d Davis A. P.; Sheppard D. N.; Smith B. D. Chem. Soc. Rev. 2007, 36, 348–357. [DOI] [PMC free article] [PubMed] [Google Scholar]; e Gale P. A. Acc. Chem. Res. 2011, 44, 216–226. [DOI] [PubMed] [Google Scholar]
- a Chloride Movements Across Cellular Membranes. In Advances in Molecular and Cell Biology; Pusch M., Ed.; Elsevier: San Diego, 2007; Vol 38. [Google Scholar]; b Jentsch T. J.; Stein V.; Weinrich F.; Zdebik A. A. Phys. Rev. 2002, 82, 503–568. [DOI] [PubMed] [Google Scholar]
- Matsuyama S.; Llopis J.; Deveraux Q. L.; Tsien R. Y.; Reed J. C. Nat. Cell Biol. 2000, 2, 318–325. [DOI] [PubMed] [Google Scholar]
- a Sessler J. L.; Eller L. R.; Cho W.-S.; Nicolaou S.; Aguilar A.; Lee J. T.; Lynch V. M.; Magda D. J. Angew. Chem., Int. Ed. 2005, 44, 5989–5992. [DOI] [PubMed] [Google Scholar]; b Sato T.; Konno H.; Tanaka Y.; Kataoka T.; Nagai K.; Wasserman H. H.; Ohkuma S. J. Biol. Chem. 1998, 273, 21455–21462. [DOI] [PubMed] [Google Scholar]; c Ohkuma S.; Sato T.; Okamoto M.; Matsuya H.; Arai K.; Kataoka T.; Nagai K.; Wasserman H. H. Biochem. J. 1998, 334, 731–741. [DOI] [PMC free article] [PubMed] [Google Scholar]
- Dobler M.Ionophores and Their Structures; Wiley: New York, 1981. [Google Scholar]
- a Davis J. T. In Topics in Heterocyclic Chemistry; Gale P. A., Dehaen W., Eds.; Springer: New York, 2010; Vol. 24, pp 145–176. [Google Scholar]; b Seganish J. L.; Davis J. T. Chem. Commun. 2005, 5781–5783. [DOI] [PubMed] [Google Scholar]
- a Williamson N. R.; Fineran P. C.; Leeper F. J.; Salmond G. P. C. Nat. Rev. Microbiol. 2006, 4, 887–899. [DOI] [PubMed] [Google Scholar]; b Williamson N. R.; Fineran P. C.; Gristwood T.; Chawrai S. R.; Leeper F. J.; Salmond G. P. Future Microbiol. 2007, 2, 605–618. [DOI] [PubMed] [Google Scholar]; c Melvin M. S.; Calcutt M. W.; Noftle R. E.; Manderville R. A. Chem. Res. Toxicol. 2002, 15, 742–748. [DOI] [PubMed] [Google Scholar]; d Pérez-Tomás R.; Montaner B.; Llagostera E.; Soto-Cerrato V. Biochem. Pharmacol. 2003, 66, 1447–1452. [DOI] [PubMed] [Google Scholar]
- a Shank L. P.; Broughman J. R.; Takeguchi W.; Cook G.; Robbins A. S.; Hahn L.; Radke G.; Iwamoto T.; Schultz B. D.; Tomich J. M. Biophys. J. 2006, 90, 2138–2150. [DOI] [PMC free article] [PubMed] [Google Scholar]; b Schlesinger P. H.; Ferdani R.; Liu J.; Pajewska J.; Pajewski R.; Saito M.; Shabany H.; Gokel G. W. J. Am. Chem. Soc. 2002, 124, 1848–1849. [DOI] [PubMed] [Google Scholar]; c You L.; Ferdani R.; Li R.; Kramer J. P.; Winter R. E. K.; Gokel G. W. Chem.—Eur. J. 2008, 14, 382–396. [DOI] [PMC free article] [PubMed] [Google Scholar]
- a Gorteau V.; Bollot G.; Mareda J.; Perez-Velasco A.; Matile S. J. Am. Chem. Soc. 2006, 128, 14788–14789. [DOI] [PubMed] [Google Scholar]; b Gorteau V.; Bollot G.; Mareda J.; Matile S. Org. Biomol. Chem. 2007, 5, 3000–3012. [DOI] [PubMed] [Google Scholar]; c Gorteau V.; Julliard M. D.; Matile S. J. Membr. Sci. 2008, 321, 37–42. [Google Scholar]; d Mareda J.; Matile S. Chem.—Eur. J. 2009, 15, 28–37. [DOI] [PubMed] [Google Scholar]
- a McNally B. A.; Koulov A. V.; Smith B. D.; Joos J.-B.; Davis A. P. Chem. Commun. 2005, 1087–1089. [DOI] [PubMed] [Google Scholar]; b McNally B. A.; Koulov A. V.; Lambert T. N.; Smith B. D.; Joos J.-B.; Sisson A. L.; Clare J. P.; Sgarlata V.; Judd L. W.; Magro G.; Davis A. P. Chem.—Eur. J. 2008, 14, 9599–9606. [DOI] [PMC free article] [PubMed] [Google Scholar]; c Judd L. W.; Davis A. P. Chem. Commun. 2010, 46, 2227–2229. [DOI] [PubMed] [Google Scholar]; d Hussain S.; Brotherhood P. R.; Judd L. W.; Davis A. P. J. Am. Chem. Soc. 2011, 133, 1614–1617. [DOI] [PubMed] [Google Scholar]
- a Tong C. C.; Quesada R.; Sessler J. L.; Gale P. A. Chem. Commun. 2008, 6321–6323. [DOI] [PMC free article] [PubMed] [Google Scholar]; b Fisher M. G.; Gale P. A.; Hiscock J. R.; Hursthouse M. B.; Light M. E.; Schmidtchen F. P.; Tong C. C. Chem. Commun. 2009, 3017–3019. [DOI] [PubMed] [Google Scholar]; c Gale P. A.; Tong C. C.; Haynes C. J. E.; Adeosun O.; Gross D. E.; Karnas E.; Sedenberg E. M.; Quesada R.; Sessler J. L. J. Am. Chem. Soc. 2010, 132, 3240–3241. [DOI] [PMC free article] [PubMed] [Google Scholar]
- a Sidorov V.; Kotch F. W.; Abdrakhmanova G.; Mizani R.; Fettinger J. C.; Davis J. T. J. Am. Chem. Soc. 2002, 124, 2267–2278. [DOI] [PubMed] [Google Scholar]; b Okunola O. A.; Seganish J. L.; Salimian K. J.; Zavalij P. Y.; Davis J. T. Tetrahedron 2007, 63, 10743–10750. [Google Scholar]; c Izzo I.; Licen S.; Maulucci N.; Autore G.; Marzocco S.; Tecilla P.; De Riccardis F. Chem. Commun. 2008, 2986–2988. [DOI] [PubMed] [Google Scholar]
- Andrews N. J.; Haynes C. J. E.; Light M. E.; Moore S. J.; Tong C. C.; Davis J. T.; Harrell W. A. Jr; Gale P. A. Chem. Sci. 2011, 2, 256–260. [Google Scholar]
- Busschaert N.; Gale P. A.; Haynes C. J. E.; Light M. E.; Moore S. J.; Tong C. C.; Davis J. T.; Harrell J. W. A. Chem. Commun. 2010, 46, 6252–6254. [DOI] [PubMed] [Google Scholar]
- Valiyaveettil S.; Engbersen J. F. J.; Verboom W.; Reinhoudt D. N. Angew. Chem., Int. Ed. 1993, 32, 900–901. [Google Scholar]
- a Lakshminarayanan P. S.; Ravikumar I.; Suresh E.; Ghosh P. Chem. Commun. 2007, 5214–5215. [DOI] [PubMed] [Google Scholar]; b Ravikumar I.; Lakshminarayanan P. S.; Arunachalam M.; Suresh E.; Ghosh P. Dalton Trans. 2009, 4160–4168. [DOI] [PubMed] [Google Scholar]; c Ravikumar I.; Ghosh P. Chem. Commun. 2010, 46, 1082–1084. [DOI] [PubMed] [Google Scholar]
- a Custelcean R.; Moyer B. A.; Hay B. P. Chem. Commun. 2005, 5971–5973. [DOI] [PubMed] [Google Scholar]; b Custelcean R.; Remy P.; Bonnesen P. V.; Jiang D.-E.; Moyer B. A. Angew. Chem., Int. Ed. 2008, 47, 1866–1870. [DOI] [PubMed] [Google Scholar]; c Custelcean R.; Bock A.; Moyer B. A. J. Am. Chem. Soc. 2010, 132, 7177–7185. [DOI] [PubMed] [Google Scholar]
- a Jose D. A.; Kumar D. K.; Ganguly B.; Das A. Inorg. Chem. 2007, 46, 5817–5819. [DOI] [PubMed] [Google Scholar]; b Wu B.; Liang J.; Yang J.; Jia C.; Yang X.-J.; Zhang H.; Tang N.; Janiak C. Chem. Commun. 2008, 1762–1764. [DOI] [PubMed] [Google Scholar]
- Winstanley K. J.; Allen S. J.; Smith D. K. Chem. Commun. 2009, 4299–4301. [DOI] [PubMed] [Google Scholar]
- Berezin S. K.; Davis J. T. J. Am. Chem. Soc. 2009, 131, 2458–2459. [DOI] [PubMed] [Google Scholar]
- a Boon J. M.; Smith B. D. J. Am. Chem. Soc. 1999, 121, 11924–11925. [Google Scholar]; b Sasaki Y.; Shukla R.; Smith B. D. Org. Biomol. Chem. 2004, 2, 214–219. [DOI] [PubMed] [Google Scholar]
- a Purser S.; Moore P. R.; Swallow S.; Gouverneur V. Chem. Soc. Rev. 2008, 37, 320–330. [DOI] [PubMed] [Google Scholar]; b Hagmann W. K. J. Med. Chem. 2008, 51, 4359–4369. [DOI] [PubMed] [Google Scholar]; c Böhm H.-J.; Banner D.; Bendels S.; Kansy M.; Kuhn B.; Müller K.; Obst-Sander U.; Stahl M. ChemBioChem 2004, 5, 637–643. [DOI] [PubMed] [Google Scholar]
- Smart B. E. J. Fluorine Chem. 2001, 109, 3–11. [Google Scholar]
- Hynes M. J. J. Chem. Soc., Dalton Trans. 1993, 311–312. [Google Scholar]
- Hunter C. A. Angew. Chem., Int. Ed. 2004, 43, 5310–5324. [DOI] [PubMed] [Google Scholar]
- Raposo C.; Almaraz M.; Martin M.; Wienrich V.; Mussóns Ma. L.; Alcázar V.; Caballero Ma. C.; Morán J. R. Chem. Lett. 1995, 759–760. [Google Scholar]
- a Gale P. A.; Hiscock J. R.; Moore S. J.; Caltagirone C.; Hursthouse M. B.; Light M. E. Chem. Asian. J. 2010, 5, 555–561. [DOI] [PubMed] [Google Scholar]; b Gale P. A.; Hiscock J. R.; Jie C. Z.; Hursthouse M. B.; Light M. E. Chem. Sci. 2010, 1, 215–220. [Google Scholar]; c Duke R. M.; O’Brien J. E.; McCabe T.; Gunnlaugsson T. Org. Biomol. Chem. 2008, 6, 4089–4092. [DOI] [PubMed] [Google Scholar]; d Caltagirone C.; Bates G. W.; Gale P. A.; Light M. E. Chem. Commun. 2008, 61–63. [DOI] [PubMed] [Google Scholar]; e Evans L. S.; Gale P. A.; Light M. E.; Quesada R. New J. Chem. 2006, 30, 1019–1025. [Google Scholar]
- Crystal structures have been submitted to the Cambridge Crystallographic Data Centre and were allocated the deposition numbers CCDC 830473–830486.
- a Steiner T. Angew. Chem., Int. Ed. 2002, 41, 48–76. [Google Scholar]; b Jeffrey G. A.An Introduction to Hydrogen Bonding; Oxford University Press: Oxford, 1997. [Google Scholar]
- Ravikumar I.; Ghosh P. Chem. Commun. 2010, 46, 6741–6743. [DOI] [PubMed] [Google Scholar]
- Gamez P.; Mooibroek T. J.; Teat S. J.; Reedijk J. Acc. Chem. Res. 2007, 40, 435–444. [DOI] [PubMed] [Google Scholar]
- a Smith B. D.; Lambert T. N. Chem. Commun. 2003, 2261–2268. [DOI] [PubMed] [Google Scholar]; b Koulov A. V.; Lambert T. N.; Shukla R.; Jain M.; Boon J. M.; Smith B. D.; Li H.; Sheppard D. N.; Joos J.-B.; Clare J. P.; Davis A. P. Angew. Chem., Int. Ed. 2003, 42, 4931–4933. [DOI] [PubMed] [Google Scholar]
- Marcus Y. J. Chem. Soc., Faraday Trans. 1991, 87, 2995–2999. [Google Scholar]
- a Cleland W. W.; Andrews T. J.; Gutteridge S.; Hartman F. C.; Lorimer G. H. Chem. Rev. 1998, 98, 549–561. [DOI] [PubMed] [Google Scholar]; b Cordat E.; Casey J. R. Biochem. J. 2009, 417, 423–439. [DOI] [PubMed] [Google Scholar]
- a Rousselle A. V.; Heymann D. Bone 2002, 30, 533–540. [DOI] [PubMed] [Google Scholar]; b Bok D.; et al. Nat. Genet. 2003, 34, 313–319. [DOI] [PubMed] [Google Scholar]; c Vaughan-Jones R. D.; Spitzer K. W.; Swietach P. J. Mol. Cell. Cardiol. 2009, 46, 318–331. [DOI] [PubMed] [Google Scholar]
- a Kano K.; Fendler J. H. Biochim. Biophys. Acta, Biomembr. 1978, 509, 289–299. [DOI] [PubMed] [Google Scholar]; b Clement N. R.; Gould J. M. Biochemistry 1981, 20, 1534–1538. [DOI] [PubMed] [Google Scholar]
- Biwersi J.; Tulk B.; Verkman A. S. Anal. Biochem. 1994, 219, 139–143. [DOI] [PubMed] [Google Scholar]
- McNally B. A.; O’Neil E. J.; Nguyen A.; Smith B. D. J. Am. Chem. Soc. 2008, 130, 17274–17275. [DOI] [PMC free article] [PubMed] [Google Scholar]
- a Ipsen J. H.; Karlström G.; Mouritsen O. G.; Wennerström H.; Zuckermann M. J. Biochim. Biophys. Acta 1987, 905, 162–172. [DOI] [PubMed] [Google Scholar]; b McMullen T. P. W.; Lewis R. N. A. H.; McElhaney R. N. Curr. Opin. Colloid Interface Sci. 2004, 8, 459–468. [Google Scholar]; c Holthuis J. C. M.; van Meer G.; Huitema K. Mol. Membr. Biol. 2003, 20, 231–241. [PubMed] [Google Scholar]; d Bennett W. F. D.; MacCallum J. L.; Tieleman D. P. J. Am. Chem. Soc. 2009, 131, 1972–1978. [DOI] [PubMed] [Google Scholar]
- Murillo O.; Suzuki I.; Abel E.; Murray C. L.; Meadows E. S.; Jin T.; Gokel G. W. J. Am. Chem. Soc. 1997, 119, 5540–5549. [Google Scholar]
- a Hill A. V. Biochem. J. 1913, 7, 471–480. [DOI] [PMC free article] [PubMed] [Google Scholar]; b Bhosale S.; Matile S. Chirality 2006, 18, 849–856. [DOI] [PubMed] [Google Scholar]
- Ghose A. K.; Pritchett A.; Crippen G. M. J. Comput. Chem. 1988, 9, 80–90. [Google Scholar]
- Spartan ’08 for Macintosh; Wavefunction Inc.: Irvine, CA, U.S.A., 2008. [Google Scholar]
- a Thangaraju M.; Sharma K.; Leber B.; Andrews D. W.; Shen S.-H.; Srikant C. B. J. Biol. Chem. 1999, 274, 29549–29557. [DOI] [PubMed] [Google Scholar]; b Thangaraju M.; Sharma K.; Liu D.; Shen S.-H.; Srikant C. B. Cancer Res. 1999, 59, 1649–1654. [PubMed] [Google Scholar]
- Shrode L. D.; Tapper H.; Grinstein S. J. Bioenerg. Biomembr. 1997, 29, 393–399. [DOI] [PubMed] [Google Scholar]
- Ohta T.; Arakawa H.; Futagami F.; Fushida S.; Kitagawa H.; Kayahara M.; Nagakawa T.; Miwa K.; Kurashima K.; Numata M.; Kitamura Y.; Terada T.; Ohkuma S. J. Pathol. 1998, 185, 324–330. [DOI] [PubMed] [Google Scholar]
- Hansen M. B.; Nielsen S. E.; Berg K. J. Immunol. Methods 1989, 119, 203–210. [DOI] [PubMed] [Google Scholar]
- a Smith P. B.; Crespi C. Biochem. Pharmacol. 2002, 63, 1941–1948. [DOI] [PubMed] [Google Scholar]; b Onderwater R. C. A.; Commandeur J. N. M.; Groot E. J.; Sitters A.; Menge W. M. P. B; Vermeulen N. P. E. Toxicology 1998, 125, 117–129. [DOI] [PubMed] [Google Scholar]; c Svarovsky S. A.; Simoyi R. H.; Makarov S. V. J. Phys. Chem. B 2001, 105, 12634–12643. [Google Scholar]
- Holtzman E. In Lysosomes; Plenum Press: New York, 1989, pp 95–100. [Google Scholar]
- Allison A. C.; Young M. R. In Lysosomes in Biology and Pathology; Dingle J. T., Fell H. B., Eds.; North Holland Publishing: Amsterdam-London, 1969; Vol. 2, pp 600–628. [Google Scholar]
- Hernandez P. I.; Moreno D.; Javier A. A.; Torroba T.; Pérez-Tomás R.; Quesada R. Chem. Commun. 2011, 10.1039/c1cc11300c. [DOI] [PubMed] [Google Scholar]
Associated Data
This section collects any data citations, data availability statements, or supplementary materials included in this article.


