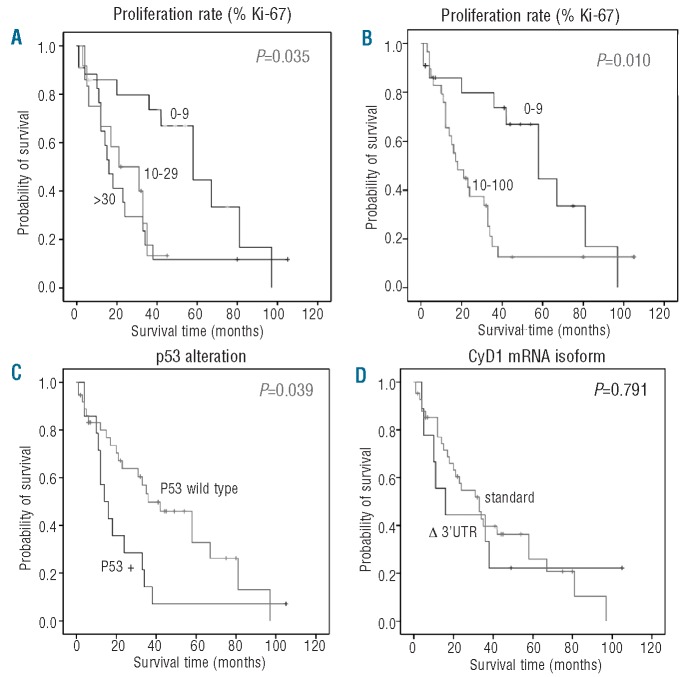
Figure 4.
Overall survival analysis (Kaplan-Meier curves) of 51 MCL patients. (A) according to separation into three groups with high (>30% MIB1-positivity), medium (11–30% MIB1-positivity) and low proliferation index (0–10% MIB1-positivity), (B) separation into two groups with a cut-off of 10% as determined by maximally selected log-rank statistics (C) according to p53 status and (D) according to predominant cyclin D1 (CyD1) isoform expression.

