

Background: FGFR2-mediated Nanog gene repression plays a central role in cell fate regulation of blastocysts and ES cells.
Results: FGFR2 homodimerization in ES cells rapidly down-regulated Nanog transcription without dissociation of active transcription factors.
Conclusion: The data illustrate how FGFR2 can induce reversible Nanog down-regulation.
Significance: The study provides insight underlying how FGFR2 dominates early cell fate decision in a potentially reversible manner.
Keywords: Cell Differentiation, Development, Embryonic Stem Cell, Gene Transcription, Signal Transduction, Fibroblast Growth Factor Receptor 2, Nanog, Primitive Endoderm
Abstract
Nanog or Gata6-positive cells co-exist and are convertible within the inner cell mass of murine blastocysts and embryonic stem (ES) cells. Previous studies demonstrate fibroblast growth factor receptor 2 (FGFR2) triggers Nanog gene down-regulation and differentiation to primitive endoderm (PE); however, the underlying mechanisms responsible for reversible and fluctuating cell fate are poorly understood. Using an inducible FGFR2 dimerization system in ES cells, we demonstrate that FGFR2 activation rapidly down-regulated Nanog gene transcription through activation of the Mek pathway and subsequently differentiated ES cells into PE cells. FGFR2 rather selectively repressed the Nanog gene with minimal effect on other pluripotency genes, including Oct4 and Sox2. We determined the Nanog promoter region containing minimum Oct4/Sox2 binding sites was sufficient for this transcriptional down-regulation by FGFR2, when the reporter transgenes were integrated with insulators. Of interest, FGFR2-mediated Nanog transcriptional reduction occurred without dissociation of RNA polymerase II, p300, Oct4, Sox2, and Tet1 from the Nanog proximal promoter region and with no increase in repressive histone methylation marks or DNA methylation, implying the gene repression is in the early and transient phase. Furthermore, addition of a specific FGFR inhibitor readily reversed this Nanog repression status. These findings illustrate well how FGFR2 induces rapid but reversible Nanog repression within ES cells.
Introduction
One of the earliest cell specification processes during embryonic development involves commitment of pluripotent cells of the inner cell mass to either the epiblast lineage, which forms the embryo proper, or to the extraembryonic PE3 lineage, which sustains the developing embryo. This process begins in the early blastocyst stage embryo when two transcription factors Nanog and Gata6 are heterogeneously expressed and fluctuate in individual cells (1, 2). These fluctuations are resolved and cells are properly sorted by the late blastocyst stage, where inner epiblast cells express Nanog, and outer PE cells express Gata6 (1).
Strikingly, murine ES cells derived from the inner cell mass of preimplantation blastocysts maintain a similar Nanog and Gata6 heterogeneity and fluctuation in culture (3, 4). Indeed, any given murine ES cell culture can be divided into two populations: Nanog-high cells and Nanog-low cells, which express the PE marker Gata6, indicating ES cells closely resemble the inner cell mass cells from which they are derived (3). This in vitro system thus serves as a powerful system to define molecular mechanisms underlying how this lineage ambiguity is maintained in an earliest stage of embryonic life.
Fibroblast growth factor (FGF) ligands, their receptors, and downstream signaling cascades control many important processes during mammalian development, including proliferation, migration, and differentiation (5, 6). Among the 22 FGF ligands and five receptors, FGF4 and FGFR2 are critical during mouse early embryonic development as null mutations in these are lethal around the time of implantation (2). FGF4 is the most highly expressed FGF ligand in the preimplantation embryo, where it is detectable in the eight-cell morula and later becomes restricted to the epiblast of the late blastocyst stage embryo (2). FGFR2 is also the major receptor expressed in the blastocyst embryo, though FGFR1 is also found and is thought to function later in the embryo as null embryos display post-implantation abnormalities (2).
Previous studies both in vivo and in vitro have shown that FGF is a key external signaling factor to trigger PE differentiation. Disruption of FGFR2 prevents PE formation (7), and when FGF signaling is blocked by overexpression of a dominant negative mutant of FGFR2 or by the FGFR-specific inhibitor SU5042, PE layer formation is eliminated (8–10). In addition, disruption of Grb2 prevents the formation of PE in blastocysts, a phenotype that can be rescued by expression of a Grb2-Sos fusion protein (11). Introduction of an active Ras mutant in ES cells results in PE differentiation (12). Furthermore, Mek was determined to be a responsible downstream protein kinase using Mek mutants and specific inhibitors (13). Together, these studies suggest the FGFR2/Grb2/Ras/Mek pathway plays a vital role in PE specification.
Although FGFR activation of the Mek pathway has been demonstrated to be central to this process of PE commitment, it is poorly understood how the FGFGR/Mek signal leads to downstream transcriptional changes, i.e. Nanog down-regulation and Gata6 up-regulation. Currently, two major cis-regulatory regions have been implicated in the control of Nanog gene expression: the proximal promoter region and the distal enhancer region. Oct4 and Sox2 proteins or Oct4 and Sox binding protein bind to each other and to the Nanog promoter <200 bp upstream of the transcription start site and are necessary and sufficient for transcription (14, 15). In addition, many other activating and repressive transcription factors have been identified to associate with the Nanog regulatory regions (16, 17); however, to date, the mechanism is largely undetermined regarding how the FGFR/Mek signal modifies Nanog gene transcription. We previously demonstrated that addition of sodium vanadate, a protein tyrosine phosphatase inhibitor, to ES cell aggregation cell culture can block the negative feedback loop of protein tyrosine phosphorylation and is sufficient to induce FGFR-mediated Nanog down-regulation (13). Cellular signaling is complex and difficult to further dissect in this system as sodium vanadate inhibits a broad range of protein tyrosine phosphatases and conventional ES cell culture uses fetal calf serum that contains a variety of growth factors. To this end, here we developed an inducible system to specifically activate the FGFR2 isotype and downstream signaling using a synthetic small molecule and sought to illustrate how the FGFR signal leads to a reversible Nanog down-regulation.
EXPERIMENTAL PROCEDURES
Murine Embryonic Stem Cell Culture
Murine ES cells weremaintained in an undifferentiated state on gelatin-coated cell culture dishes in knock-out Dulbecco's modified Eagle's medium (KO DMEM; Invitrogen) supplemented with 10% knock-out serum replacement (Invitrogen), 1% fetal bovine serum (FBS; Atlanta Biologicals, Norcross, GA), 2 mm l-glutamine, 100 units/ml penicillin, 100 μg/ml streptomycin, 25 mm HEPES (Mediatech, Manassas, VA), 300 μm monothioglycerol (Sigma), and 1000 units/ml recombinant mouse leukemia inhibitory factor (LIF) (ESGRO; Chemicon, Temecula, CA). ES cells were maintained at 37 °C in 5% CO2.
FGFR2 Plasmid Construction and Stable Cell Line Creation
We generated transgenic ES cells with an inducible FGFR2 activation system using the Argent regulated homodimerization kit (Ariad Pharmaceuticals, Inc., Cambridge, MA). The portion of the pC4M-Fv2E plasmid containing a myrisotoylation signal, two tandem FK506 binding domains (FKBP36V), and a C-terminal hemagglutinin (HA) tag was digested using EcoRI and BamHI restriction enzymes. The digested region was then ligated into the pCAG-IRES-Hyg plasmid. This modified plasmid allows for constitutive expression in ES cells driven by the chicken β-actin promoter and provides a hygromycin resistance gene for clonal selection. The cytoplasmic domains of FGFR2 were PCR-amplified using the forward primer (5′-GACTAGTATGAAGACCACGACCAAGAAGC-3′) and the reverse primer (5′-GCTCTAGATGTTTTAACACTGCCGTTTATGT-3′). Following amplification, the PCR fragment was digested with SpeI and ligated in-frame into the SpeI site of the pCAG-F36V-IRES-Hyg vector at the C-terminal end of the F36V domain. R1 ES cells were transfected with the vector and were selected with hygromycin (200 μg/ml) for 2 weeks, and individual clones were isolated and expanded.
Immunocytochemistry and X-Gal Staining
Immunostaining was performed on ES cells grown on chamber slides (Falcon, Franklin Lakes, NJ). Cells were first fixed in 3.7% formaldehyde for 15 min at room temperature, permeabilized for 5 min at room temperature with 0.5% Triton X-100 in PBS, blocked for 30 min in 1% BSA in PBS, and incubated with HA tag antibody (1:100 dilution; Cell Signaling, 2367) at 1:100 dilution for 2 h at room temperature. Cells were washed six times with PBS and incubated with a rhodamine anti-mouse secondary antibody (1:100; Jackson ImmunoResearch Laboratories; 115-295-66) for 1 h. Microscopy was performed using an Olympus IX70 inverted fluorescent microscope with an Optronics digital camera. The system was run by MagnaFire software (version 2.1). X-Gal staining was performed using the in situ β-galactosidase staining kit (Stratagene, Cedar Creek, TX) according to the manufacturer's instructions. Cells were grown in medium containing LIF and were treated with AP20187 (10 nm) plus dimethyl sulfoxide vehicle control, SU5402 (20 μm), PD98059 (25 μm), or LY294002 (20 μm). Medium was removed, and cells were fixed and stained in a solution containing 1 mg/ml X-gal. Cells were incubated overnight at 37 °C and analyzed by bright field light microscopy at room temperature.
Immunoblot Analysis
Cells were lysed in 100 μl of radioimmune precipitation assay buffer (50 mm Tris-Cl, pH 7.4, 150 nm NaCl, 1% Nonidet P-40, 0.25% sodium deoxycholate, and protease inhibitors), and cell lysate protein concentrations were determined by DC Protein Assay (Bio-Rad). 10 μg of lysate per lane was separated through polyacrylamide by SDS-PAGE using 4–15% gradient mini-PROTEAN TGX precast gels (Bio-Rad). Proteins were transferred to a 0.2-mm nitrocellulose ready gel blotting sandwich membrane (Bio-Rad). Blocking was performed with 4% BSA in Tris-buffered saline Tween 20 (TBST; 100 mm NaCl, 50 mm Tris, 0.05% Tween 20, pH 7.5) on a shaking platform for 1 h at room temperature. Membranes were incubated with anti-Nanog (1:1,000 dilution; Chemicon; AB5731), Oct4 (1:1,000 dilution; Santa Cruz Biotechnology; sc-5279), Sox2 (1:1,000 dilution; Santa Cruz Biotechnology; sc-20088), or β-actin (1:1,000 dilution; Cell Signaling; 4970) overnight at 4 °C. Washing was performed with TBST, and membranes were incubated with horseradish peroxidase-conjugated immunoglobulin G (1:5,000 dilution; Santa Cruz Biotechnology) for secondary antibody. Proteins were visualized using enhanced chemiluminescence detection (Pierce, Thermo Scientific). Anti-phosphotyrosine (Cell Signaling, 9411) and β-actin (Cell Signaling, 4967) blot and multiplex blot using anti-phospho-90RSK, phosphor-Akt, phosphor-Erk1/2, phosphor-S6, and eIF4E immunoblots (Cell Signaling, 5301) were performed by Cell Signaling Technology using 30 μg/lane of protein on a 4–20% gradient gel. Blots were developed using LI-COR Odyssey near infrared imaging system.
Real-time RT-PCR
For reverse-transcription polymerase chain reaction (RT-PCR), total RNA was extracted using the RNAqueous kit (Ambion, Austin, TX). To remove contaminating DNA from the RNA preparation, we used the TURBO DNA-free kit (Ambion). First-strand cDNA synthesis was carried out using the High capacity cDNA reverse transcription kit using random primers (Applied Biosystems, Foster City, CA). Quantitative polymerase chain reaction was performed using Power SYBR Green dye (Applied Biosystems). Primers were designed using Primer3 software (18) to conform to general guidelines suggested in the SYBR Green PCR Master Mix Protocol (Applied Biosystems). Samples were run in duplicate or triplicate, and standard curves were generated for each primer set on each PCR run. Reactions were performed on the MJ Research DNA Engine Opticon 2 real-time PCR instrument using Opticon Monitor software (version 3.1.32, Bio-Rad). Gene expression analysis was performed using the comparative CT method using β-actin for normalization. Primer sequences can be found in supplemental Table 1.
ChIP
ChIP was performed as described previously (19). Chromatin was sheared to a size of 200–1000 bp, with an average of 500 bp on ice using a Fisher Scientific Sonic Dismembrator Model 100 (Fisher Scientific). In general, 10 pulses of 10 s of sonication at a power setting of 4 with a 1-min rest between pulses was sufficient to shear chromatin to the desired size. Antibodies used for ChIP are as follows: H3K4me3 (Millipore, 07-473), H3K9me3 (Abcam, ab8898), H3K27me3 (Millipore, 17–622), H3K36me3 (Abcam, ab9050), RNA polymerase II (Abcam, ab5131), p300 (Santa Cruz Biotechnology, sc-584), Sox2 (Santa Cruz Biotechnology, sc-17320X), Oct 3/4 (Santa Cruz Biotechnology, sc-8628X), and Tet1 (Millipore, 09-872).
DNA was purified using the QIAquick PCR purification kit (Qiagen, Germantown, MD). PCR was performed using quantitative real-time PCR as described above with slight modifications to DNA samples. Each IP sample was diluted 1:5 in autoclaved dH2O, whereas input samples were diluted 1:50 in autoclaved dH2O. Standard curves for each primer set were prepared by generating serial dilutions of input DNA (1:10, 1:100, 1:1,000, and 1:10,000). Each sample (IP and input) was run in triplicate for each primer set. Protein binding enrichment was analyzed by calculating % input. Primer sequences used for real-time PCR analysis for ChIP can be found in supplemental Table 1.
DNA Methylation
CpG methylation of the proximal promoter region of the Nanog gene was examined using a bisulfite sequencing method as described previously (20, 21).
Luciferase Plasmid Construction
Luciferase reporter plasmids containing insulator elements were constructed using two copies of the 1.2-kb chicken β-globin core HS4 insulator from the pJC13-1 plasmid (22). pJC13-1 was cut with SalI, blunt ended using T4 DNA polymerase (New England Biolabs), and cut with BamHI to obtain the 2.4-kb HS4 insulator. The pENTR/H1/TO plasmid (Invitrogen) containing zeocin and kanamycin resistance genes was digested with BglII and EcoRV to prepare for ligation of the HS4 insulator. After, the BamHI digested end was ligated to the cohesive compatible end BglII, whereas the SalI-digested blunted end was ligated to the blunt end provided by EcoRV digestion to create the plasmid pHS4-Zeo. To insert a luciferase reporter driven by Nanog or thymidine kinase promoter activity, the previously constructed Nanog −332 bp pGL2-basic reporter was digested with the KpnI, purified, and digested with BamHI and PvuI, and the 3.1-kb fragment containing the Nanog promoter and luciferase reporter was ligated to pHS4-Zeo digested with KpnI and BamHI to generate p5′HS4–330Luc-Zeo. Subsequent reporters with varying promoters were easily constructed by digesting p5′HS4–330Luc-Zeo with SpeI and NotI and PCR amplifying promoter inserts with an SpeI restriction site in the forward primer and a Not1 restriction site in the reverse primer.
Stable Transfection Reporter Assays
Insulated luciferase reporter constructs were digested with NheI, and transfections were carried out as described above using 2 μg of DNA luciferase reporter vector co-transfected with the puromycin-resistant selectable vector pCAG ER Puro. ES cells were selected with 1.25 μg/ml of puromycin for 14 days, and individual colonies were manually picked up and transferred to a 24-well plate. After expansion of individual clones, cells were plated at 6 × 10⁴ cells per well in a six-well cell culture dish and treated with AP20187 for 0, 6, or 24 h. Total RNA was extracted from cells, and cDNA was synthesized as described above. Real-time PCR was carried out as described using primers specific for endogenous Nanog, luciferase, or β-actin gene expression.
Statistics
Statistical significance was determined using a two-tailed t test with a p value of < 0.01.
RESULTS
Inducible FGFR2 Homodimerization System
Previous studies have demonstrated protein homodimerization can be induced using the human cytoplasmic protein FK506 binding protein (FKBP) with a single F36V (Fv) amino acid substitution upon addition of a synthetic small molecule dimerizer AP20187 (23–25). This system initiates intracellular signaling pathways when expressed in cells as a fusion protein containing drug (Fv FKBP) binding domains linked to intracellular signaling domains. To control fibroblast growth factor signal transduction in ES cells, we constructed a pharmacologically inducible FGFR2 receptor by expressing two Fv FKBP domains linked to the intracellular FGFR2 domain, which is targeted to the inner face of the plasma membrane through the myristoylation signal, and dimerization is induced by addition of the dimerizer AP20187 (Fig. 1, A and B). Additionally, we created an Fv FKBP homodimerization system, which lacks FGFR2 intracellular domains to serve as a negative control (supplemental Fig. 1A). Stable ES cell clones were generated containing control or FGFR2 homodimerization systems (hereafter called FGFR2 ES cells), and constitutive expression was confirmed by immunocytochemistry staining for the C-terminal hemagglutinin (HA) epitope tag (Fig. 1B, supplemental Fig. 1A).
FIGURE 1.

Inducible FGFR2 homodimerization system stimulates tyrosine and Erk1/2 phosphorylation. A, schematic representation of the FGFR2 activation system. The AP20187 synthetic ligand binds to two FKBP domains located on the inner face of the plasma membrane. Ligand binding induces fusion protein dimerization and activates FGFR2 kinase domains to initiate downstream signal transduction. B, plasmid constructs for generation of FGFR2 FKBP activation system and imunocytochemistry staining of ES cell clones that stably express FGFR2 FKBP activation system using an anti-HA antibody. Scale bar, 100 μm. C and D, ES cells stably expressing FGFR2 homodimerization system were treated with or without AP20187 (10 nm) over a time course (15 min to 3 h). Immunoblotting was performed using anti-phosphotyrosine and β-actin control antibodies (C) or anti-phospho-p90RSK, Akt, Erk1/2, S6, and control eIF4E antibodies (D). CAG, cytomegalovirus early enhancer/chicken β-actin promoter; MW, molecular weight; Myr, myristoylation signal; IRES, internal ribosome entry site.
FGFR2 Dimerization Effectively Induced PE Differentiation and Nanog Gene Repression through the Mek Pathway
Using 10 nm AP20187, we confirmed FGFR2 homodimerization could induce tyrosine phosphorylation of the fusion protein. As expected, we saw an increase in tyrosine phosphorylation in the 78-kDa fusion protein and did not see a band corresponding to wild type FGFR2 receptor at 92 kDa (Fig. 1C). In addition, we examined phosphorylated substrates p90RSK, Akt, Erk1/2, and S6 ribosomal protein (Fig. 1D). Erk1/2 was rapidly phosphorylated within 15 min of AP20187 treatment, and p90RSK, a downstream effector of Erk1/2, was also phosphorylated, although not as robustly. S6 kinase ribosomal protein is known to be phosphorylated by various mitogen and growth factors, and accordingly, we saw an increase in S6 phosphorylation following FGFR2 homodimerization.
Next, we examined whether FGFR2 homodimerization can induce PE differentiation using ES cells harboring a GFP transgene under the control of the α-fetoprotein (AFP) promoter that we described previously (26). When AFP-GFP FGFR2 ES cells were treated with AP20187 for 48 h, the compact, dome-shaped colony appearance was lost, and cells adopted a dispersed, differentiated morphology, and some cells became GFP-positive, indicating these cells differentiate along the PE lineage (Fig. 2A). Furthermore, we confirmed differentiation to PE lineage in these cells by RT-PCR analysis. We found that Nanog mRNA was down-regulated in FGFR2 ES cells treated with AP20187 for 48 h, and these cells additionally express markers of PE including Gata6 and AFP (Fig. 2B). Interestingly, these cells continue to express the pluripotency associated gene Oct4. In addition to transcripts, we also examined protein levels of Nanog, Oct4, and Sox2 over a time course of AP20187 treatment (Fig. 2C). Notably, we found Nanog protein was down-regulated by 6 h, which in conjunction with the Nanog mRNA data, indicates Nanog was down-regulated following FGFR2 homodimerization. Oct4 and Sox 2 proteins were less affected and maintained through 24 h of homodimerization.
FIGURE 2.

FGFR2 homodimerization induces Nanog down-regulation and PE differentiation. A, AFP-GFP ES cells stably expressing FGFR2 homodimerization system were treated with or without AP20187 (10 nm) for 48 h. Images of representative colonies are shown using phase contrast (upper panels) or GFP filter (lower panels) microscopy. Scale bars, 200 μm. B, RT-PCR analysis of gene expression in FGFR2 ES cells treated with or without AP20187 (10 nm) for 48 h. C, immunoblotting was performed over an AP20187 (10 nm) treatment time course (0–24 h). D, FGFR2 homodimerization-induced Nanog down-regulation can be prevented by FGFR or Mek1/2 inhibitors. Nanog β-geo ES cells containing F36V FGFR2 construct were treated with AP20187 (10 nm) for 48 h and either vehicle control (dimethyl sulfoxide (DMSO)), FGFR inhibitor (SU5402; 20 μm), Mek1/2 inhibitor (PD98059; 25 μm), or PI3K inhibitor (Lys-94002; 20 μm) and stained with X-gal to examine Nanog expression. Scale bar, 200 μm.
The critical role of the FGFR/Mek kinase activities in Nanog down-regulation was confirmed using Nanog β-geo cells in which β-galactosidase is expressed under the control of endogenous Nanog promoter (Fig. 2D) (26). In untreated ES cells, we found Nanog was heterogeneously expressed, which is consistent with our previously reported observations (3). In cells treated with AP20187 and the FGFR inhibitor SU5402, we saw an increase and more homogeneous Nanog expression pattern, in agreement with the fact that blocking FGFRs can improve ES cell maintenance (27). In addition, AP20187 treatment with the Mek inhibitor PD98059 partially rescued Nanog expression, indicating that this pathway is important for Nanog down-regulation. In contrast, AP20187-induced cells treated with the PI3K inhibitor LY294002 did not prevent Nanog down-regulation. These effects were not seen in ES cell clones treated with AP20187, which contained the control homodimerization plasmid rather than the FGFR2 kinase domains (supplemental Fig. 1B).
This partial rescue of Nanog expression indicates either the Mek inhibitor is unable to completely abrogate strong FGFR2 stimulation induced by AP20187 treatment or that additional FGFR2 signaling pathways may contribute to Nanog repression. We have previously shown that PI3K or Jnk inhibition does not likely contribute to Nanog repression during ES cell aggregation (13).
FGFR2 Dimerization Rapidly and Selectively Induced Nanog Down-regulation
We next examined the kinetics of Nanog down-regulation comparing two common methods of ES cell differentiation to our system of FGFR2 homodimerization. Both LIF withdrawal and retinoic acid addition to the medium are previously known to down-regulate Nanog and induce differentiation (26). Nanog gene expression was examined using real-time RT-PCR in ES cells differentiated for 0, 3, 6, or 24 h. LIF and retinoic acid treated cells showed slightly reduced Nanog expression by 6 h, and this reduction become more pronounced by 24 h when Nanog expression was at half the level seen in undifferentiated ES cells (Fig. 3A). In contrast, Nanog expression was noticeably reduced by 30 min after FGFR2 homodimerization and continued to steadily decrease until transcript expression was significantly reduced over 80% by 6 and 24 h (Fig. 3A).
FIGURE 3.

FGFR2 homodimerization rapidly reduces Nanog transcription. A, real-time PCR analysis of Nanog mRNA in ES cells induced to differentiate using LIF removal, retinoic acid treatment (1 μm), or FGFR2 homodimerization using AP20187 (10 nm). Cells were harvested over the differentiation time course (0–24 h). Average mRNA value relative to β-actin is expressed as fold change over time, where 0 h is set to a value of 1. B, a heatmap from microarray analysis of FGFR2 ES cells stimulated with AP20187 (10 nm) for 0, 1, 3, and 6 h. C, real-time PCR analysis of key pluripotency genes mRNA for Nanog, Oct4, Sox2, PE marker Gata6, and pre-spliced mRNA for Nanog and Oct4. ES cells were harvested after 0, 6, or 24 h of treatment with AP20187 (10 nm). Average mRNA value of five experiments relative to β-actin is expressed as fold change over time, where 0 h is set to a value of 1. Error bars indicate S.D. *, p < 0.01.
To address the specificity of gene down-regulation following FGFR2 stimulation, we performed gene expression profiling using FGFR2 ES cells treated with 0, 1, 3, or 6 h of AP20187. Although many genes were up-regulated by FGFR2 stimulation, we found that gene down-regulation occurred only in a small percentage of genes (Fig. 3B). Examination of Nanog mRNA by real-time RT-PCR confirmed this gene is rapidly and significantly down-regulated following FGFR2 stimulation (Fig. 3C). Interestingly, in contrast to Nanog, Oct4 and Sox2 expression is gradually lost over 6 and 24 h of FGFR2 stimulation of differentiation (Fig. 3C), indicating that Nanog is rapidly and selectively down-regulated among these key pluripotency genes. As expected and confirming earlier experiments, FGFR2 stimulation induces PE differentiation, as seen with a significant increase in Gata6 transcripts by 24 h (Fig. 3C).
FGFR2 Dimerization Induced Transcriptional Repression of Nanog
The rapid reduction in Nanog mRNA and protein following FGFR2 stimulation led us to examine whether Nanog is down-regulated at the transcription or post-transcription level. To do this, we examined Nanog pre-spliced mRNA (pre-mRNA) by real-time PCR using intron and exon sense and antisense primers, respectively. As a control, we also examined expression of Oct4 pre-mRNA because we did not see a decrease in Oct4 mRNA previously. We found FGFR2 stimulation induced a rapid and significant down-regulation in Nanog pre-mRNA, which paralleled our previous Nanog mRNA results, indicating Nanog was no longer highly transcribed (Fig. 3C). In contrast, and as we expected, Oct4 pre-mRNA did not decrease significantly over the time course of FGFR2 stimulation. These data indicate that Nanog was transcriptionally down-regulated following FGFR2 dimerization.
To further investigate changes in transcription and chromatin status of the Nanog gene after FGFR2 stimulation, we examined the status of histone modifications and enrichment of RNA polymerase II, and p300 at the Nanog locus ranging from −1,500 to +5,600 bp (Fig. 4A). In undifferentiated ES cells, we found the H3K36me3 modification was enriched toward the 3′ end of the Nanog coding region (Fig. 4B), a distribution consistent with previous reports of K36me3 in active chromatin (28, 29), and indicates that the Nanog gene is actively transcribed and elongation of the transcript occurs. After 6 h of differentiation induced by AP20187, we saw a noticeable decrease in enrichment toward the 3′ end of the gene. This pattern suggests that transcriptional elongation was decreased in these differentiated cells at this early time point. By 24 h of differentiation, this pattern was significant, with a near total loss of the K36me3 modification throughout the Nanog locus. This further supports a model where FGFR2 homodimerization down-regulates Nanog gene expression at the transcriptional level.
FIGURE 4.

The status of histone modifications and active transcription factors at the Nanog locus after FGFR2 homodimerization. A, schematic of Nanog locus with location of real-time PCR primers for analysis of chromatin immunoprecipitation assays. B–G, real-time PCR analysis of enrichment of active markers histone H3 lysine 36 trimethylation (B), histone H3 lysine 4 trimethylation (C), RNA polymerase II (D), co-activator p300 (E), and repressive markers histone H3 lysine 9 trimethylation (F) and histone H3 lysine 27 trimethylation (G) at the Nanog locus in ES cells harvested after 0, 6, or 24 h of treatment with AP20187 (10 nm). Enrichment is expressed as % input. Samples were run in triplicate for each primer, and the average % input is plotted. Error bars indicate S.D. *, p < 0.01. ESC, ES cell.
The H3K4me3 mark was predominantly enriched in undifferentiating ES cells near the transcription start site (Fig. 4C). Unexpectedly, FGFR2 ES cells treated with AP20187 for 6 h display a significant increase in enrichment of H3K4me3 in the 5′ promoter region, around the transcription start site, and a marked increase into the first intron. This broadening enrichment was largely decreased in FGFR2 ES cells treated with AP20187 for 24 h though increased enrichment remained in the promoter region of the gene.
We next examined enrichment of RNA polymerase II using an antibody that specifically recognizes the phosphorylated CTD serine 5 version of the enzyme, which indicates RNA polymerase II initiation. Here we found undifferentiated ES cells display enrichment for RNA polymerase II around the transcription start site (Fig. 4D). Similar to the enrichment of H3K4me3, this binding pattern increased in ES cells stimulated with AP20187 for 6 h. By 24 h of AP20187 dimerization, binding of RNA Polymerase II was significantly reduced to a very low level, indicating Nanog is no longer actively transcribed by 24 h. In addition, we also examined binding of the transcriptional co-activator p300. We found p300 was slightly enriched at the transcription start site in undifferentiated ES cells and that this pattern was not significantly changed following 6 or 24 h of FGFR2 homodimerization induced by AP20187 (Fig. 4E). It is possible that this co-activator protein dissociates from the locus at a later time.
We also examined histone modifications H3K9me3 and H3K27me3, which are associated with repressed chromatin. Undifferentiated ES cells displayed very low enrichment of both modifications over the entire gene locus, as expected (Fig. 4, F and G). In 6- and 24-h FGFR2-stimulated cells, however, we did not see an increase in these modifications. Note that % input was much lower in the H3K9me3 and H3K27me3 associations when compared with other histone marker associations above.
Additionally, Tet1 association to the Nanog gene was examined in the system (Fig. 5A). Tet1 has been recently shown to associate with the Nanog proximal promoter region and to prevent Nanog repression and DNA methylation (30). We found enrichment of Tet1 in undifferentiated ES cells at the Oct4/Sox2 binding site of the Nanog promoter and that this association was not altered within 24 h of FGFR2 dimerization. In contrast, there was no Tet1 association in mouse embryonic fibroblasts. Indeed, DNA methylation of the Nanog promoter region was not increased either within 16 h of FGFR2 dimerization (Fig. 5B).
FIGURE 5.
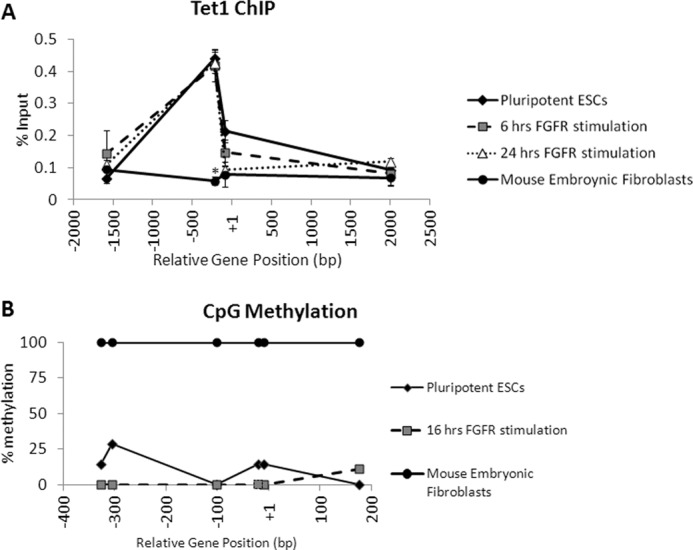
FGFR2 homodimerization does not induce Tet1 dissociation from the Nanog promoter region or CpG methylation. A, real-time PCR analysis of enrichment of Tet1 at the Nanog gene locus in ES cells harvested after 0, 6, or 24 h of treatment with AP20187 and in mouse embryonic fibroblasts. Enrichment is expressed as % input. B, CpG methylation (%) at the Nanog proximal promoter region in ES cells harvested after 0 or 16 h of treatment with AP20187 and in mouse embryonic fibroblasts. *, p < 0.01.
Proximal Promoter Region Is Sufficient for FGFR2 Dimerization-induced Nanog Down-regulation
To determine the region of the Nanog promoter responsive to FGFR2 stimulation, we constructed reporter vectors containing various length Nanog promoter regions driving expression of firefly luciferase. Previously, Oct4 and Sox2 binding sites located between −180 and −165 bp upstream of the Nanog transcription start site have been shown to be essential for transcriptional activation (14, 15). To maintain a sufficient level of reporter gene activity, we generated 332- and 190-bp Nanog promoter length luciferase reporters, which contain Oct4 and Sox2 binding sequences. To examine these reporters in a more natural chromatin arrangement and to protect transgenes from positional effects, we stably integrated these reporters flanked on the 5′ end by two copies of the well characterized chicken β-globin HS4 insulator. Though transgenes are ideally flanked by insulator elements, it is also possible to insert insulator elements on only one side of the transgene because transgenes are typically inserted as multiple copies in a single location. To follow this strategy, we removed unnecessary vector backbone and co-transfected FGFR2 ES cells with insulated Nanog luciferase reporter and a plasmid containing the puromycin resistance gene driven by the CAG promoter to generate stable clones using drug selection.
Four transgenic stable cell lines were stimulated by FGFR2 dimerization, and the kinetics of luciferase and endogenous Nanog transcript mRNA were compared by real-time PCR. We found that endogenous Nanog and luciferase transcripts displayed similar kinetics in both the 330- and 190-bp reporters. In each case, endogenous Nanog mRNA and luciferase mRNA were rapidly down-regulated after 6 and 24 h of FGFR2 dimerization by AP20187 treatment (Fig. 6, A and B). These results indicated this 190-bp promoter is sufficient for FGFR2 mediated Nanog repression. Interestingly, this reporter promoter ends just 5′ to the Oct4 and Sox2 consensus binding sites.
FIGURE 6.

Oct4 and Sox2 consensus binding sites are sufficient for FGFR2-mediated Nanog repression. A, schematic of insulated Nanog promoter or TK promoter reporters. Two copies of HS4 insulator elements from the chicken β-globin locus (indicated in red) are located 5′ to the reporter transgene. 330- and 190-bp Nanog promoters contain only Nanog promoter sequence driving luciferase reporter activity. For the 155-bp TK reporter, Oct4/Sox2 consensus sequence from the Nanog locus was inserted upstream of the thymidine kinase minimal promoter and the 190-bp thymidine kinase control reporter lacks endogenous Nanog sequence, containing only thymidine kinase promoter driving luciferase reporter activity. FGFR2 ES cells were stably integrated with a 330-bp Nanog promoter (B), 190-bp Nanog promoter (C), Oct4/Sox2 Nanog TK promoter (D), or control TK promoter (E). Insulated Nanog reporter cell lines were harvested after 0, 6, or 24 h of treatment with AP20187 (10 nm). Real-time PCR was performed to examine expression of endogenous Nanog or luciferase transcripts. Average mRNA expression value relative to β-actin is expressed as fold change over time, where 0 h is set to a value of 1. Each graph displays average values of four clones, with two experiments for each clone. Error bars indicate S.D. *, p < 0.01.
To examine whether the Oct4/Sox2 consensus sequences are important for FGFR2 mediated Nanog down-regulation, we constructed additional insulated luciferase reporter vectors containing only the Oct4/Sox2 consensus binding sequence from the Nanog promoter (−185 to −160) followed by a minimal thymidine kinase (TK) promoter (−155 to +50), which maintains the distance between the binding elements and the transcription start site, and a minimal TK promoter (−190 to +50) lacking any Nanog sequence to serve as a control reporter. The Oct4/Sox2 TK reporter also responded to FGFR2 dimerization, as seen by a significant decrease in both endogenous Nanog and luciferase transcripts in stable clones treated with AP20187 for 6 and 24 h (Fig. 6C). The kinetics of luciferase down-regulation appear slightly slower than Nanog down-regulation, which is especially noticeable at the 6-h time point. However, by 24 h of AP20187 treatment, these transcripts were down-regulated to comparable levels. This indicates the −190 to −160 region of the Nanog promoter contains an FGFR2 responsive element that mediates Nanog down-regulation. The control 190-bp TK reporter did not similarly decrease by 6 or 24 h (Fig. 6D), indicating the reduction in promoter activity is not a general phenomenon as it was not seen in the TK reporter lacking Nanog promoter elements. Interestingly, integration and insulator protection appears to be necessary to mediate FGFR2 induces Nanog down-regulation, as a transiently transfected or a stably integrated 330-bp Nanog promoter luciferase reporter, which lacked insulator elements did not similarly respond to FGFR2 dimerization (supplemental Table 2).
Nanog Down-regulation by FGFR2 Dimerization Does Not Coincide with Oct4/Sox2 Dissociation from Proximal Promoter
Because Oct4 and Sox2 are known to bind to each other and to the region of the Nanog promoter, we hypothesized one or both of these proteins may dissociate from the Nanog promoter to mediate down-regulation following FGFR2 stimulation. We examined Oct4 and Sox2 binding to the proximal promoter to determine whether enrichment of one or both factors is altered by FGFR2 stimulation. Using ChIP, we found that Oct4 and Sox2 were both enriched around the Oct4/Sox2 binding site in undifferentiated ES cells as previously reported and found that 6 h of FGFR2 stimulation did not significantly reduce binding, although after 24 h of FGFR2 stimulation, there did appear to be an overall decrease in Oct4 enrichment (Fig. 7, A and B). These data indicate that initial transcriptional down-regulation of Nanog by FGFR2 occurs without any reduction of Oct4/Sox2 binding to the proximal promoter region.
FIGURE 7.

FGFR2 homodimerization does not induce Oct4 and Sox2 dissociation from the Nanog promoter region. Real-time PCR analysis of enrichment of Oct4 (A) or Sox2 (B) at the Nanog locus in ES cells (ESCs) harvested after 0, 6, or 24 h of treatment with AP20187 (10 nm). Enrichment is expressed as % input. Samples were run in triplicate for each primer, and the average % input is plotted. Error bars indicate S.D.
FGFR2 Dimerization Induces Reversible Nanog Down-regulation
Because our ChIP data above indicated a relatively open chromatin conformation as well as association with active transcription factors within the proximal promoter region of Nanog, we sought to determine whether Nanog down-regulation following FGFR2 dimerization is reversible. To examine reversibility, we treated ES cells with AP20187 for 6 h, removed existing medium, washed the cells with PBS, added fresh medium containing a specific inhibitor of FGFR (SU5402), and harvested cells after 6 and 18 h. We found AP20187 treated cells display the characteristic Nanog down-regulation compared with untreated control ES cells within 6 h (Fig. 8). Interestingly, addition of the FGFR inhibitor rapidly restored Nanog mRNA expression within 6 h. These results suggest this process of Nanog down-regulation mediated by FGFR2 activation is a reversible process.
FIGURE 8.
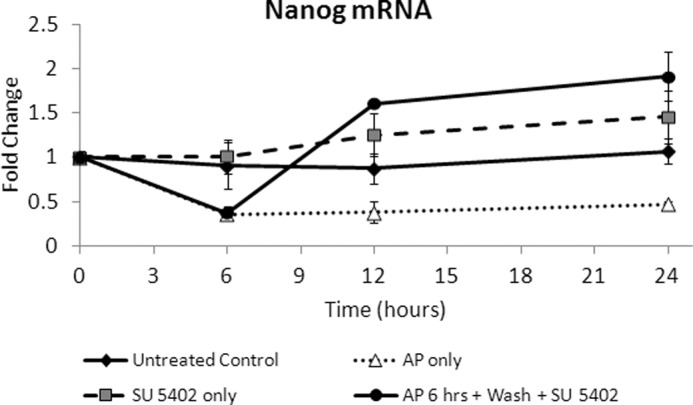
FGFR2 homodimerization induced Nanog down-regulation is reversible by addition of an FGFR inhibitor. Real-time PCR analysis of Nanog mRNA in ES cells treated with AP20187 (AP; 10 nm) alone, FGFR inhibitor SU5402 alone (20 μm), or AP20187 for 6 h followed by 6 or 18 h of FGFR inhibitor incubation. Average mRNA value relative to β-actin is expressed as fold change over time, where 0 h is set to a value of 1. Error bars indicate S.D.
DISCUSSION
The present work utilizes a system to induce FGFR2 homodimerization using the synthetic chemical dimerizer AP20187. We demonstrate that robust activation of FGFR2 kinase induces Erk1/2 phosphorylation as well as other intracellular signaling pathways in ES cells and is able to overcome heterogeneity of Nanog and Gata6 expression to induce Nanog down-regulation and PE differentiation rather homogeneously. Using inhibitors of FGFR, PI3K, or Mek1/2, we demonstrate the importance of the Mek signal in mediating Nanog down-regulation. Indeed, FGFR2 dimerization selectively down-regulates Nanog among the key pluripotency transcription factors Nanog, Oct4, and Sox2. This system of rapid and homogeneous Nanog down-regulation has enabled us to study underlying mechanisms.
The reduction in Nanog transcript was seen within 1 h and reached ∼90% by 6 h. Although the current study does not exclude the involvement of enhanced Nanog mRNA degradation, Nanog is likely transcriptionally down-regulated as both pre-spliced and mature mRNA are similarly reduced. In accordance with these results, we also found that the histone modification H3K36me3, which is associated with transcriptional elongation, is decreased after FGFR2 stimulation, indicating a reduction in elongating Nanog transcripts. Surprisingly, RNA polymerase II phosphorylated at serine 5 is not rapidly lost following 6 h of FGFR2 dimerization but is rather transiently enriched. This phosphorylated form of the enzyme is associated with transcript initiation, and accumulation around the transcription start site after 6 h of FGFR2 stimulation, at a time when Nanog is reduced to >90% suggests progressive elongation is not occurring. The persistence of RNA polymerase II enrichment could potentially be explained by RNA polymerase II stalling following initiation at the Nanog locus. Similarly, the persistent enrichment of H3K4me3 was seen following 6 h of FGFR2 dimerization, indicating this locus retains an open chromatin conformation in the early stages of differentiation.
The data of repressive histone modifications (K27me3 and K9me3) indicate that down-regulation of Nanog gene transcription is not accompanied by repressive chromatin changes within 24 h of FGFR2 activation. Recently, the protein Tet1, which hydroxylates 5-methylcytosine, has been shown to associate with the Nanog promoter region and is essential for preventing the Nanog gene from transcriptional repression and DNA methylation (30). Consistent with this repressive histone modification data, Tet1 association to the Nanog promoter region was not altered within 24 h of FGFR2 activation. Furthermore, DNA methylation of the region was not increased within 16 h of FGFR2 activation as well.
Furthermore, Nanog down-regulation occurred without dissociation of critical transcription activators Oct4 and Sox2 from its proximal promoter region. The retained components related to active transcription, including RNA polymerase II, p300, Oct4, Sox2, and Tet1, which were not rapidly lost even when Nanog was down-regulated may be related to natural fluctuations seen in Nanog in ES cell culture (4) and lend support to the idea that cells derived from the inner cell mass are plastic in their expression of Nanog and Gata6 (31). The ability of cells that are not actively expressing Nanog to maintain the locus in a poised state may facilitate the rapid re-expression of the gene during the stage when expression of Gata6 and Nanog are fluctuating prior to cell commitment to EPI or PE. Indeed, we found FGFR-induced Nanog down-regulation is reversible following treatment with the FGFR inhibitor SU5402. Taken together, the present study provides insight for mechanisms underlying how FGFR2 dominates early cell fate decision between epiblast and hypoblast in a potentially reversible manner.
How this transient repression is achieved despite association of these active transcriptional components remains an important question. Interestingly, we have demonstrated that a very minimal region of the Nanog promoter, which contains Oct4 and Sox2 binding elements is sufficient to mediate Nanog down-regulation in response to FGFR2 stimulation. Because Nanog promoter elements were not properly regulated in non-integrated reporters (supplemental Table 2), the chromatin structure, including nucleosome positioning, might be critical for appropriate gene regulation, a phenomenon that has been previously noted in a number of genes (32). Based on our experimental data of persistence of active transcriptional marks following FGFR2 stimulation, FGFR2 dimerization may induce association of repressor proteins with Oct4 or Sox2 to mask its activation domain; or Oct4 and Sox2 may serve as a scaffold for factors involved in transcriptional activation of the Nanog locus in undifferentiated cells and upon differentiation, these factors are replaced by proteins associated with gene repression (Fig. 9). The system developed here will be useful to identify differential binding partners of Oct4 and Sox2 in the active and transiently repressed Nanog promoter, thus dissecting further molecular mechanisms underlying FGFR2-mediated cell fate specification within the inner cell mass of the early blastocyst.
FIGURE 9.

Schematic overview of a reversible Nanog gene down-regulation upon FGFR2 activation. Pol, polymerase.
Supplementary Material
Acknowledgments
We thank Drs. Jörg Bungert, Steve Sugrue, Paul Oh, and Peter Sayeski (University of Florida) for helpful discussion and critical reading of the manuscript, and we also thank Milena Leseva for technical assistance.
This work was supported in part by National Institutes of Health Grants DK059699 and GM091238 (to N. T.).

This article contains supplemental Tables 1 and 2 and Fig. 1.
- PE
- primitive endoderm
- FGFR
- fibroblast growth factor receptor
- LIF
- leukemia inhibitory factor
- FKBP
- FK506 binding protein
- TK
- thymidine kinase.
REFERENCES
- 1. Chazaud C., Yamanaka Y., Pawson T., Rossant J. (2006) Early lineage segregation between epiblast and primitive endoderm in mouse blastocysts through the Grb2-MAPK pathway. Dev. Cell 10, 615–624 [DOI] [PubMed] [Google Scholar]
- 2. Lanner F., Rossant J. (2010) The role of FGF/Erk signaling in pluripotent cells. Development 137, 3351–3360 [DOI] [PubMed] [Google Scholar]
- 3. Singh A. M., Hamazaki T., Hankowski K. E., Terada N. (2007) A heterogeneous expression pattern for Nanog in embryonic stem cells. Stem Cells 25, 2534–2542 [DOI] [PubMed] [Google Scholar]
- 4. Chambers I., Silva J., Colby D., Nichols J., Nijmeijer B., Robertson M., Vrana J., Jones K., Grotewold L., Smith A. (2007) Nanog safeguards pluripotency and mediates germ line development. Nature 450, 1230–1234 [DOI] [PubMed] [Google Scholar]
- 5. Thisse B., Thisse C. (2005) Functions and regulations of fibroblast growth factor signaling during embryonic development. Dev. Biol. 287, 390–402 [DOI] [PubMed] [Google Scholar]
- 6. Roux P. P., Blenis J. (2004) ERK and p38 MAPK-activated protein kinases: A family of protein kinases with diverse biological functions. Microbiol. Mol. Biol. Rev. 68, 320–344 [DOI] [PMC free article] [PubMed] [Google Scholar]
- 7. Arman E., Haffner-Krausz R., Chen Y., Heath J. K., Lonai P. (1998) Targeted disruption of fibroblast growth factor (FGF) receptor 2 suggests a role for FGF signaling in pregastrulation mammalian development. Proc. Natl. Acad. Sci. U.S.A. 95, 5082–5087 [DOI] [PMC free article] [PubMed] [Google Scholar]
- 8. Chen Y., Li X., Eswarakumar V. P., Seger R., Lonai P. (2000) Fibroblast growth factor (FGF) signaling through PI 3-kinase and Akt/PKB is required for embryoid body differentiation. Oncogene 19, 3750–3756 [DOI] [PubMed] [Google Scholar]
- 9. Li L., Arman E., Ekblom P., Edgar D., Murray P., Lonai P. (2004) Distinct GATA6- and laminin-dependent mechanisms regulate endodermal and ectodermal embryonic stem cell fates. Development 131, 5277–5286 [DOI] [PubMed] [Google Scholar]
- 10. Li X., Chen Y., Schéele S., Arman E., Haffner-Krausz R., Ekblom P., Lonai P. (2001) Fibroblast growth factor signaling and basement membrane assembly are connected during epithelial morphogenesis of the embryoid body. J. Cell Biol. 153, 811–822 [DOI] [PMC free article] [PubMed] [Google Scholar]
- 11. Cheng A. M., Saxton T. M., Sakai R., Kulkarni S., Mbamalu G., Vogel W., Tortorice C. G., Cardiff R. D., Cross J. C., Muller W. J., Pawson T. (1998) Mammalian Grb2 regulates multiple steps in embryonic development and malignant transformation. Cell 95, 793–803 [DOI] [PubMed] [Google Scholar]
- 12. Yoshida-Koide U., Matsuda T., Saikawa K., Nakanuma Y., Yokota T., Asashima M., Koide H. (2004) Involvement of Ras in extraembryonic endoderm differentiation of embryonic stem cells. Biochem. Biophys. Res. Commun. 313, 475–481 [DOI] [PubMed] [Google Scholar]
- 13. Hamazaki T., Kehoe S. M., Nakano T., Terada N. (2006) The Grb2/Mek pathway represses Nanog in murine embryonic stem cells. Mol. Cell Biol. 26, 7539–7549 [DOI] [PMC free article] [PubMed] [Google Scholar]
- 14. Kuroda T., Tada M., Kubota H., Kimura H., Hatano S. Y., Suemori H., Nakatsuji N., Tada T. (2005) Octamer and Sox elements are required for transcriptional cis regulation of Nanog gene expression. Mol. Cell Biol. 25, 2475–2485 [DOI] [PMC free article] [PubMed] [Google Scholar]
- 15. Rodda D. J., Chew J. L., Lim L. H., Loh Y. H., Wang B., Ng H. H., Robson P. (2005) Transcriptional regulation of Nanog by OCT4 and SOX2. J. Biol. Chem. 280, 24731–24737 [DOI] [PubMed] [Google Scholar]
- 16. Chen X., Vega V. B., Ng H. H. (2008) Transcriptional regulatory networks in embryonic stem cells. Cold Spring Harb. Symp. Quant. Biol. 73, 203–209 [DOI] [PubMed] [Google Scholar]
- 17. Niwa H., Ogawa K., Shimosato D., Adachi K. (2009) A parallel circuit of LIF signaling pathways maintains pluripotency of mouse ES cells. Nature 460, 118–122 [DOI] [PubMed] [Google Scholar]
- 18. Steve R., Skaletsky H. (2000) Primer3 on the WWW for general users and for biologist programmers in Bioinformatics Methods and Protocols: Methods in Molecular Biology (Krawetz S., Misener S., eds.), pp. 365–386, Humana Press, Totowa, NJ: [DOI] [PubMed] [Google Scholar]
- 19. Kehoe S. M., Oka M., Hankowski K. E., Reichert N., Garcia S., McCarrey J. R., Gaubatz S., Terada N. (2008) A conserved E2F6-binding element in murine meiosis-specific gene promoters. Biol. Reprod. 79, 921–930 [DOI] [PMC free article] [PubMed] [Google Scholar]
- 20. Brower J. V., Lim C. H., Han C., Hankowski K. E., Hamazaki T., Terada N. (2009) Differential CpG island methylation of murine adenine nucleotide translocase genes. Biochim. Biophys. Acta 1789, 198–203 [DOI] [PMC free article] [PubMed] [Google Scholar]
- 21. Darst R. P., Pardo C. E., Pondugula S., Gangaraju V. K., Nabilsi N. H., Bartholomew B., Kladde M. P. (2012) Simultaneous single-molecule detection of endogenous C-5 DNA methylation and chromatin accessibility using MAPit. Methods Mol. Biol. 833, 125–141 [DOI] [PubMed] [Google Scholar]
- 22. Chung J. H., Whiteley M., Felsenfeld G. (1993) A 5′ element of the chicken β-globin domain serves as an insulator in human erythroid cells and protects against position effect in Drosophila. Cell 74, 505–514 [DOI] [PubMed] [Google Scholar]
- 23. Alfa R. W., Tuszynski M. H., Blesch A. (2009) A novel inducible tyrosine kinase receptor to regulate signal transduction and neurite outgrowth. J. Neurosci. Res. 87, 2624–2631 [DOI] [PMC free article] [PubMed] [Google Scholar]
- 24. Xian W., Pappas L., Pandya D., Selfors L. M., Derksen P. W., de Bruin M., Gray N. S., Jonkers J., Rosen J. M., Brugge J. S. (2009) Fibroblast growth factor receptor 1-transformed mammary epithelial cells are dependent on RSK activity for growth and survival. Cancer Res. 69, 2244–2251 [DOI] [PMC free article] [PubMed] [Google Scholar]
- 25. Kwiatkowski B. A., Kirillova I., Richard R. E., Israeli D., Yablonka-Reuveni Z. (2008) FGFR4 and its novel splice form in myogenic cells: Interplay of glycosylation and tyrosine phosphorylation. J. Cell Physiol. 215, 803–817 [DOI] [PMC free article] [PubMed] [Google Scholar]
- 26. Hamazaki T., Oka M., Yamanaka S., Terada N. (2004) Aggregation of embryonic stem cells induces Nanog repression and primitive endoderm differentiation. J. Cell Sci. 117, 5681–5686 [DOI] [PubMed] [Google Scholar]
- 27. Ying Q. L., Wray J., Nichols J., Batlle-Morera L., Doble B., Woodgett J., Cohen P., Smith A. (2008) The ground state of embryonic stem cell self-renewal. Nature 453, 519–523 [DOI] [PMC free article] [PubMed] [Google Scholar]
- 28. Li B., Carey M., Workman J. L. (2007) The role of chromatin during transcription. Cell 128, 707–719 [DOI] [PubMed] [Google Scholar]
- 29. Edmunds J. W., Mahadevan L. C., Clayton A. L. (2008) Dynamic histone H3 methylation during gene induction: HYPB/Setd2 mediates all H3K36 trimethylation. EMBO J. 27, 406–420 [DOI] [PMC free article] [PubMed] [Google Scholar]
- 30. Ito S., D'Alessio A. C., Taranova O. V., Hong K., Sowers L. C., Zhang Y. (2010) Role of Tet proteins in 5mC to 5hmC conversion, ES-cell self-renewal and inner cell mass specification. Nature 466, 1129–1133 [DOI] [PMC free article] [PubMed] [Google Scholar]
- 31. Mitsui K., Tokuzawa Y., Itoh H., Segawa K., Murakami M., Takahashi K., Maruyama M., Maeda M., Yamanaka S. (2003) The homeoprotein Nanog is required for maintenance of pluripotency in mouse epiblast and ES cells. Cell 113, 631–642 [DOI] [PubMed] [Google Scholar]
- 32. Smith C. L., Hager G. L. (1997) Transcriptional regulation of mammalian genes in vivo. A tale of two templates. J. Biol. Chem. 272, 27493–27496 [DOI] [PubMed] [Google Scholar]
Associated Data
This section collects any data citations, data availability statements, or supplementary materials included in this article.