

Background: Amyloid fibrils are protein aggregates associated with numerous neurodegenerative diseases.
Results: A theoretically consistent, two-parameter model is proposed describing very distinct amyloid fibrillization kinetics.
Conclusion: Amyloid fibril formation takes place by a general mechanism involving supersaturation-dependent nucleation and growth steps.
Significance: This mathematically simple model is expected to be routinely used to characterize the action of new targets for disease therapeutics.
Keywords: Amyloid, Biophysics, Kinetics, Mathematical Modeling, Thermodynamics
Abstract
Associated with neurodegenerative disorders such as Alzheimer, Parkinson, or prion diseases, the conversion of soluble proteins into amyloid fibrils remains poorly understood. Extensive “in vitro” measurements of protein aggregation kinetics have been reported, but no consensus mechanism has emerged until now. This contribution aims at overcoming this gap by proposing a theoretically consistent crystallization-like model (CLM) that is able to describe the classic types of amyloid fibrillization kinetics identified in our literature survey. Amyloid conversion represented as a function of time is shown to follow different curve shapes, ranging from sigmoidal to hyperbolic, according to the relative importance of the nucleation and growth steps. Using the CLM, apparently unrelated data are deconvoluted into generic mechanistic information integrating the combined influence of seeding, nucleation, growth, and fibril breakage events. It is notable that this complex assembly of interdependent events is ultimately reduced to a mathematically simple model, whose two parameters can be determined by little more than visual inspection. The good fitting results obtained for all cases confirm the CLM as a good approximation to the generalized underlying principle governing amyloid fibrillization. A perspective is presented on possible applications of the CLM during the development of new targets for amyloid disease therapeutics.
Introduction
Amyloid fibrils are insoluble ordered structures sharing a common cross β-sheet conformation and formed by misassembly of soluble proteins and peptides (1–3). Because these protein aggregates are associated with numerous neurodegenerative diseases, a great deal of effort has been put into understanding the mechanisms of amyloid fibril formation (4–6). Several biophysical methods have been developed to measure the kinetics of protein aggregation “in vitro” (7–11). Thioflavin-T binding fluorescence (12) and turbidity measurements (13) are among the most widely adopted techniques. Despite the limitations of the classical methods (14), they provide quantitative information about the mass increase of amyloid fibrils with time. Typically, the progress of fibrillization is expressed as the normalized fraction of amyloid protein converted into fibrils (α); on a mass basis, α corresponds to the quotient of the fibril mass increase Δm at a given instant divided by the total mass of fibrils formed at the end of the assay ΔmT.
 |
The time-course results represented in Fig. 1 exemplify well two types of kinetics usually observed during amyloid fibril formation. The sigmoidal α(t) trend obtained for β2-microglobulin (β2m)2 (15) (open symbols) is characteristic of nucleation-dependent polymerization; an initial lag phase is followed by a phase of rapid growth and then by a stationary phase (16, 17). The hyperbolic shape obtained for transthyretin (closed symbols) is more frequently found during seeded aggregation, i.e. when an aliquot of solution containing preformed fibrils is added to the amyloidogenic solution to bypass the thermodynamically unfavorable nucleation step (8, 17, 18). Nevertheless, as shown by this example, the absence of a lag phase is also reported for unseeded reactions (18, 19). Between the classical sigmoidal kinetics, showing an inflection point at αi = 0.5, and the hyperbolic/seeded polymerization kinetics, showing no evident inflection point, there are a number of intermediate possibilities that have been comprehensively reviewed by Finke and co-workers (4, 20). As discussed in those reviews, the meaning of the different shapes has been interpreted over the last 50 years according to several thermodynamic and kinetic mechanisms. Given the complexity and variability of the protein aggregation models, a modular approach was recently proposed to systematically identify the mechanism that best describes nucleation (or prepolymerization), growth (or polymerization), and fragmentation steps (15). The available fundamental models are in general highly specific for the amyloid polypeptide under study. Models containing a high number of parameters cannot fit to experimental data in a unique way, whereas some of the theoretical elementary steps refer to time frames that are experimentally inaccessible. Overparameterization makes it hard to validate different parts of mechanistically elaborated models (21), which is recognized as a problem in protein aggregation modeling (22). In the pursuit of a consensual, two-parameter model for describing protein aggregation kinetics, the 1997 Finke-Watzky mechanism for transition-metal nanocluster formation (23) was successfully applied to a wide range of kinetic data (4, 20). In the formulation of the Finke-Watzky model, slow continuous nucleation is followed by autocatalytic surface growth so that the overall rate of protein concentration decrease is given by
 |
with k1 and k2 being, respectively, the nucleation and growth average rate constants. For an initial protein concentration C0, the solution of the ordinary differential equation can be expressed as
 |
Note that the difference (C0 − C) corresponds, by mass balance, to the instantaneous concentration of protein aggregates (20). The Finke-Watzky equation is interconvertible by algebraic manipulation into the Saitô and co-workers equation (24) and into the equation of Fernández et al. (25), which, however, depart from different mechanistic assumptions (see supplemental Table S1). When the nucleation rates are very low (k1 → 0), Equation 2 reduces to the differential form of the logistic function, which is commonly used to fit sigmoidal aggregation data (4, 16). Ferrone's equation (26) is another example of a two-parameter protein aggregation model available in literature that predicts the monomer concentration to decrease with the square of time. Although avoiding overparameterization, these models are very useful from a practical point of view, although some simplifying hypothesis adopted during their derivation may lack solid biophysical basis. For example, Saitô and co-workers (24) and Fernández et al. (25) describe elementary kinetic steps by reaction-like rate equations that are first-order in relation to the fractional conversion of monomers into fibrils expressed as α and/or (1 − α). In an alternative formalism, Finke and co-workers consider (4, 27) the fibrillar state as the autocatalytic, polymeric form of the protein and express the elementary rate laws as a function of the protein concentrations in the solubilized and aggregated forms. Although theoretically more appropriate, the Finke-Watzky formalism results in the paradox that according to Equation 2, all the dissolved protein is expected to convert into fibrils, i.e. the expected steady-state concentration is C∞ = 0. This is not possible in the light of the general phase equilibrium condition and is not supported by measurements of dissolved protein concentration after long incubation times (18, 28, 29). Finally, the applicability of Ferrone's quadratic equation is inherently limited to the early data points corresponding to ∼10–20% of total monomer loss (22).
FIGURE 1.

Time-dependent normalized fluorescence signal representing typical sigmoidal (open symbols) and hyperbolic (closed symbols) aggregation kinetics of amyloid proteins during amyloidogenesis. For visual clarity, trend lines are represented, and the time axis is normalized by the time for 95% conversion (t95) for each case. Open symbols correspond to the experimental data obtained by Xue et al. (15) using 61 μm β2m; t95 = 15.6 h. Closed symbols represent continuous fluorescence data from Hurshman et al. (18) obtained for 0.15 mg/ml M-TTR, which we digitized into periodic data and normalized by the end-point signal; t95 = 23.4 s.
Kinetic modeling of amyloid fibrillization reactions has also been performed using empirical equations such as linear and exponential decay functions (30). As recently pointed out by Auer and Kashchiev (31) while discussing the applicability of the Avrami equation, it does not seem coincidental that such mathematically simple models are able to describe the α(t) dependence for a wide range of polypeptides and amyloidogenic conditions. With the present contribution, we seek the general principle that seems to govern the kinetics of protein aggregation. We intend to do it in a theoretically consistent way that does not compromise the final simplicity of the model nor its quantitative usefulness. An infinite number of parameter combinations producing equally good agreement with the data should be avoided; that is to say, all the dynamic state variables shall be condensed in a two-parameter model that can be uniquely fit to protein aggregation kinetics. Then, the deepest meaning of each constant should be possible to be determined by using different types of experimental data. For this mechanistic refinement to be possible, oversimplified hypothesis such as those identified in our literature survey should also be avoided during the derivation of the model.
THEORY
Resemblances between amyloid fibril formation and protein crystallization have long been recognized (17). Both processes involve the thermodynamic equilibrium between phases, an initial assembly of macromolecules into stable nuclei (nucleation step), and the subsequent formation of supramolecular structures by the successive addition of growth units (growth or elongation step). We propose now to quantitatively describe the aggregation kinetics of amyloid proteins using fundamental principles that are familiar to crystal growth scientists.
Thermodynamic Driving Force
We will start by defining the thermodynamic driving force for amyloid fibril formation as the variation in chemical potential Δμ occurring when protein molecules in a supersaturated amyloid solution at temperature T are transferred to a fibrillar state
 |
where k is the Boltzmann constant and a and a* are the activities of supersaturated and saturated amyloid solutions. This is analogous to the definition of supersaturation adopted in crystallization from solution (32). Accurate activity coefficients are difficult to obtain for highly nonideal concentrated solutions. For this reason, and for mathematical simplicity, we will define an approximate amyloid supersaturation σ as a function of protein concentration C and protein solubility C*
 |
The protein solubility corresponds to the concentration of dissolved protein that equilibrates the chemical potential of the insoluble fibrillar phase. In principle, C* is independent of the initial protein concentration and can be obtained from the remaining concentration of the polypeptide in solution after long reaction times (18). Nevertheless, when measuring protein aggregation in the presence of high macromolecular content (“macromolecular crowding”), volume-excluding effects may lead to different protein concentrations in equilibrium (33). We will return to this issue while discussing possible deviations from the CLM. The total amount of aggregates produced per unit of volume of solution ΔmT/V is given by the difference between the mass concentrations C0 and C*. Equation 5 can thus be rewritten to express amyloid supersaturation as a function of the fraction of protein converted into amyloid aggregates (α) and of the initial supersaturation (σ0).
 |
Nucleation Step
The mechanism leading to the formation of amyloid nuclei generally includes conformational changes of the native state (34) and different intermediate structures such as polymorphous and oligomeric aggregates (35, 36), whose nature and importance vary from protein to protein (4, 15). Although all of the transitions involve energy barriers of different magnitudes, we will consider that the rate-limiting step is the formation of a critical-sized amyloid nucleus. This postulation finds support in the well known fact that the addition of preformed fibrils to amyloidogenic solutions (seeding) completely eliminates the lag phase and induces immediate fibril formation. Classical nucleation theory (37, 38), based on which numerous phase transition phenomena occurring in nature and technology have been explained (39), will be used to estimate the frequency at which new fibrils are created. It is admitted that fluctuations in phase density give rise to the appearance of embryonic formations or nuclei that reduce the bulk free energy (due to the variation in chemical potential Δμ) and increase the surface free energy (due to the creation of a fibril/solution interface). Above a critical nucleus size, the process spontaneously evolves in the direction of amyloid fibril formation. Recently (38), the following expression was proposed for the critical number of monomeric peptides constituting the amyloid nucleus
 |
where ν is a constant accounting for the dimensions and interfacial energies of the nanosized fibril. In the same work, the nucleation rate J was expressed as a complex function of the thermodynamic driving force for amyloid fibril formation (38). We will adopt a simplified version of this relationship that takes into account the very high supersaturation levels associated with amyloidogenic conditions (18, 28, 29). For C/C* ratios much higher than 10, the equilibrium concentration of fibril nuclei is expected to increase linearly with C, greatly simplifying the expression of J to a second-order rate equation
with A being a σ-independent kinetic factor expressed in units of frequency per solution volume.
Growth Step
During this step, preformed fibrils grow by the successive addition of new structural units. Due to the existence of a preliminary fibril template, the growth (or elongation) step is thermodynamically favored over nucleation; although both processes co-exist during the early phases of incubation (16), fibril elongation is expected to become increasingly predominant (40). Advanced microscopy techniques show indefinite evidences of unidirectional (41–44) and bidirectional amyloid fibril growth (45, 46), reportedly involving intertwining of amyloid filaments and protofibrils (47). Whatever the mechanisms of assembly admitted to occur, phase transition during this step is mostly determined by a secondary nucleation process taking place on the surface of the protein aggregates (44, 48). Therefore, the elongation rate G is proportional to the frequency at which protein molecules leave the solution phase and reach the fibril surface. As previously stated by us for the case of crystal growth from solution (49–51), the attachment probability linearly increases with (i) supersaturation σ, which drives the diffusion of molecules toward the interface; and with (ii) the number of energetically favorable sites for integration. The later quantity was found to be proportional to crystal size during crystallization (49) and is here assumed to be proportional to the length of amyloid fibrils L or, more specifically, to the number of β-sheets constituting the solid phase. We depart from a nonactive binding mechanism, where the lateral binding of monomers is seen as a dynamic reservoir for their subsequent incorporation at both ends of the fibrils (52, 53) (Fig. 2). We further assume that surface adsorption is a reversible process followed by a fast surface diffusion step, which is not rate-limiting while monomers are being recruited into the active sites. The simplified expression for the rate of fibril elongation is thus given by
 |
where kg is a growth rate constant accounting for the influx of amyloidogenic protein molecules arriving to the fibril ends and undergoing conformational changes upon integration. For the constant cross-section area, the mass of fibrils linearly increases with L. Therefore, size-dependent growth provides a phenomenological explanation for the autocatalytic nature of amyloid protein aggregation (16, 55) and for the semiempirical evidences that the elongation rate is proportional to the mass of fibrils, directly as m-dependent growth (22) or indirectly as α-dependent growth (24) and (C0 − C)-dependent growth (4, 20). A more subtle consequence arising from Equation 9 is that unless specified otherwise by complementary rate laws, overall elongation rates are affected by the total mass of fibrils present in solution but not by their number. We will return to this point during the derivation of the mathematical model and during the discussion of its limitations.
FIGURE 2.
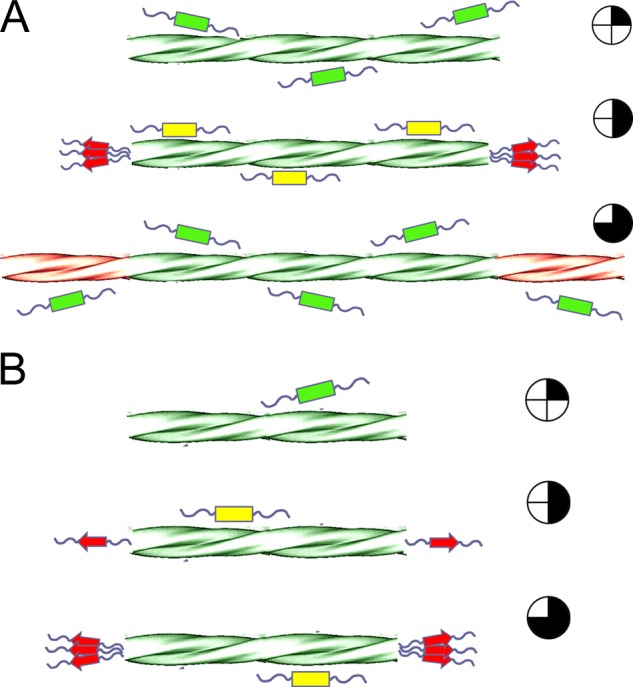
Schematic representation of size-dependent amyloid fibril growth. Monomers in solution (green rectangles) diffuse into the surface of fibrils, where they get reversibly adsorbed (yellow rectangles) and rapidly migrate to the fibril ends. Accumulation of adsorbed molecules at the active sites (red arrows) takes place until reaching the minimal number of monomers required for integration and subsequent regeneration of the fibril end. For β2m, this number was estimated from pre-steady-state kinetic measurements to be ∼10 monomers (52). Supported by the nonactive site binding mechanism (52, 53), we further assume that lateral migration of molecules is not rate-limiting so that the influx of monomers directly increases with fibril length as the attachment probability also increases. Accordingly, regeneration events take place faster in long fibrils (A) than in short fibrils (B); time lapse is represented by the blackened clock symbols on the right side. Helical representation of amyloid fibrils is adapted from Ref. 54.
Mathematical Model
Given the kinetics of nucleation and growth just defined, it is important to know how much and how fast amyloid fibrillization will take place. We will start by defining the mass of polypeptide aggregates, m, in the generic case of fibril formation using a mass of seeds m0 and taking into account the fibril size distribution.
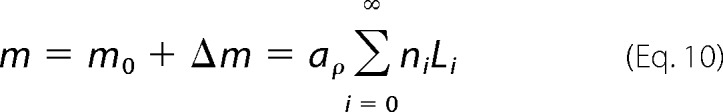 |
In the second part of the equation, aρ is the cross-section area multiplied by the mass density of amyloid fibrils, and it is assumed to not change significantly with time; ni is the number of fibrils with characteristic size Li. It follows that the rate at which m increases with time is given by
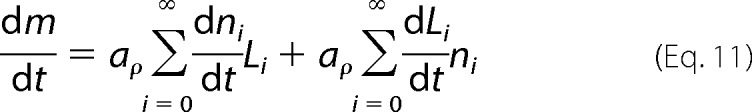 |
The first sum term accounts essentially for the formation of new amyloid nuclei containing n* molecules (Equation 7), which occurs at a nucleation frequency J (Equation 8). The second sum term refers to the size-dependent elongation of fibrils (Equation 9). Fibril breakage, although important for the final size distribution and for pathogenic proliferation (56, 57), is not expected by the CLM to influence the overall kinetics of m increase. On the one hand, fragmentation increases the number of fibrils but not their total mass, so the first sum term of Equation 11 remains constant. On the other hand, provided that the initial mass is the same, a large number of shorter and slow growing fibrils are expected to have the same total mass increase per time unit as fewer and fast growing fibrils. This is due to the condition of size-dependent growth resulting from Equation 9, which implies that the same mass of different sized seeds will induce unvarying fibrillization kinetics. Experiments of amyloid fibril formation of β2m using small amounts of seeds apparently confirm that short, ultrasonicated fibrils induced “essentially the same kinetics” as less fragmented ones (58). Nevertheless, as higher α0 fractions are used, fragmented seeds seem to promote the initial fibrillization rates v0 (15, 52); more surprisingly, when ultrasounds or mechanical agitation are used during incubation, the overall conversion into amyloid fibrils (expressed in terms of final fluorescence intensity) is markedly affected by the type of agitation (59, 60). From these results, we suggest the existence of a thermodynamic rather than kinetic effect associated with fibril breakage. The effective concentration of protein in solution is likely to be influenced by the total number of monomers remaining captive on the fibril ends (Fig. 2). The bigger the fibril fragmentation, the larger the number of fibril ends, and the greater the effect on the effective concentration in equilibrium. Although it is important in explaining unexpected behaviors, we will not be concerned with changing thermodynamics due to fibril breakage and/or volume-excluding effects at this stage of the CLM development. Equation 11 is therefore rewritten as a function of the kinetics of nucleation and growth
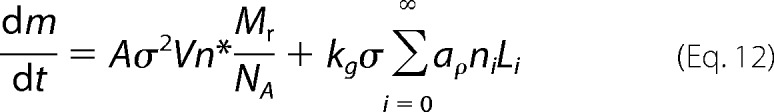 |
with Mr being the molecular weight of the amyloid protein and NA being the Avogadro constant. After recognizing that the sum term corresponds to the total mass m (Equation 10), and expressing Δm and σ as a function of the extent of amyloid fibril formation α (Equations 1 and 6), one gets
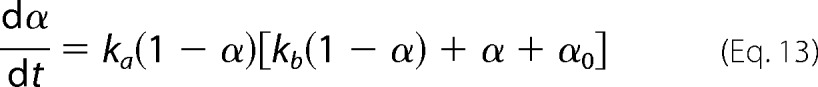 |
where the σ0-dependent constant ka gives the magnitude of the growth step
and kb gives the relative nucleation-to-growth magnitude
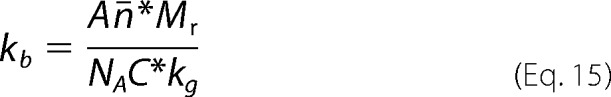 |
An average value n̄* is considered for the number of molecules constituting the amyloid nuclei. Although n* increases as Δμ (and σ) decreases (Equation 7), the average size of the critical nuclei is assumed for now to be dictated by the initial supersaturation σ0. In Equation 13, α0 corresponds to the mass fraction of seeds (m0/ΔmT) and not to the initial amyloid conversion, which is 0 for both seeded and unseeded reactions α(0) = 0. The analytical solution of the ordinary differential Equation 13 subject to this initial condition is
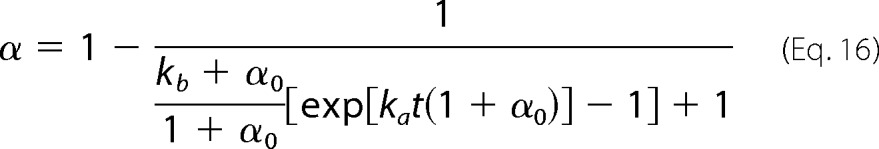 |
which in the case of unseeded reactions simplifies to
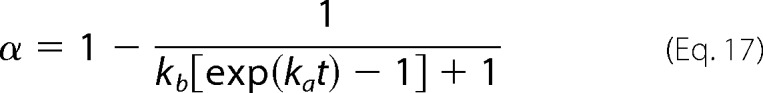 |
This equation is a major result of our study. Some of the practical and fundamental applications arising from it will now be discussed using experimental amyloid fibrillization kinetics obtained from the literature. Equation 17 will be fitted to the measured variations of α with time to determine the kinetic constants ka and kb. In so doing, the growth and nucleation steps will be quantitatively characterized, which is useful to design and predict different amyloidogenic conditions. When the rates of amyloid fibril formation are available for different initial protein concentrations (and for different σ0 values), further fundamental insight about amyloid fibrillogenesis is gained by disclosing the meaning of the kinetic constants at the molecular scale. Our future work will address the cases of seeded fibrillization kinetics (Equation 16) in more detail.
RESULTS AND DISCUSSION
The CLM will be tested against experimental data published by Xue et al. (15) and Hurshman et al. (18) that comprehensively describe unseeded sigmoidal and hyperbolic kinetics. Although different numerical methods can be applied to determine the model parameters ka and kb, we propose a simplified strategy that uses the time required to reach 50% of the maximal amplitude (t50) and the aggregation rate at that instant (v50). The theoretical value of the product kat50 is obtained by setting α = 0.5 in Equation 17.
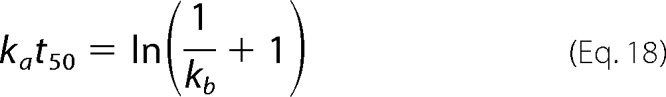 |
In the same way, v50 corresponds to the derivative given by Equation 13 for α = 0.5 and α0 = 0, with the product v50t50 also being a sole function of kb
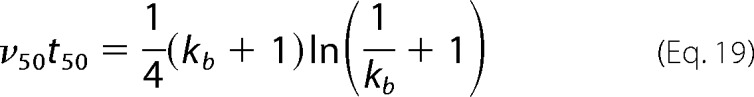 |
As shown in Fig. 3A, v50 is obtained from the slope of the experimental α(t) curve at the instant t50. In a first step, the value of kb is determined from solving Equation 19 using the measured values of t50 and v50. The value of ka is then determined from solving Equation 18 using t50 and the kb constant just estimated. This two-step method for determining the model parameters is graphically illustrated in Fig. 3B. The mechanistic similarities suggested by Fändrich (61) when analyzing 298 amyloid aggregation kinetics of different polypeptides find here their underlying principle. The author noticed that the product of the apparent lag time t1 and the maximum aggregation rate vmax did not change significantly from an average value of 4.5 with S.D. ± 2.9 (31, 61). Although t1 is lower than t50, and vmax is greater or equal to v50, the product t1vmax is expected to be close to v50t50. The representation of Equation 19 in Fig. 3B shows that a relatively narrow range of v50t50 values, say between 2 and 6, corresponds to kb values that vary many orders of magnitude, from ∼10−11 to ∼10−4. That is to say, according to the CLM, very different nucleation-to-growth ratios exhibited by amyloid polypeptides correspond to nearly invariable v50t50 and t1vmax products. The bad news is that even small experimental errors during aggregation kinetics measurement can lead to great uncertainty on the estimated value of kb. The values of kb associated with the t1vmax products identified by Fändrich (61) are much lower than 1, so in Equation 19, kb + 1 ≃ 1. By combining Equation 18 and the simplified version of Equation 19, one finds that ka ≃ 4v50 for the large number of amyloid aggregation kinetics analyzed. The simplified method illustrated in Fig. 3 was applied to more than 200 fibrillization progress curves measured by Xue et al. (15) at concentrations of β2m monomer ranging from 8 to 244 μm. The selection of fitting results given in Fig. 4A illustrates the good agreement obtained throughout the different polymerization stages and for all concentrations. This is especially relevant if one recalls that half-life coordinates (t50 and v50) were the only information used to compute the theoretical curves in their full extent. According to Equation 14, the values of ka should increase linearly with the initial supersaturation level σ0. Mean ka values of replicate experiments are represented in Fig. 4B as a function of the σ0 values calculated using Equation 5 and a C* estimation of 0.67 μm for β2m under acidic conditions (62). The fact that the ka(σ0) relationship is closer to a power law function than to a linear function is not discouraging. On the contrary, it reflects the increasing diffusional limitations as the C0 increases from 8 to 244 μm. More concentrated protein solutions result in a higher quantity of suspended fibrils, which in turn decreases the mass transfer rates and does not let ka increase with σ0 as fast as in diluted solutions. Concerning the determination of the constant kb, a great variability of results was obtained for each β2m concentration that was analyzed. The 95% confidence intervals for the mean kb included the value 0 in all cases except for C0 = 43.7 μm. The difficulty in finding statistically valid kb estimations confirms our concerns about the high sensitivity of this parameter, at least in the region of Fig. 3B corresponding to high values of v50t50. The same uncertainty does not let us conclude about the meaning of some misfit occurring when α starts to increase using less concentrated β2m solutions (Fig. 4A). These discrepancies, which were not reproducibly observed, may represent different nucleation rates from those considered by the CLM or, more simply, may result from experimental base-line variations that are more likely to occur during slower fibrillization kinetics.
FIGURE 3.

Simplified method for determining the kinetic constants ka and kb from unseeded amyloid aggregation kinetics. A, illustrative example for determining the time required to reach 50% completion t50 (dashed lines) and the aggregation rate at that instant (v50) (solid lines) using the time-dependent, normalized fluorescence signal measured by Xue et al. (15) for 61 μm β2m; t50 = 15.6 h and v50 = 0.36 h−1. B, the products v50t50 (left vertical axis) and kat50 (right vertical axis) are computed as a function of kb (log scale) according to Equations 19 and 18, respectively (solid lines). From the kinetic parameters determined in A, kb is firstly interpolated from the product v50t50 and then is used to interpolate the product kat50, from which ka is estimated (dashed arrows); kb = 1.6 × 10⁻¹⁰ and ka = 1.44 h−1.
FIGURE 4.

Fitting the CLM to sigmoidal aggregation kinetics measured by Xue et al. (15) at different β2m concentrations. A, theoretical kinetic curves (lines) are calculated using Equation 17 and the ka and kb constants obtained by the simplified method described in the legend for Fig. 3. The selection of results covers very fast to very slow β2m fibrillization kinetics. B, influence of the initial supersaturation level σ0 on the mean ka values (symbols) determined for different protein concentrations within a 95% confidence interval (error bars). Solid line represents a power law equation with exponent 0.503.
So far we have been analyzing sigmoidal aggregation kinetics showing an initial lag phase that precedes the phase of rapid growth. As the nucleation step becomes not so rate-limiting, i.e. as kb increases and v50t50 decreases, the initial lag phase becomes progressively shorter until no induction time is discernible. At the same time, the shape of the amyloid fibrillization kinetics is expected to gradually change from sigmoidal to hyperbolic. This is understandable from the value of amyloid fibril conversion at the inflection point αi, which is calculated from the condition d2α/dt2 = 0 applied to Equation 13 for unseeded reactions (α0 = 0).
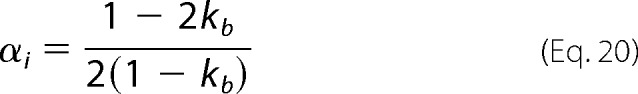 |
For low values of the nucleation-to-growth ratio, the progress of amyloid fibrillization follows a sigmoidal shape with an inflection point at α0 = 0.5. As kb increases, the sigmoid curves have their inflection at lower values of α until a stage where no inflection point is visible at all. This happens for kb > 0.5 and corresponds to the hyperbolic aggregation kinetics.
A good agreement between experimental and theoretical results is again observed in the case of hyperbolic aggregation kinetics of monomeric transthyretin (M-TTR) (Fig. 5A). First estimations of ka and kb using the values of t50 and v50 were now fine-tuned through numerical minimization of the squared error. The parameters thus obtained are in close agreement with those obtained using the Levenberg-Marquardt algorithm of χ2 minimization (see supplemental Table S2). Fig. 5B shows that the obtained values of ka and kb seem to linearly increase with the initial supersaturation level σ0 calculated using Equation 5; a value of 0.8 μg/ml was used for the M-TTR solubility C*, which corresponds to the concentration of monomers in solution after 1 week of reaction time (18). Although the linear ka(σ0) relationship confirms the definition of the growth rate constant given by Equation 14, the kb(σ0) data suggest that in Equation 15, the average number of monomers constituting the critical nucleus n̄* increases with the initial supersaturation. This result is apparently in contradiction with the classical nucleation theory, which expects smaller critical nuclei as the thermodynamic driving force increases (Equation 7). Additional statistically reliable nucleation data are, however, needed before making more definite conclusions about the definition of n* for amyloidogenesis. M-TTR and β2m are amyloidogenic proteins that have rather distinct fibrillization kinetics, namely in reaction speed and shape of the progress curve. The ability of CLM to describe such different aggregation mechanisms is very encouraging. Another feature clearly distinguishing the two behaviors is the role of seeding on the acceleration of amyloid aggregation. Although the addition of preformed aggregates of β2m has the typical effect of precluding the initial lag phase (15), in the case of M-TTR, the aggregation kinetics is not accelerated by seeding (18). The CLM again provides the rationale for these observations based on the relative importance of the nucleation step relatively to growth; the very low values of kb estimated for β2m mean that amyloid nucleation is the rate-limiting step. Therefore, the initial fibrillization rate v0 predicted by Equation 13 for α = 0 is also very low in the absence of seeding. Even small amounts of seeds may represent mass fractions α0 much higher than kb, which will lead to a correspondingly high increase on the value of v0 and to a change of fibrillization kinetics from sigmoidal to hyperbolic. On the contrary, the high values of kb obtained for M-TTR represent fast fibrillization rates right from the beginning of the reaction. This occurs independently of the values of α0 that are typically well below 1. Drastic differences in the value of kb may also configure different mechanisms of M-TTR and β2m amyloid fibril formation; amorphous M-TTR aggregates identified by microscopic analysis (18) are likely to act as nucleation promoters (63). Instead, β2m fibrils had the long, straight morphology typical of low pH, low ionic strength conditions (15, 64), suggesting that elongation is the major route for fibril formation.
FIGURE 5.

Fitting the CLM to hyperbolic aggregation kinetics measured by Hurshman et al. (18) at different M-TTR concentrations. A, symbols represent continuous fluorescence data that were digitized by us into periodic data and normalized by the end-point signal. Theoretical kinetic curves (lines) are calculated using Equation 17 and the ka and kb constants obtained by minimization of the squared error. B, influence of the initial supersaturation level σ0 on the estimated ka (open symbols) and kb constants (closed symbols).
At this point, the CLM is confirmed as a robust two-parameter model that is able to describe very distinct protein aggregation kinetics and whose derivation is theoretically consistent and not liable to oversimplified hypothesis. As shown in supplemental Table S2 and supplemental Fig. S1, the CLM also obtained the best fitting results among the two-parameter models used to describe protein aggregation data that are not rate-limited by any of the steps. In a subsequent stage, additional mechanistic insight into the nucleation and growth steps should be gained by disclosing the meaning of the kinetic constants ka and kb. Our preliminary study on how these constants are affected by the initial supersaturation level seems to indicate that modifications to the classic nucleation theory are needed to determine the critical size of the amyloid nucleus. Concerning the growth step, the condition of size-dependent growth inherent to Equation 9 also deserves further discussion. This condition is not easily tested by direct observation techniques, which are known to have experimental limitations such as constrained assembly on the mica/glass surface and growth rate dispersion (41–46). An indirect, yet distinctive consequence of size-dependent growth is that fibrillization rates are affected by the total mass of fibrils present in solution but not by their number. Increased seeding efficiency obtained with fragmented (smaller) seed fibrils has, however, been observed for β2m (15, 52) and for yeast prions (65), which is in apparent contradiction with the size-dependent condition. Fibril breakage induced by different agitation intensities has also been reported to affect the end-point fluorescence signal (59, 60), which is an indication of the total amount of fibrils produced and, indirectly, of the protein solubility (Equation 6). Both types of evidences are not expected by the CLM and are presumably related with variations on the effective protein concentration due to volume-excluding effects in fibril-crowded solutions. Known as an important variable in the cellular environment, macromolecular crowding and its effects are generally associated with high concentrations of spectator molecules (66). We hypothesize that the thermodynamic concentration of protein may also be affected in vitro by fibril breakage as an additional source of monomer-retaining sites. Besides providing a possible explanation for masked fibrillization kinetics, changing thermodynamic conditions may also be linked to a series of unusual behaviors reported in literature such as the effects of reaction volume (67), hydrophobic surface area (68), and surfactants (60) on amyloid fibril formation. In all cases, not only the reaction rate is affected but also the reaction extent, which again supports the thermodynamic hypothesis of volume-excluding effects taking place at the fibril-solution interface. Whether the effect of fibril breakage is thermodynamic or kinetic is important to evaluate the condition of size-dependent growth and to establish the fundamental meaning of the constant ka: (i) is it related to probabilistic interfacial collisions and the mean life time of monomers at the surface of amyloid fibrils, or (ii) should it be treated as a blind kinetic constant such as those commonly found in protein aggregation models that consider reaction-like rate equations? Either way, sufficient experimental data are available confirming a first-order dependence of the elongation rate on the fundamental variables supersaturation level and fibril mass/size, which in turn leads to a first-order dependence of ka on the initial supersaturation level σ0.
The CLM opens new perspectives on the characterization and understanding of amyloid fibril kinetics. Development of new targets for amyloid disease therapeutics needs this model working together with other structural and molecular studies (55, 69) and complemented with information on the composition of toxic nonfibrillar oligomers (36, 43). CLM allows users to discern between the following mechanisms of inhibition: (i) protein solubility increase evidenced by higher values of C* in the presence of the inhibitor, thus lowering the thermodynamic driving force for fibrillization (Equation 5); (ii) nucleation rates decrease evidenced by lower nucleation-to-growth ratios (kb) in the presence of the inhibitor; and (iii) blocking of fibril elongation evidenced by lower kinetic constant for growth (ka) in the presence of inhibitor. Mechanisms that require structural interaction between ligand and polypeptide, such as nucleation and/or growth inhibition, offer more guarantees to work both in vitro and in vivo. By characterizing the relative contribution of variables, the CLM is expected to be useful for scientific systematization during the development of new therapeutic strategies for amyloid diseases.
In conclusion, we propose a quantitative crystallization-like model that is able to describe the sigmoid and hyperbolic amyloid fibrillization kinetics commonly reported in literature. A simplified method is presented to determine the model parameters using Fig. 3B and the measured values of the time required to reach 50% completion (t50) and the aggregation rate at the that instant (v50). Further insights are provided into the nature of critically sized amyloid nucleus, the influence of diffusive limitations and fibril breakage during growth, and the role of seeding as amyloid aggregation catalyst. It is notable that the solid biophysical basis of the CLM does not compromise its final simplicity. While integrating the combined influence of seeding, nucleation, growth, and fibril breakage, Equation 17 is seen as a good approximation of the generalized underlying principle governing the kinetics of amyloid fibrillization. We expect that the CLM may be routinely used as a tool to characterize quantitatively and qualitatively new targets for amyloid disease therapeutics.
Acknowledgments
We thank Wei-Feng Xue, Sheena E. Radford, and their research team for allowing us to reproduce published experimental data in Figs. 1, 3A, and 4A. We thank Jeffery W. Kelly and the Kelly research team for allowing us to reproduce published experimental data in Figs. 1 and 5A.
This work was supported by Project PTDC/BIA-PRO/101260/2008 from the Fundação para a Ciência e a Tecnologia, Portugal.
This article was selected as a Paper of the Week.

This article contains supplemental Tables S1 and S2 and Fig. S1.
- β2m
- β2-microglobulin
- CLM
- crystallization-like model
- M-TTR
- monomeric transthyretin.
REFERENCES
- 1. Sunde M., Serpell L. C., Bartlam M., Fraser P. E., Pepys M. B., Blake C. C. (1997) Common core structure of amyloid fibrils by synchrotron x-ray diffraction. J. Mol. Biol. 273, 729–739 [DOI] [PubMed] [Google Scholar]
- 2. Kelly J. W. (1997) Amyloid fibril formation and protein misassembly: a structural quest for insights into amyloid and prion diseases. Structure 5, 595–600 [DOI] [PubMed] [Google Scholar]
- 3. Greenwald J., Riek R. (2010) Biology of amyloid: structure, function, and regulation. Structure 18, 1244–1260 [DOI] [PubMed] [Google Scholar]
- 4. Morris A. M., Watzky M. A., Finke R. G. (2009) Protein aggregation kinetics, mechanism, and curve-fitting: a review of the literature. Biochim. Biophys. Acta 1794, 375–397 [DOI] [PubMed] [Google Scholar]
- 5. Roychaudhuri R., Yang M., Hoshi M. M., Teplow D. B. (2009) Amyloid β-protein assembly and Alzheimer disease. J. Biol. Chem. 284, 4749–4753 [DOI] [PMC free article] [PubMed] [Google Scholar]
- 6. Bhak G., Choe Y. J., Paik S. R. (2009) Mechanism of amyloidogenesis: nucleation-dependent fibrillation versus double-concerted fibrillation. BMB Rep. 42, 541–551 [DOI] [PubMed] [Google Scholar]
- 7. Knowles T. P., Waudby C. A., Devlin G. L., Cohen S. I., Aguzzi A., Vendruscolo M., Terentjev E. M., Welland M. E., Dobson C. M. (2009) An analytical solution to the kinetics of breakable filament assembly. Science 326, 1533–1537 [DOI] [PubMed] [Google Scholar]
- 8. Nilsson M. R. (2004) Techniques to study amyloid fibril formation in vitro. Methods 34, 151–160 [DOI] [PubMed] [Google Scholar]
- 9. Bondos S. E. (2006) Methods for measuring protein aggregation. Curr. Anal. Chem. 2, 157–170 [Google Scholar]
- 10. Harper J. D., Lansbury P. T. (1997) Models of amyloid seeding in Alzheimer disease and scrapie: mechanistic truths and physiological consequences of the time-dependent solubility of amyloid proteins. Annu. Rev. Biochem. 66, 385–407 [DOI] [PubMed] [Google Scholar]
- 11. Frieden C. (2007) Protein aggregation processes: in search of the mechanism. Protein Sci. 16, 2334–2344 [DOI] [PMC free article] [PubMed] [Google Scholar]
- 12. Naiki H., Higuchi K., Hosokawa M., Takeda T. (1989) Fluorometric determination of amyloid fibrils in vitro using the fluorescent dye, thioflavin T1. Anal. Biochem. 177, 244–249 [DOI] [PubMed] [Google Scholar]
- 13. Jarrett J. T., Lansbury P. T., Jr. (1992) Amyloid fibril formation requires a chemically discriminating nucleation event: studies of an amyloidogenic sequence from the bacterial protein OsmB. Biochemistry 31, 12345–12352 [DOI] [PubMed] [Google Scholar]
- 14. Knowles T. P., Shu W., Devlin G. L., Meehan S., Auer S., Dobson C. M., Welland M. E. (2007) Kinetics and thermodynamics of amyloid formation from direct measurements of fluctuations in fibril mass. Proc. Natl. Acad. Sci. U.S.A. 104, 10016–10021 [DOI] [PMC free article] [PubMed] [Google Scholar]
- 15. Xue W. F., Homans S. W., Radford S. E. (2008) Systematic analysis of nucleation-dependent polymerization reveals new insights into the mechanism of amyloid self-assembly. Proc. Natl. Acad. Sci. U.S.A. 105, 8926–8931 [DOI] [PMC free article] [PubMed] [Google Scholar]
- 16. Naiki H., Hasegawa K., Yamaguchi I., Nakamura H., Gejyo F., Nakakuki K. (1998) Apolipoprotein E and antioxidants have different mechanisms of inhibiting Alzheimer β-amyloid fibril formation in vitro. Biochemistry 37, 17882–17889 [DOI] [PubMed] [Google Scholar]
- 17. Jarrett J. T., Lansbury P. T., Jr. (1993) Seeding “one-dimensional crystallization” of amyloid: a pathogenic mechanism in Alzheimer disease and scrapie? Cell 73, 1055–1058 [DOI] [PubMed] [Google Scholar]
- 18. Hurshman A. R., White J. T., Powers E. T., Kelly J. W. (2004) Transthyretin aggregation under partially denaturing conditions is a downhill polymerization. Biochemistry 43, 7365–7381 [DOI] [PubMed] [Google Scholar]
- 19. Naiki H., Gejyo F., Nakakuki K. (1997) Concentration-dependent inhibitory effects of apolipoprotein E on Alzheimer β-amyloid fibril formation in vitro. Biochemistry 36, 6243–6250 [DOI] [PubMed] [Google Scholar]
- 20. Morris A. M., Watzky M. A., Agar J. N., Finke R. G. (2008) Fitting neurological protein aggregation kinetic data via a two-step, minimal/“Ockham's razor” model: the Finke-Watzky mechanism of nucleation followed by autocatalytic surface growth. Biochemistry 47, 2413–2427 [DOI] [PubMed] [Google Scholar]
- 21. Schmidt H., Madsen M. F., Danø S., Cedersund G. (2008) Complexity reduction of biochemical rate expressions. Bioinformatics 24, 848–854 [DOI] [PubMed] [Google Scholar]
- 22. Bernacki J. P., Murphy R. M. (2009) Model discrimination and mechanistic interpretation of kinetic data in protein aggregation studies. Biophys. J. 96, 2871–2887 [DOI] [PMC free article] [PubMed] [Google Scholar]
- 23. Watzky M. A., Finke R. G. (1997) Transition metal nanocluster formation kinetic and mechanistic studies: a new mechanism when hydrogen is the reductant: slow, continuous nucleation and fast autocatalytic surface growth. J. Am. Chem. Soc. 119, 10382–10400 [Google Scholar]
- 24. Kamihira M., Naito A., Tuzi S., Nosaka A. Y., Saitô H. (2000) Conformational transitions and fibrillation mechanism of human calcitonin as studied by high-resolution solid-state 13C NMR. Protein Sci. 9, 867–877 [DOI] [PMC free article] [PubMed] [Google Scholar]
- 25. Fernández C. O., Hoyer W., Zweckstetter M., Jares-Erijman E. A., Subramaniam V., Griesinger C., Jovin T. M. (2004) NMR of α-synuclein-polyamine complexes elucidates the mechanism and kinetics of induced aggregation. EMBO J. 23, 2039–2046 [DOI] [PMC free article] [PubMed] [Google Scholar]
- 26. Ferrone F. (1999) Analysis of protein aggregation kinetics. Methods Enzymol. 309, 256–274 [DOI] [PubMed] [Google Scholar]
- 27. Watzky M. A., Morris A. M., Ross E. D., Finke R. G. (2008) Fitting yeast and mammalian prion aggregation kinetic data with the Finke-Watzky two-step model of nucleation and autocatalytic growth. Biochemistry 47, 10790–10800 [DOI] [PubMed] [Google Scholar]
- 28. Sluzky V., Tamada J. A., Klibanov A. M., Langer R. (1991) Kinetics of insulin aggregation in aqueous solutions upon agitation in the presence of hydrophobic surfaces. Proc. Natl. Acad. Sci. U.S.A. 88, 9377–9381 [DOI] [PMC free article] [PubMed] [Google Scholar]
- 29. O'Nuallain B., Shivaprasad S., Kheterpal I., Wetzel R. (2005) Thermodynamics of Aβ(1–40) amyloid fibril elongation. Biochemistry 44, 12709–12718 [DOI] [PubMed] [Google Scholar]
- 30. Hasegawa K., Ono K., Yamada M., Naiki H. (2002) Kinetic modeling and determination of reaction constants of Alzheimer β-amyloid fibril extension and dissociation using surface plasmon resonance. Biochemistry 41, 13489–13498 [DOI] [PubMed] [Google Scholar]
- 31. Auer S., Kashchiev D. (2010) Insight into the correlation between lag time and aggregation rate in the kinetics of protein aggregation. Proteins 78, 2412–2416 [DOI] [PubMed] [Google Scholar]
- 32. Markov I. V. (2003) Crystal Growth for Begginers, 2nd Ed., World Scientific Publishing, Singapore [Google Scholar]
- 33. Minton A. P. (2000) Implications of macromolecular crowding for protein assembly. Curr. Opin. Struct. Biol. 10, 34–39 [DOI] [PubMed] [Google Scholar]
- 34. Chiti F., Dobson C. M. (2009) Amyloid formation by globular proteins under native conditions. Nat. Chem. Biol. 5, 15–22 [DOI] [PubMed] [Google Scholar]
- 35. Stöhr J., Weinmann N., Wille H., Kaimann T., Nagel-Steger L., Birkmann E., Panza G., Prusiner S. B., Eigen M., Riesner D. (2008) Mechanisms of prion protein assembly into amyloid. Proc. Natl. Acad. Sci. U.S.A. 105, 2409–2414 [DOI] [PMC free article] [PubMed] [Google Scholar]
- 36. Bhak G., Lee J. H., Hahn J. S., Paik S. R. (2009) Granular assembly of α-synuclein leading to the accelerated amyloid fibril formation with shear stress. PLoS ONE 4, e4177. [DOI] [PMC free article] [PubMed] [Google Scholar]
- 37. Kashchiev D. (2000) Nucleation: Basic Theory with Applications, Butterworth-Heinemann, Oxford [Google Scholar]
- 38. Kashchiev D., Auer S. (2010) Nucleation of amyloid fibrils. J. Chem. Phys. 132, 215101. [DOI] [PubMed] [Google Scholar]
- 39. Zhang T. H., Liu X. Y. (2009) Nucleation: what happens at the initial stage? Angew. Chem. Int. Ed. Engl. 48, 1308–1312 [DOI] [PubMed] [Google Scholar]
- 40. Padrick S. B., Miranker A. D. (2002) Islet amyloid: phase partitioning and secondary nucleation are central to the mechanism of fibrillogenesis. Biochemistry 41, 4694–4703 [DOI] [PubMed] [Google Scholar]
- 41. Heldt C. L., Zhang S., Belfort G. (2011) Asymmetric amyloid fibril elongation: a new perspective on a symmetric world. Proteins 79, 92–98 [DOI] [PubMed] [Google Scholar]
- 42. Ban T., Goto Y. (2006) Direct observation of amyloid growth monitored by total internal reflection fluorescence microscopy. Methods Enzymol. 413, 91–102 [DOI] [PubMed] [Google Scholar]
- 43. Collins S. R., Douglass A., Vale R. D., Weissman J. S. (2004) Mechanism of prion propagation: amyloid growth occurs by monomer addition. PLoS Biol. 2, e321. [DOI] [PMC free article] [PubMed] [Google Scholar]
- 44. Patil S. M., Mehta A., Jha S., Alexandrescu A. T. (2011) Heterogeneous amylin fibril growth mechanisms imaged by total internal reflection fluorescence microscopy. Biochemistry 50, 2808–2819 [DOI] [PubMed] [Google Scholar]
- 45. Scheibel T., Kowal A. S., Bloom J. D., Lindquist S. L. (2001) Bidirectional amyloid fiber growth for a yeast prion determinant. Curr. Biol. 11, 366–369 [DOI] [PubMed] [Google Scholar]
- 46. Goldsbury C., Kistler J., Aebi U., Arvinte T., Cooper G. J. (1999) Watching amyloid fibrils grow by time-lapse atomic force microscopy. J. Mol. Biol. 285, 33–39 [DOI] [PubMed] [Google Scholar]
- 47. Ionescu-Zanetti C., Khurana R., Gillespie J. R., Petrick J. S., Trabachino L. C., Minert L. J., Carter S. A., Fink A. L. (1999) Monitoring the assembly of Ig light-chain amyloid fibrils by atomic force microscopy. Proc. Natl. Acad. Sci. U.S.A. 96, 13175–13179 [DOI] [PMC free article] [PubMed] [Google Scholar]
- 48. Ruschak A. M., Miranker A. D. (2007) Fiber-dependent amyloid formation as catalysis of an existing reaction pathway. Proc. Natl. Acad. Sci. U.S.A. 104, 12341–12346 [DOI] [PMC free article] [PubMed] [Google Scholar]
- 49. Martins P. M., Rocha F. (2007) Characterization of crystal growth using a spiral nucleation model. Surf. Sci. 601, 3400–3408 [Google Scholar]
- 50. Martins P. M., Rocha F. (2007) New developments on size-dependent growth applied to the crystallization of sucrose. Surf. Sci. 601, 5466–5472 [Google Scholar]
- 51. Martins P. M., Rocha F. A. (2008) Kinetic studies on the influence of temperature and growth rate history on crystal growth. Cryst. Res. Technol. 43, 1258–1267 [Google Scholar]
- 52. Chatani E., Ohnishi R., Konuma T., Sakurai K., Naiki H., Goto Y. (2010) Pre-steady-state kinetic analysis of the elongation of amyloid fibrils of β2-microglobulin with tryptophan mutagenesis. J. Mol. Biol. 400, 1057–1066 [DOI] [PubMed] [Google Scholar]
- 53. Konuma T., Chatani E., Yagi M., Sakurai K., Ikegami T., Naiki H., Goto Y. (2011) Kinetic intermediates of β2-microglobulin fibril elongation probed by pulse-labeling H/D exchange combined with NMR analysis. J. Mol. Biol. 405, 851–862 [DOI] [PubMed] [Google Scholar]
- 54. Jiménez J. L., Nettleton E. J., Bouchard M., Robinson C. V., Dobson C. M., Saibil H. R. (2002) The protofilament structure of insulin amyloid fibrils. Proc. Natl. Acad. Sci. U.S.A. 99, 9196–9201 [DOI] [PMC free article] [PubMed] [Google Scholar]
- 55. Santoso A., Chien P., Osherovich L. Z., Weissman J. S. (2000) Molecular basis of a yeast prion species barrier. Cell 100, 277–288 [DOI] [PubMed] [Google Scholar]
- 56. Smith J. F., Knowles T. P., Dobson C. M., Macphee C. E., Welland M. E. (2006) Characterization of the nanoscale properties of individual amyloid fibrils. Proc. Natl. Acad. Sci. U.S.A. 103, 15806–15811 [DOI] [PMC free article] [PubMed] [Google Scholar]
- 57. Xue W. F., Hellewell A. L., Gosal W. S., Homans S. W., Hewitt E. W., Radford S. E. (2009) Fibril fragmentation enhances amyloid cytotoxicity. J. Biol. Chem. 284, 34272–34282 [DOI] [PMC free article] [PubMed] [Google Scholar]
- 58. Ohhashi Y., Kihara M., Naiki H., Goto Y. (2005) Ultrasonication-induced amyloid fibril formation of β2-microglobulin. J. Biol. Chem. 280, 32843–32848 [DOI] [PubMed] [Google Scholar]
- 59. Kim H. J., Chatani E., Goto Y., Paik S. R. (2007) Seed-dependent accelerated fibrillation of α-synuclein induced by periodic ultrasonication treatment. J. Microbiol. Biotechnol. 17, 2027–2032 [PubMed] [Google Scholar]
- 60. Giehm L., Otzen D. E. (2010) Strategies to increase the reproducibility of protein fibrillization in plate reader assays. Anal. Biochem. 400, 270–281 [DOI] [PubMed] [Google Scholar]
- 61. Fändrich M. (2007) Absolute correlation between lag time and growth rate in the spontaneous formation of several amyloid-like aggregates and fibrils. J. Mol. Biol. 365, 1266–1270 [DOI] [PubMed] [Google Scholar]
- 62. Sasahara K., Yagi H., Sakai M., Naiki H., Goto Y. (2008) Amyloid nucleation triggered by agitation of β2-microglobulin under acidic and neutral pH conditions. Biochemistry 47, 2650–2660 [DOI] [PubMed] [Google Scholar]
- 63. Rochet J. C., Lansbury P. T., Jr. (2000) Amyloid fibrillogenesis: themes and variations. Curr. Opin. Struct. Biol. 10, 60–68 [DOI] [PubMed] [Google Scholar]
- 64. Radford S. E., Gosal W. S., Platt G. W. (2005) Towards an understanding of the structural molecular mechanism of β2-microglobulin amyloid formation in vitro. Biochim. Biophys. Acta 1753, 51–63 [DOI] [PMC free article] [PubMed] [Google Scholar]
- 65. Tanaka M., Collins S. R., Toyama B. H., Weissman J. S. (2006) The physical basis of how prion conformations determine strain phenotypes. Nature 442, 585–589 [DOI] [PubMed] [Google Scholar]
- 66. White D. A., Buell A. K., Knowles T. P., Welland M. E., Dobson C. M. (2010) Protein aggregation in crowded environments. J. Am. Chem. Soc. 132, 5170–5175 [DOI] [PubMed] [Google Scholar]
- 67. Baskakov I. V., Bocharova O. V. (2005) In vitro conversion of mammalian prion protein into amyloid fibrils displays unusual features. Biochemistry 44, 2339–2348 [DOI] [PubMed] [Google Scholar]
- 68. Pronchik J., He X., Giurleo J. T., Talaga D. S. (2010) In vitro formation of amyloid from α-synuclein is dominated by reactions at hydrophobic interfaces. J. Am. Chem. Soc. 132, 9797–9803 [DOI] [PubMed] [Google Scholar]
- 69. Toyama B. H., Kelly M. J., Gross J. D., Weissman J. S. (2007) The structural basis of yeast prion strain variants. Nature 449, 233–237 [DOI] [PubMed] [Google Scholar]