Abstract
The transfer of genetic material into cells using non-viral vectors offers unique potential for therapeutics; however, the efficacy of delivery depends upon a poorly understood, multistep pathway, limiting the prospects for successful gene delivery. Mechanistic insight into DNA association and release has been hampered by a lack of atomic resolution structural and dynamic information for DNA-polymer complexes (polyplexes). Here, we report a dendrimer-based polyplex system containing poly(ethyleneglycol) (PEG) arms that is suitable for atomic-level characterization by solution NMR spectroscopy. NMR chemical shift, linewidth, and proton transverse relaxation rate measurements reveal that free and dendrimer-bound polyplex DNA exchange rapidly relative to the NMR timescale (< millisecond). The dendrimers retain a high degree of mobility in the polyplex, whereas the DNA shows restrained mobility, suggesting that the polyplex is a highly dynamic complex with a rapidly exchanging dendrimer atmosphere around a more rigid DNA framework.
Keywords: Polyplexes, polyplex NMR spectroscopy, DNA dynamics, PAMAM dendrimer dynamics, polyplex DNA release
INTRODUCTION
The transfer of genetic material into cells using non-viral vectors offers unique potential for therapeutics;1-4 however, the efficacy of delivery depends upon a poorly understood, multistep pathway, limiting the prospects for successful gene delivery.5 Mechanistic insight into DNA association and release has been hampered by a lack of atomic resolution structural and dynamic information for DNA-polymer complexes (polyplexes). Poly(amidoamine) (PAMAM) dendrimers represent a well-studied class of transfection agents6-8 and are well-suited for mechanistic studies due to their homogeneity in terms of size and number of cationic amines per polymer particle.9 Structure and dynamics of PAMAM dendrimer-DNA complexes have been investigated at large length scales. Braun et al. studied entropy-driven electrostatic association between plasmid DNA (pDNA) and many generations of PAMAM dendrimer that provided evidence of direct interaction at both the guanine base and phosphate backbone of the nucleic acid.7 The Tomalia group studied the binding of high molecular weight linear DNA and PAMAM dendrimer generations 2, 4 and 7 (G2, G4, and G7, respectively) and proposed a dendrimer-DNA binding model based on regions of both tightly bound and “linker” DNA.10 Despite these reports, essential features of the PAMAM dendrimer-DNA polyplex structure, particularly the dynamics of the DNA and dendrimer components, remain poorly understood. Examples of recent progress include the application of fluorescence methods to highlight the importance of release in the nucleus for expression.11 Using ethidium bromide intercalation into DNA to probe DNA-dendrimer interactions, Fant et al. showed that polymer and linearized pDNA are exchanging and that the PEGylated PAMAMs bind pDNA less tightly than the parent polymer.12 Atomic Force Microscopy (AFM) methods have been employed to examine polymer-DNA dynamics and DNA release from polyplexes on the time scale of tens of minutes.13,14 Still lacking, however, is information on the atomic scale, due to experimental difficulties.
NMR spectroscopy has the potential to be a powerful tool for polyplex characterization due to its atomic-level resolution and ability to elucidate both structure and dynamics; however, NMR has not been extensively used for polyplex characterization because at the concentrations required for spectroscopy, aggregation and precipitation generally result. Indeed, we observed immediate precipitation in our own experiments upon titrating a 20-mer DNA duplex (5′ CCACAGTGTTTGTGCAGCGG 3′) with G5 PAMAM dendrimer. In order to overcome this limitation, we employed G5 PAMAM dendrimers modified with poly(ethyleneglycol) (PEG) arms for this study. High molecular weight, well-hydrated PEG chains restrict aggregation through steric hindrance and by creating a solvation layer around the particle. Such PEGylated materials have clinical relevance and both PAMAM dendrimers15,16 and other cationic polymer nucleic acid delivery agents17-19 have been employed to eliminate or reduce flocculation of polyplexes into large aggregates in the presence of physiological salt and serum conditions. This flocculation is a significant hurdle in rendering these delivery methods clinically viable, since large, micrometer-sized particles are quickly eliminated from in vivo circulation by the reticuloendothelial system (RES) before reaching their target cells.20-22 PEGylation has also been shown to limit cytotoxicity by reducing the production of reactive oxidative species and mitochondrial membrane potential collapse induced by the PAMAM dendrimers.23
With these PEG-modified dendrimers, we investigated polyplex dynamics by NMR and applied relaxation data to a new interpretation of the spectra obtained at various formulation ratios. These results reveal that fast chemical exchange (< millisecond) exists between free and dendrimer-bound DNA. We conclude that in the polyplex, dendrimer is flexible and mobile while the DNA experiences an increasingly restricted solid-state environment at higher charge ratios. This new information provides mechanistic insight into the association and release of nucleic acids from their delivery vectors.
MATERIALS AND METHODS
Materials
Sodium chloride (NaCl), sodium dihydrogen phosphate (NaH2PO4), ethylenediamine tetraacetic acid (EDTA), 0.1 N hydrochloric acid (HCl), tris(hydroxymethyl)aminomethane, methoxypoly(ethylene glycol) tresylate (all from Sigma; St. Louis, MO) and 99.96 % deuterium oxide (D2O; Cambridge Isotope Laboratories, Inc.; Andover, MA) were used as received. Both strands of a DNA 20-mer (5’- CCACAGTGTTTGTGCAGCGG -3’ and 5’-CCGCTGCACAAACACTGTGG -3’) were ordered from Integrated DNA Technologies, Inc. (IDT; Coralville, IA) and dissolved independently into DNase-/RNase-free water (Gibco; Carlsbad, CA) to final concentrations of 2 mM based on the molar quantity specifications provided by IDT. Then, accurate DNA concentrations were quantified by absorbance at 260 nm, using a molar extinction coefficient of 315,956 cm-1 M-1 for these sequences determined using OligoAnalyzer software from IDT and the two strands mixed at stoichiometric ratio. Phosphate buffer was made by dissolving NaH2PO4, NaCl and EDTA in DNase-/RNase-free water to a final concentration of 10 mM, 25 mM and 0.20 mM, respectively. Then, the pH was adjusted to 7.4 with 0.1 N H3PO4.
PAMAM Dendrimer Synthesis and Characterization
Generation 5 (G5-NH2) PAMAM dendrimer was purchased from Dendritech Inc. (Midland, MI). Lower molecular weight impurities and trailing generations were removed from G5-NH2 by dialysis with a 10,000 MWCO membrane against deionized water for four days, exchanging washes 7 times. The number average molecular weight and polydispersity index or PDI of the dendrimers were determined by gel permeation chromatography (GPC) using a double detection system (refractive index and static light scattering) to be 27,336 g/mol and 1.018. Potentiometric titration was conducted to determine the average number of primary amines per dendrimer (112). Using this number, methoxypoly(ethylene glycol) tresylate or TMPEG was conjugated to the G5-NH2 dendrimer in a 1:10 PEG:primary amine molar ratio by mixing both in 10 mM phosphate buffer, pH 7.4 and stirring at 25 °C for four days. This product was then dialyzed against deionized water using a 10,000 MWCO membrane for three days, exchanging washes 8 times. The purified and lyophilized product was analyzed by GPC to have a number average molecular weight of 84,730 g/mol. The difference between this molecular weight and that of the non-PEGylated G5-NH2 (27,336 g/mol) was divided by the average molecular weight of the TMPEG (5,330 g/mol; also determined by GPC) to determine the average number of PEG chains conjugated to each dendrimer of 11. All of the remaining dendrimer primary amines are expected to be protonated at pH 7.4;24 therefore, the charge of the PEGylated G5-NH2 (G5-NH2-PEG) is equal to 101 positive charges/mol (112-11).
Gel Electrophoresis
Polyplexes were formed by adding increasing volumes of 3.4 μg/μL G5-NH2 or 11.5 μg/μL G5-NH2-PEG to 85 μL of 40 μg/mL 20-mer DNA solution, all in 10 mM phosphate buffer at pH 7.4, to result in +/- ratios of 0-20. The final volume was corrected with buffer to result in a final DNA concentration of 34 μg/mL. The two solutions were mixed well for each ratio and incubated at room temperature for 20 min. To each well of a 3% agarose gel made with 1X tris acetate EDTA (TAE) buffer, 18.5 μL of polyplex sample mixed with loading dye was added. The gel was run at 60 mV for approximately 45 min in 1X TAE buffer supplemented with 2 μL of 10 mg/mL ethidium bromide solution.
Dynamic Light Scattering
Polyplexes were formed by adding 300 mg/mL G5-NH2-PEG to 270 μL of a 350 μM solution of DNA 20-mer both in 10 mM phosphate buffer pH 7.4 to result in +/- charge ratios of 0, 0.25, 0.50, 0.75 and 1.0 at a final DNA concentration of 300 μM. The solutions were mixed well and then incubated at room temperature for 20 min. Hydrodynamic diameter of the complexes was then measured at 37 °C on a Malvern Zetasizer Nano ZS (Worchestershire, UK) with a 4 mW He-Ne laser operating at 633 nm with a 173° scattering angle. Correlation functions were analyzed by global fit to the data of three measurements of three runs each, with sizes reported as the z-average, since the populations were monomodal for all polyplexes with +/- ratio > 0.25.
1H NMR Titrations of DNA with Dendrimer
Separate samples of 270 μL of 350 μM 20-mer DNA were aliquoted in 10 mM phosphate buffer supplemented with 10 % D2O. Increasing concentrations of 300 mg/mL G5-NH2-PEG were added to obtain polyplexes of +/- ratios of 0-5 and the final volume of buffer was adjusted to obtain a 300 μM solution of DNA. Jump-return 1D 1H spectra were obtained on a 600 MHz Bruker Avance NMR spectrometer equipped with a triple-resonance cryogenic probe at 37 °C with 64 scans. Spectra were processed and analyzed with NMRPipe software.25
1H NMR Titrations of Dendrimer with DNA
Separate samples of 18 μL of 300 mg/mL G5-NH2-PEG were aliquoted in 10 mM phosphate buffer supplemented with 10 % D2O. Increasing concentrations of 20-mer DNA solution were added to obtain polyplexes of decreasing +/- ratio from 5.0 to 0.25 and the final volume was adjusted to 50 μL. Spectra were obtained on a 600 MHz Varian spectrometer equipped with a Nanoprobe at 37 °C with 2.5 kHz magic angle spinning and 1024 scans including a water saturation pulse. Spectra were processed and analyzed with NMRPipe software.25
R2Relaxation Measurements and Global Fitting of R2,polyplex and pfree
Relaxation measurements of polyplexes at +/- ratios of 0, 0.25, 0.50 and 1.0 were conducted at 37 °C using a 1D Carr-Purcell-Meiboom-Gill (CPMG) pulse sequence. To prepare the samples in D2O buffer, polyplexes formed as above for the 1H titration experiments were lyophilized for 48 h and then the dry solid was resuspended in the same volume of D2O. Spectra were obtained on a 600 MHz Bruker NMR at 37 °C with 32 (+/- ratio 0 to 0.5) or 64 (+/- ratio 1.0) scans, a constant νcp = 1250 Hz (τcp = 0.8 ms) or νcp = 250 Hz (τcp = 4.0 ms, data not shown) and variable relaxation delay times t of 0.8 – 160 ms. Spectra were processed and analyzed with NMRPipe software25 and Origin 7 (OriginLab Corp.). Relaxation rates (R2,cpmg = R2,obs) were determined from best fits to mono- and bi-exponential decays of the normalized intensity of the “aromatic” (6.8 – 8.8 ppm) or “ribose” (5.2 – 6.5 ppm) region at increasing delay times. R2,obs obtained from mono-exponential fits of aromatic and ribose regions at different N/P ratios were fit globally to Eq 1. by a non-linear regression algorithm using Mathematica 8.0 (Wolfram Research, Inc.). R2,polyplex for the aromatic and ribose regions and pfree (pbound = 1- pfree) at different N/P ratios were extracted from 1000 different fits using random initial values for each parameter with suitable constraints (0 ≤ pfree ≤ 1; 0 ≤ R2,polyplex ≤ 500 ), and the mean values and standard deviations are reported in Table 2.
Table 2.
Best-fit parameters for the fraction of free DNA (pfree) and polyplex R2 (R2,polyplex) at increasing +/- ratios obtained from global fitting of Eq. 1 for both the aromatic H2/H6/H8 and ribose H1’/aromatic H5 regions of the DNA relaxation spectra.
| +/- Ratio | pfree | R2,polyplex (Hz) (H2/H6/H8) | R2,polyplex (Hz) (H1’/H5) |
|---|---|---|---|
| 0 | 1 | 256 ± 121 | 267 ± 116 |
| 0.25 | 0.95 ± 0.02 | ||
| 0.50 | 0.90 ± 0.03 | ||
| 1.0 | 0.40 ± 0.22 | ||
| 5.0 | 0.76 ± 0.08 |
Calculation of Observed Polyplex Hydrodynamic Diameter
The rotational correlation time (τm) for the DNA-dendrimer polyplex was computed from the fitted R2,polyplex value assuming that dipole-dipole interactions dominate the proton relaxation rate26:
where X = H or C, μ0 is the permeability of free space, h is Plank's constant, γH and γC are the gyromagnetic ratios of 1H and 13C, rHH and rHC is length of the H-H or C-H bond vector where angular brackets indicate time average. R2,polyplex was calculated as the sum of all proton-proton and proton-carbon contributions weighted by the fraction of H6, H8 and H2 or H1’ and H5 protons in each spectral region (assuming 1% 13C). J(ω) is the spectral density function as defined by the extended model-free formalism for isotropic tumbling and two timescales of internal motions27:
where S2 is the generalized order parameter (S2 = Sf2 Ss2), Sf2 is the order parameter for the fast internal motion (< 100 ps), Ss2 and τs is the order parameter and the correlation time respectively for the slow internal motion (> 500 ps). The following parameters were used for estimation of τm from R2,polyplex: S2 (H2/H6/H8) = 0.75 - 0.85 and S2 (H1’/H5) = 0.65 - 0.85; Sf2 = 0.95; τs = 1 - 5 ns; rCH is the distance to the directly bonded carbon and rHH reflect distances to neighboring protons within 4 Å from an idealized B-DNA model built with 3DNA28. The hydrodynamic diameter (DH = 2RH) for the polyplex (modeled as a spherical particle) was computed using Stoke's equation below with the range of estimated τm values
where kB is Boltzmann's constant, T is temperature in K, and η(T) is the solvent viscosity.
RESULTS AND DISCUSSION
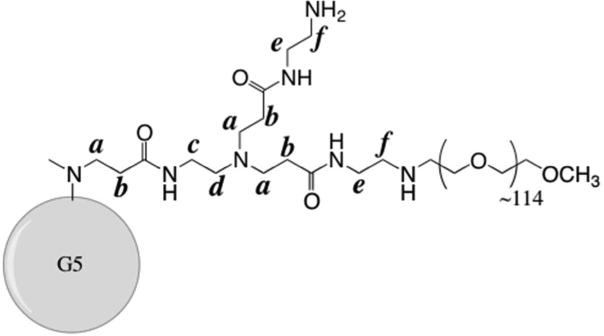
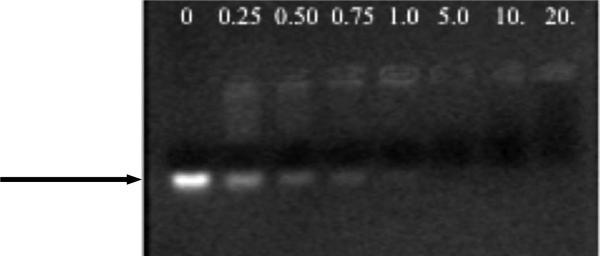
Using 10% PEGylation of the dendrimer primary amine end groups with 5 kDa PEG chains, we fully prevented precipitation of polyplexes (+/- ratios ≤ 5) up to a concentration of 0.7 mM and, thereby, successfully prepared polyplex samples suitable for characterization by high-resolution solution state NMR. As characterized by dynamic light scattering, the hydrodynamic diameter of the modified polymer (G5-NH2-PEG, Fig. 1) is 5.9 nm, compared to that of the unmodified G5-NH2 at 5.5 nm (data not shown). This indicates wrapping of poly(ethylene glycol) around the dendrimer, rather than a fully extended conformation of the chains. The ability of G5-NH2-PEG to still bind DNA was confirmed using gel electrophoresis (Fig. 2). DNA migration was completely prevented at a charge ratio of 0.75 by the unmodified dendrimer (Supplementary Fig. S1), compared to a charge ratio of 1.0 for the PEGylated analogue, which suggests a change in the stoichiometry of interaction due to the masked charge and steric hindrance of the PEG chains. This gel shift assay indicates the presence of free DNA at +/- ratios ≤ 1.0. Quantification of the relative intensity of the gel bands revealed 36%, 16% and 4% free DNA at +/- ratios of 0.25, 0.50 and 1.0, respectively. The results are consistent with the results obtained by Fant et al. probing with ethidium bromide.12
Figure 1.
Structure of G5-NH2-PEG, showing one arm of the fifth generation. Poly(ethylene glycol), ~5000 MW with ~114 repeat units, is conjugated to 10% (11/112) of the primary amines on the dendrimer.
Figure 2.
Agarose gel electrophoresis of 20-mer DNA (5’ CCACAGTGTTTGTGCAGCGG 3’) at increasing +/- ratios of G5-NH2-PEG. Free DNA is indicated by the band marked with the arrow. Loss of migration of DNA in the lane indicates complexation with dendrimer.
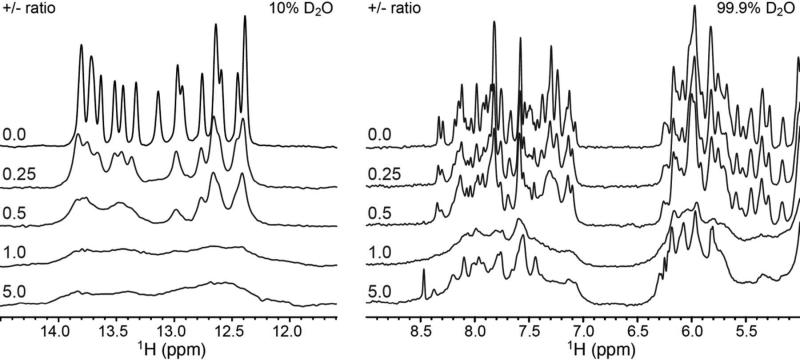
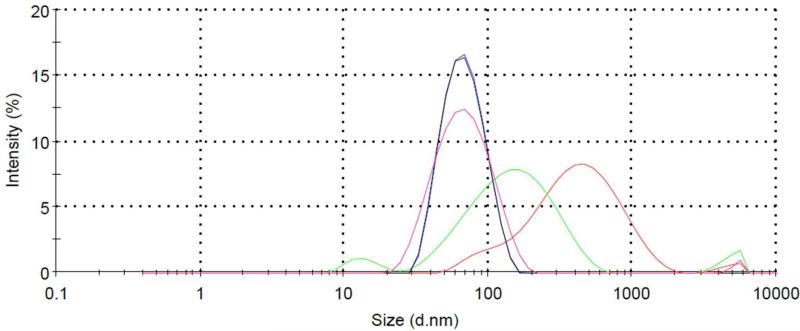
To gain further insights into the dynamic behavior of the polyplex, we recorded 1H NMR spectra as a function of increasing +/- ratio (Fig. 3). Incremental addition of G5-NH2-PEG to the 20 base pair DNA duplex resulted in gradual line broadening without any significant changes in the proton chemical shifts. The absence of sharp spectra of free DNA during the course of the titration suggests that the free DNA present, as indicated by the gel shift assay (Fig. 2) and ethidium bromide tritration,12 is in rapid exchange on the NMR timescale (< millisecond) with a dendrimer-bound polyplex state. This is also consistent with the smearing of the band on the gel at +/- ratios less than 1 and the observation of a single population in the dynamic light scattering (DLS) measurements (Fig. 4), run under the same conditions as the NMR spectra. As shown in Fig. 4, the average particle hydrodynamic diameter estimated by DLS is remarkably constant as +/- ratio increases from 0.50 to 1.0, with little change in distribution. Interestingly, at a +/-charge ratio of 5, we observe an increase in particular DNA peak intensities, or narrower linewidths, relative to conditions of charge neutrality (+/- = 1) (Fig. 3). This suggests that either DNA is being released from the polyplex (not supported by the gel electrophoresis data; Fig. 2), the DNA experiences increased local dynamics on the pico-to-nanosecond timescale due to change of conformation, or that differential levels of nanosecond internal motions are being manifested as a result of their decoupling from overall DNA motions, as the tumbling rate of the polyplex decreases.29
Figure 3.
1H NMR spectra of 300 μM DNA titrated with 300 mg/mL G5-NH2-PEG to increasing +/- ratio. (Left) DNA imino proton region. (Right) DNA aromatic (7.0 – 8.5 ppm) and ribose (5.0 – 6.5 ppm) regions.
Figure 4.
Distribution of particle hydrodynamic diameter (in nm) of NMR samples of increasing +/- ratio. DNA only (red), +/- = 0.25 (green), 0.50 (blue), 0.75 (black) and 1.0 (pink).
To further characterize the nature of the polyplex detected by the NMR experiments, we used the Carr-Purcell-Meiboom-Gill (CPMG) experiment to measure transverse relaxation rate constants (R2) for base and sugar protons of the DNA at various points of the titration at 37 °C. Experiments were performed in deuterated buffer to remove dendrimer amine signals overlapping with the base and ribose DNA regions. The “aromatic” (base H2/H6/H8; 6.8 – 8.8 ppm) and “ribose” (ribose H1’/base H5; 5.2 – 6.5 ppm) regions of the DNA spectra were integrated separately for determination of the R2 values. Measurements of R2 as a function of two τcp delays (delay between 180° pulses in CPMG experiments) revealed no evidence for slow chemical exchange. We observed little variation in R2 when changing τcp from 4 ms to 0.8 ms at +/- ratios of 0 to 0.5, indicating little Rex contribution and negligible chemical exchange around these timescales. This, together with the lack of significant changes in DNA proton chemical shifts, strongly suggests that the DNA line broadening observed with increasing +/- ratio is dominated by an effective increase in the size of the DNA (and hence intrinsic relaxation rate) due to dendrimer binding and not due to chemical exchange contributions, which are expected to be very small when the exchanging states have similar chemical shifts.
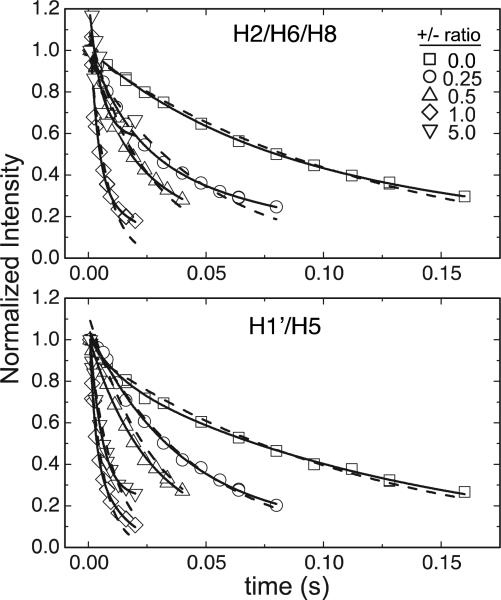
Fig. 5 shows measured decay curves as a function of delay time for increasing +/- ratio. Best fits of this data to mono- and bi-exponential decays are reported in Table 1 and Supplementary Table S1. Decays for the aromatic region fit better to a bi-exponential model, which can be explained by the intrinsically different relaxation properties of proton spins (i.e. H2 vs. H8)30 contained in the integrated regions, while decays for the ribose region dominated by H1’ protons were described well by a mono-exponential model. As shown in Table 1, R2 values from mono-exponential fits of the two regions increase similarly in a non-linear fashion with increasing dendrimer concentration up to +/- ratio of 1. This is consistent with an increase in the effective DNA molecular weight due to increased association with dendrimer. Again, we observe a decrease in R2,obs from +/- ratio 1 to 5, consistent with the narrower linewidths in the 1H DNA spectra and/or consistent with increased dynamics in the DNA.
Figure 5.
Intensity of the H2/H6/H8 (top) and H1’/H5 (bottom) region as a function of delay time at 37 °C for 300 μM DNA titrated with 300 mg/mL G5-NH2-PEG to increasing +/- ratio (inset). Monoexponential (dashed line) and biexponential (solid line) fit to the decay.
Table 1.
Observed R2 values from fitting the decay of integrated DNA aromatic H2/H6/H8 (6.8-8.8 ppm) and ribose H1’/aromatic H5 (5.2-6.5 ppm) region versus delay time for increasing +/- ratios.
| +/- Ratio | R2,obs (Hz) |
|---|---|
| Aromatic (H2/H6/H8) | |
| 0 | 8.1 ± 0.2 |
| 0.25 | 20.5 ± 1.0 |
| 0.50 | 36.2 ± 1.4 |
| 1.0 | 135.6 ± 14.5 |
| 5.0 | 42.4 ± 8.5 |
| Ribose (H1’)/Aromatic (H5) | |
| 0 | 8.7 ± 0.4 |
| 0.25 | 21.4 ± 0.6 |
| 0.50 | 34.6 ± 0.6 |
| 1.0 | 162.7 ± 13.5 |
| 5.0 | 94.0 ± 7.2 |
The NMR data suggest that the DNA is in rapid exchange with increasing amounts of dendrimer at increasing +/- ratios (up to 1). However, it remains difficult to resolve whether the DNA exchanges with one well-defined polyplex species that increases in population with increasing +/- ratio, or with a growing number of dendrimers condensed on the DNA or if aggregation of multiple polyplexes at high charge ratios results in many exchanging species. Assuming a two-state equilibrium between free DNA and a single polyplex species in the fast NMR timescale, where the chemical exchange constant is much larger than the chemical shift difference between the two states (kex >> Δω), the observed relaxation rates can easily be expressed as a population-weighted average of values for free and polyplex states31
| Eq. 1 |
in which we ignore chemical exchange contributions. Since pfree + pbound = 1 and both R2,obs and R2,free are measured experimentally, we used the above equation and a global fit of the relaxation data (R2,obs obtained from monoexponential fits) at different titration points to extract R2,polyplex and the fractions of free (pfree) and bound (pbound) DNA at each +/- ratio (Table 2). This relationship was previously considered for the spin-lattice relaxation rates of free and bound DNA by Bonechi et al.32,33 A similar method was also recently used to extract the relaxation profiles, chemical exchange, and binding affinities of two weakly interacting proteins.34 The computed value of R2,polyplex (Table 2) using the constraints outlined in Methods suggests a species with an estimated overall rotational correlation time, τm, of ~ 50–220 ns obtained from a range of motional parameters for aromatic and ribose protons and a corresponding polyplex hydrodynamic diameter of ~8-14 nm. This diameter is in good agreement with the predicted diameter of one DNA-dendrimer complex (~15 nm at theoretical charge neutrality based on 2-3 20mer DNA molecules per PEGylated dendrimer, which was measured to have a hydrodynamic diameter of 5.9 nm by DLS, data not shown). However, calculated pbound values at different +/- ratios, even with large error, do not show the characteristic saturation profile expected from a two-state binding (Supplementary Fig. S2). Instead, pbound values increase more rapidly, and point to a more complex behavior that likely involves a greater number of species. The average diameter of the polyplex species observed by NMR is also significantly smaller than the one obtained from DLS bulk measurements of polyplex particle size (~60 nm; Fig. 4). Thus, it is likely that small DNA-dendrimer complexes are in equilibrium with NMR-invisible higher aggregates, also supported by the decrease in the overall integrated area of the DNA imino and aromatic/ribose protons with increasing +/- ratios (Table 2). Differences in size, composition, and packing of the polyplex at +/- ratio of 1 versus 5 could lead to conformational changes (i.e. bending, fraying or helical deformations) in the DNA with elevated internal/global flexibility and account for the increased peak intensities and increase in apparent pfree at +/- ratio of 5.
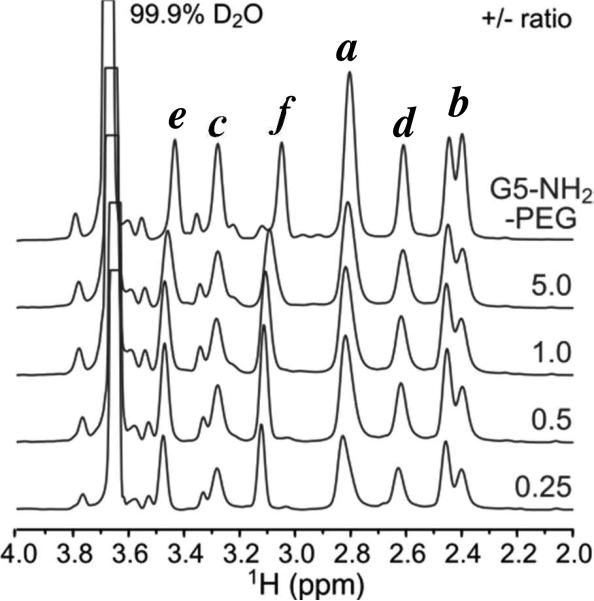
As an inverse experiment, we performed the NMR titration in the opposite direction to monitor dendrimer resonances upon increasing the concentration of DNA. Interestingly, while we do observe chemical shift perturbations that are consistent with rapid exchange of dendrimer with DNA, we observe little line broadening, even at very high DNA ratios (Fig. 6). We do not observe the increase in dendrimer proton line broadening (maximum estimated increase in R2,obs is ~ 2-fold as compared to ~ 20-fold for DNA) that would be expected upon formation of a large molecular weight polyplex. These data suggest that the dendrimer remains highly mobile in the polyplex, locally and globally, and exhibits solution-like dynamics even at high DNA ratios.
Figure 6.
1H NMR spectra of 300 mg/mL G5-NH2-PEG titrated with 20-mer DNA at 37 °C as a function of +/- ratio. Peak labels refer to those in Fig. 1.
Polymers used in conducting materials have been shown to exhibit dynamic chain motion, providing multiple coordination sites for counterions, leading to their transport.35 Polymer electrolytes are often formed using poly(ethylene oxide) or PEO, such as in PEOPMMA-H3PO4 (with hydrogen ions as charge carriers) or PEO3:LiCF3SO3 (with lithium and triflate ions as charge carriers). Both Przyluskie et al and Gadjourova et al showed that NMR linewidth of the species in these materials can reveal their dynamics.36,37
The polyplex structure of mobile dendrimer in a rigid framework of DNA has many implications both in polymeric gene delivery vector design and understanding the mechanisms of transfection and protein expression inside the cell. Fant et al. proposed a model for G5 PAMAM dendrimer-DNA binding that included higher order chiral DNA stacking of helices in a well-defined structure with dendrimers woven throughout, attracting the strands.38 This type of structure is consistent with our NMR observations of a rigid DNA lattice and might explain the formation of toroids (seen for dendrimers and many other polycationic DNA complexes, such as poly-L-lysine39, chitosan40 and spermidine41) due to the bundling of DNA helices. This polyplex structure polymorphism suggests DNA release could result from the dendrimer sampling multiple binding sites on the DNA, thereby regulating transcription, as previously hypothesized for spermine and histone protein DNA condensation.42 The delivered DNA must be released from the vector long enough to form the DNA transcriptional complex. Fant recently proposed that the uncondensed fraction of DNA in a G5 PAMAM dendrimer polyplex sample is responsible for transcription, based on separating the fractions with ultracentrifugation.38 Our NMR results indicate that the two fractions could be one in the same, with DNA release controlled by fast exchange and dendrimer mobility in the complex. It should be noted that polycation structure, molecular weight and PEGylation, as well as DNA length, can affect polyplex physicochemical properties, so care should be taken in extending these results to all nonviral gene delivery systems until experimental limitations of studying all systems are overcome.
CONCLUSION
Our results provide a new view of PAMAM dendrimer-DNA polyplexes, as featuring rigid but rapidly exchanging DNA associated with highly flexible and dynamic dendrimer that remains locally mobile. The faster-than-millisecond exchange rate of the DNA with the polyplex, possibly enhanced by the polymer's dynamics, provides an intrinsic mechanism of nucleic acid release from the polymeric delivery vector. Since release of DNA from the polyplex has been proposed as a rate-limiting step in the expression process, NMR approaches that can measure the dynamics of the exchange, such as those presented here, as well as 13C/15N relaxation and relaxation dispersion studies of isotopically labeled DNA or dendrimer, are of particular importance.
Supplementary Material
ACKNOWLEDGEMENTS
This work was supported by the NIH (R01 EB005028). L.E.P acknowledges support from the Michigan Chemistry Fellows program.
Footnotes
SUPPORTING INFORMATION
Gel electrophoresis shift DNA binding assay for G5-NH2. Fraction of bound DNA as a function of dendrimer concentration as determined by global fit of the relaxation data. Observed R2 values and amplitudes from biexponential fitting of the decay of integrated NMR signals versus delay time for increasing +/- ratios. This information is available free of charge via the Internet at http://pubs.acs.org.
REFERENCES
- 1.Boussif O, Lezoualc'h F, Zanta MA, Mergny MD, Scherman D, Demeneix B, Behr JP. A versatile vector for gene and oligonucleotide transfer into cells in culture and in vivo: polyethylenimine. Proc. Natl. Acad. Sci. USA. 1995;92:7297–7301. doi: 10.1073/pnas.92.16.7297. [DOI] [PMC free article] [PubMed] [Google Scholar]
- 2.Park TG, Jeong JH, Kim SW. Current status of polymeric gene delivery systems. Adv. Drug Deliv. Rev. 2006;58:467–486. doi: 10.1016/j.addr.2006.03.007. [DOI] [PubMed] [Google Scholar]
- 3.Gebhart CL, Kabanov AV. Perspectives on polymeric gene delivery. J. Bioact. Compat. Poly. 2003;18:147–166. [Google Scholar]
- 4.Tiera MJ, Shi Q, Winnik FM, Fernandes JC. Polycation-based Gene Therapy: Current Knowledge and New Perspectives. Curr. Gene Ther. 2011;11:288–306. doi: 10.2174/156652311796150408. [DOI] [PubMed] [Google Scholar]
- 5.Won Y-Y, Sharma R, Konieczny SF. Missing pieces in understanding the intracellular trafficking of polycation/DNA complexes. J. Control. Release. 2009;139:88–93. doi: 10.1016/j.jconrel.2009.06.031. [DOI] [PMC free article] [PubMed] [Google Scholar]
- 6.Kukowska-Latallo JF, Bielinska AU, Johnson J, Spindler R, Tomalia DA, Baker, J. JR. Efficient transfer of genetic material into mammalian cells using starburst polyamidoamine dendrimers. Proc. Natl. Acad. Sci. USA. 1996;93:4897–4902. doi: 10.1073/pnas.93.10.4897. [DOI] [PMC free article] [PubMed] [Google Scholar]
- 7.Braun CS, Vetro JA, Tomalia DA, Koe GS, Koe JG, Middaugh CR. Structure/function relationships of polyamidoamine/DNA dendrimers as gene delivery vehicles. J. Pharm. Sci. 2005;94:423–436. doi: 10.1002/jps.20251. [DOI] [PubMed] [Google Scholar]
- 8.Bielinska A, Kukowska-Latallo JF, Johnson J, Tomalia DA, Baker JR. Regulation of in vitro gene expression using antisense oligonucleotides or antisense expression plasmids transfected using starburst PAMAM dendrimers. Nucleic Acids Res. 1996;24:2176–2182. doi: 10.1093/nar/24.11.2176. [DOI] [PMC free article] [PubMed] [Google Scholar]
- 9.Leroueil PR, Hong S, Mecke A, Baker, J. JR, Orr BG, Banaszak Holl MM. Nanoparticle interaction with biological membranes: does nanotechnology present a Janus face? Acc. Chem. Res. 2007;40:335–342. doi: 10.1021/ar600012y. [DOI] [PMC free article] [PubMed] [Google Scholar]
- 10.Chen W, Turro NJ, Tomalia DA. Using ethidium bromide to probe the interactions between DNA and dendrimers. Langmuir. 2000;16:15–19. [Google Scholar]
- 11.Matsumoto Y, Itaka K, Yamasoba T, Kataoka K. Intranuclear fluorescence resonance energy transfer analysis of plasmid DNA decondensation from nonviral gene carriers. J. Gene Med. 2009;11:615–623. doi: 10.1002/jgm.1338. [DOI] [PubMed] [Google Scholar]
- 12.Fant K, Norden B, Lincoln P. Using ethidium to probe nonequilibrium states of DNA condensed for gene delivery. Biochemistry. 2011;50:1125–1127. doi: 10.1021/bi1015887. [DOI] [PubMed] [Google Scholar]
- 13.Wan L, Manickam DS, Oupický D, Mao G. DNA release dynamics from reducible polyplexes by AFM. Langmuir. 2008;24:12474–12482. doi: 10.1021/la802088y. [DOI] [PMC free article] [PubMed] [Google Scholar]
- 14.Shim MS, Wang X, Ragan R, Kwon YJ. Dynamics of nucleic acid/cationic polymer complexation and disassembly under biologically simulated conditions using in situ atomic force microscopy. Microsc. Res. Tech. 2010;73:845–856. doi: 10.1002/jemt.20856. [DOI] [PMC free article] [PubMed] [Google Scholar]
- 15.Yang H, Lopina ST, DiPersio LP, Schmidt SP. Stealth dendrimers for drug delivery: correlation between PEGylation, cytocompatibility, and drug payload. J. Mat. Sci. Mat. Med. 2008;19:1991–1997. doi: 10.1007/s10856-007-3278-0. [DOI] [PubMed] [Google Scholar]
- 16.Qi R, Gao Y, Tang Y, He R-R, Liu T-L, He Y, Sun S, Li B-Y, Li Y-B, Liu G. PEG-conjugated PAMAM dendrimers mediate efficient intramuscular gene expression. AAPS J. 2009;11:395–405. doi: 10.1208/s12248-009-9116-1. [DOI] [PMC free article] [PubMed] [Google Scholar]
- 17.Merdan T, Kunath K, Petersen H, Bakowsky U, Voigt KH, Kopecek J, Kissell T. PEGylation of poly(ethyleneimine) affects stability of complexes with plasmid DNA under in vivo conditions in a dose-dependent manner after intravenous injection into mice. Bioconjugate Chem. 2005;16:785–792. doi: 10.1021/bc049743q. [DOI] [PubMed] [Google Scholar]
- 18.Nguyen HK, Lemieux P, Vinogradov SV, Gebhart CL, Guerin N, Paradis G, Bronich TK, Alakhov VY, Kabanov AV. Evaluation of polyether-polyethyleneimine graft copolymers as gene transfer agents. Gene Ther. 2000;7:126–138. doi: 10.1038/sj.gt.3301052. [DOI] [PubMed] [Google Scholar]
- 19.Sung SJ, Min SH, Cho KY, Lee S, Min YJ, Yeom YI, Park JK. Effect of polyethylene glycol on gene delivery of polyethylenimine. Biol. Pharm. Bull. 2003;26:492–500. doi: 10.1248/bpb.26.492. [DOI] [PubMed] [Google Scholar]
- 20.Davis ME. Curr. Opin. Biotechnol. 2002;13:128–131. doi: 10.1016/s0958-1669(02)00294-x. [DOI] [PubMed] [Google Scholar]
- 21.Stankovics J, Crane AM, Andrews E, Wu CH, Wu GY, Ledley FD. Hum. Gene Ther. 1994;5:1095–1104. doi: 10.1089/hum.1994.5.9-1095. [DOI] [PubMed] [Google Scholar]
- 22.Plank C, Mechtler K, Szoka FC, Wagner E. Activation of the complement system by synthetic DNA complexes: a potential barrier for intravenous gene delivery. Hum. Gene Ther. 1996;7:1437–1446. doi: 10.1089/hum.1996.7.12-1437. [DOI] [PubMed] [Google Scholar]
- 23.Wang W, Xiong W, Wan J, Sun X, Xu H, Yang X. The decrease of PAMAM dendrimer-induced cytotoxicity by PEGylation via attenuation of oxidative stress. Nanotechnology. 2009;20:105103–105109. doi: 10.1088/0957-4484/20/10/105103. [DOI] [PubMed] [Google Scholar]
- 24.Chen W, Tomalia DA, Thomas JL. Unusual pH-dependent polarity changes in PAMAM dendrimers:□ Evidence for pH-responsive conformational changes. Macromolecules. 2000;33:9169–9172. [Google Scholar]
- 25.Delaglio F, Grzesiek S, Vuister GW, Zhu G, Pfeifer J, Bax A. NMRPipe: A multidimensional spectral processing system based on UNIX pipes. J. Biomol. NMR. 1995;6:277–293. doi: 10.1007/BF00197809. [DOI] [PubMed] [Google Scholar]
- 26.Early TA, Kearns DR, Hillen W, Wells RD. A 300 MHz proton nuclear magnetic resonance investigation of deoxyribonucleic acid restriction fragments: dynamic properties. Biochemistry. 1981;20:3764–3769. doi: 10.1021/bi00516a015. [DOI] [PubMed] [Google Scholar]
- 27.Clore GM, Szabo A, Bax A, Kay LE, Driscoll PC, Gronenborn AM. Deviations from the simple two-parameter model-free approach to the interpretation of nitrogen-15 nuclear magnetic relaxation of proteins. J. Am. Chem. Soc. 1990;112:4989–4991. [Google Scholar]
- 28.Lu X-J, Olson WK. 3DNA: a versatile, integrated software system for the analysis, rebuilding and visualization of three-dimensional nucleic-acid structures. Nat. Protoc. 2008;3:1213–1227. doi: 10.1038/nprot.2008.104. [DOI] [PMC free article] [PubMed] [Google Scholar]
- 29.Zhang Q, Sun X, Watt EW, Al-Hashimi HM. Resolving the motional modes that code for RNA adaptation. Science. 2006;311:653–656. doi: 10.1126/science.1119488. [DOI] [PubMed] [Google Scholar]
- 30.Feigon J, Denny WA, Leupin W, Kearns DR. Proton nuclear magnetic resonance investigation of the conformation and dynamics in the synthetic deoxyribonucleic acid decamers d(ATATCGATAT) and d(ATATGCATAT). Biochemistry. 1983;22:5930–5942. doi: 10.1021/bi00294a037. [DOI] [PubMed] [Google Scholar]
- 31.Cavanagh J, Fairbrother WJ, Palmer AG, III, Rance M, Skelton NJ. Protein NMR Spectroscopy: Principles and Practice. Academic Press Inc.; San Diego, CA: 2006. [Google Scholar]
- 32.Bonechi C, Donati A, Picchi MP, Rossi C, Tiezzi E. DNA-ligand interaction detected by proton selective and non-selective spin-lattice relaxation rate analysis. Coll. Surf. A: Phys. Eng. Asp. 1996;115:89–95. [Google Scholar]
- 33.Rossi C, Valensin G, Prugnola A, Niccolai N. Structure and dynamics of biomolecules in solution: nuclear magnetic relaxation studies. In: Naray-Szabo G, Simon K, editors. Steric Aspects of Biomolecular Interactions. CRC Press; Boca Raton, Florida: 1987. pp. 123–141. [Google Scholar]
- 34.Salmon L, Ortega Roldan JL, Lescop E, Licinio A, van Nuland N, Jensen MR, Blackledge M. Structure, dynamics, and kinetics of weak protein–protein complexes from NMR spin relaxation measurements of titrated solutions. Ang. Chem. Int. Ed. 2011;50:3755–3759. doi: 10.1002/anie.201100310. [DOI] [PubMed] [Google Scholar]
- 35.Armand M. Polymers with ionic conductivity. Adv. Mater. 1990;2:278–286. [Google Scholar]
- 36.Przyluski J, Wieczorek W, Glowinkowski S. Novel proton polymer ionic conductors. Electrochim. Acta. 1992;37:1733–1735. [Google Scholar]
- 37.Gadjourova Z, Andreev YG, Tunstall DP, Bruce PG. Ionic conductivity in crystalline polymer electrolytes. Nature. 2001;412:520–523. doi: 10.1038/35087538. [DOI] [PubMed] [Google Scholar]
- 38.Fant K, Esbjorner EK, Lincoln P, Norden B. DNA condensation by PAMAM dendrimers: self-assembly characteristics and effect on transcription. Biochemistry. 2008;47:1732–1740. doi: 10.1021/bi7017199. [DOI] [PubMed] [Google Scholar]
- 39.Shapiro JT, Leng M, Felsenfeld G. Deoxyribonucleic acid-polylysine complexes. Structure and nucleotide specificity. Biochemistry. 1969;8:3119–3132. doi: 10.1021/bi00836a014. [DOI] [PubMed] [Google Scholar]
- 40.Danielsen S, Varum KM, Stokke BT. Structural analysis of chitosan mediated DNA condensation by AFM: influence of chitosan molecular parameters. Biomacromol. 2004;5:928–936. doi: 10.1021/bm034502r. [DOI] [PubMed] [Google Scholar]
- 41.Lin Z, Wang C, Feng X, Liu M, Li J, Bai C. The observation of the local ordering characteristics of spermidine-condensed DNA: atomic force microscopy and polarizing microscopy studies. Nucleic Acids Res. 1998;26:3228–3234. doi: 10.1093/nar/26.13.3228. [DOI] [PMC free article] [PubMed] [Google Scholar]
- 42.Pelta J, Durand D, Doucet J, Livolant F. DNA mesophases induced by spermidine: structural properties and biological implications. Biophys. J. 1996;71:48–63. doi: 10.1016/S0006-3495(96)79232-9. [DOI] [PMC free article] [PubMed] [Google Scholar]
Associated Data
This section collects any data citations, data availability statements, or supplementary materials included in this article.


