Abstract
The spectroscopic properties and dynamics of the excited states of two different synthetic analogues of peridinin were investigated as a function of solvent polarity using steady-state absorption, fluorescence, and ultrafast time-resolved optical spectroscopy. The analogues are denoted S-1- and S-2-peridinin and differ from naturally-occurring peridinin in the location of the lactone ring and its associated carbonyl group, known to be obligatory for the observation of a solvent dependence of the lifetime of the S1 state of carotenoids. Relative to peridinin, S-1- and S-2-peridinin have their lactone rings two and four carbons more toward the center of the π-electron system of conjugated carbon-carbon double bonds, respectively. The present experimental results show that as the polarity of the solvent increases, the steady-state spectra of the molecules broaden, and the lowest excited state lifetime of S-1-peridinin changes from ~155 ps to ~17 ps which is similar to the magnitude of the effect reported for peridinin. The solvent-induced change in the lowest excited state lifetime of S-2-peridinin is much smaller and changes only from ~90 ps to ~67 ps as the solvent polarity is increased. These results are interpreted in terms of an intramolecular charge transfer (ICT) state that is formed readily in peridinin and S-1-peridinin, but not in S-2-peridinin. Quantum mechanical computations reveal the critical factors required for the formation of the ICT state and the associated solvent-modulated effects on the spectra and dynamics of these molecules and other carbonyl-containing carotenoids and polyenes. The factors are the magnitude and orientation of the ground and excited state dipole moments which must be suitable to generate sufficient mixing of the lowest two excited singlet states.
Keywords: carotenoids, excited states, optical spectroscopy, quantum computation, ultrafast kinetics
Introduction
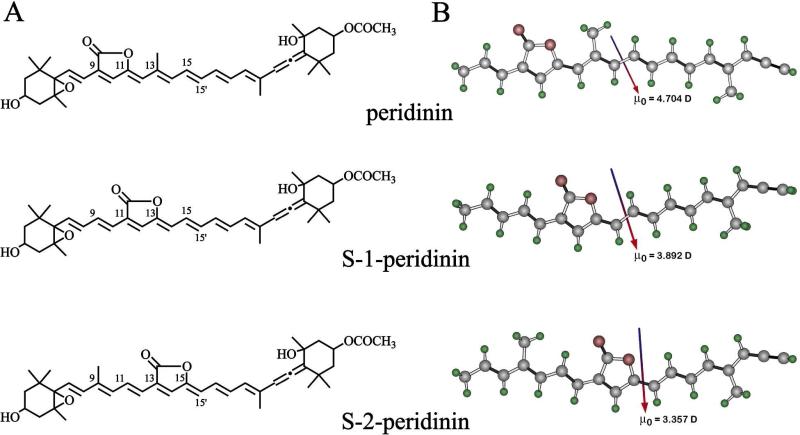
Correlating the excited state spectra and dynamics with the molecular structures of carotenoids is of critical importance in understanding how these molecules function in nature as light-harvesting components of photosynthetic pigment-protein complexes. The lowest-lying excited state, S1, of carotenoids is a state into which a one-photon transition from the ground state, S0, is forbidden. This is because both S0 and S1 are characterized by the same Ag– irreducible representation, and quantum mechanical selection rules require a change in both symmetry (g/u) and parity (+/–) for the S0 → S1 transition to be allowed.1-6 However, a one-photon transition between S0 and the S2 state which has Bu+ symmetry, is strongly allowed and responsible for the intense visible absorption bands of carotenoids.7 Carotenoids containing a carbonyl group in conjugation with the conjugated π-electron system of carbon-carbon double bonds show a strong dependence of solvent environment on the lifetime of the S1 state.8,9 Carotenoids lacking a conjugated carbonyl group do not show this behavior. The effect has been rationalized in terms of an intramolecular charge transfer (ICT) state that is formed due to the presence of the carbonyl group and coupled to the S1 state. It is thought that the energy of the ICT state can be either stabilized or destabilized relative to the S1 state depending on the polarity of the solvent environment, thereby affecting the excited state spectra and dynamics of the molecule.8,9 This behavior is exemplified by peridinin which is a highly-substituted, naturally-occurring carotenoid found in the light-harvesting pigment-protein complexes of many dinoflagellates.10,11 Peridinin possesses a carbonyl group in a lactone ring attached to the polyene chain between carbon positions 9 and 11 (Fig. 1A-. The S1 lifetime of peridinin has been reported to be ~175 ps in non-polar solvents and to drop to ~10 ps in highly polar solvents (Table 1).8,12 The idea of a solvent polarity-induced modulation of the energy of the ICT state relative to S1 has been supported by both theoretical computations13 and experiments not only on peridinin, but on several other carbonyl-containing carotenoids and polyenals.12,14-22 However, it remains uncertain whether the ICT state is quantum mechanically mixed with S1,12,23 a separate electronic state from S1,8,13,24,25 or simply the S1 state with a large intrinsic dipole moment brought about by mixing with the second excited single state, S2 (also denoted the 11Bu+ state).26
Figure 1.
(A) Structures of peridinin and analogues and (B) ground state vacuum geometries of the model chromophores used to represent peridinin, S-1-peridinin and S-2-peridinin in the theoretical studies. Ground state (vacuum) dipole moment vectors and magnitudes are shown. Geometries and dipole moments were generated using B3LYP/6-31G(d) density functional methods.
TABLE 1.
Lifetimes of the kinetic components associated with the deactivation of the excited states of peridinin, S-1-peridinin and S-2-peridinin.a,b,c
| molecule | solvent | Lifetime |
||
|---|---|---|---|---|
| τ1/fs | τ2/ps | τ3/ps | ||
| peridinin | n-hexane | < 170 | 1.4 ± 0.6 | 186 ± 6 |
| < 170 | 8 ± 2 | 186 ± 10 | ||
| MTBE | < 170 | 5 ± 1 | 185 ± 10 | |
| < 170 | 4 ± 1 | 180 ± 10 | ||
| ethyl acetate | < 170 | 3.0 ± 0.3 | 88 ± 2 | |
| < 170 | 3.6 ± 0.3 | 88 ± 2 | ||
| 2-propanol | < 170 | 5 ± 1 | 54 ± 3 | |
| < 170 | 2.1 ± 0.4 | 46 ± 1 | ||
| methanol | < 170 | 1.5 ± 0.3 | 11 ± 1 | |
| < 170 | 1.2 ± 0.1 | 9 ± 1 | ||
| S-1-peridinin | n-hexane | < 150 | 0.9 ± 0.4 | 155 ± 5 |
| MTBE | < 150 | 3.4 ± 0.4 | 156 ± 6 | |
| ethyl acetate | 180 ± 30 | 6.3 ± 0.6 | 132 ± 4 | |
| 2-propanol | 170 ± 30 | 10 ± 3 | 70 ± 4 | |
| methanol | 240 ± 40 | 5.7 ± 0.5 | 16 ± 1 | |
| 180 ± 50d | 5.3 ± 0.6d | 18 ± 2d | ||
| S-2-peridinin | n-hexane | 150 ± 30 | 1.9 ± 0.5 | 88 ± 4 |
| MTBE | 150 ± 30 | 0.7 ± 0.3 | 91 ± 4 | |
| ethyl acetate | < 150 | 2.0 ± 0.6 | 91 ± 3 | |
| 2-propanol | < 150 | 1.0 ± 0.4 | 90 ± 3 | |
| methanol | < 150 | 0.6 ± 0.2 | 64 ± 4 | |
| < 150d | 3.0 ± 0.5d | 69 ± 5d | ||
The uncertainties in the numbers were determined from an examination of the region of solution for each fitted parameter based on the values of the residuals.
The results on peridinin were taken from 28 Niedzwiedzki et al.28 and were measured at the wavelength corresponding to the maximum in the transient absorption bands of the S1 → Sn (first row of values) and ICT → Sn (second row of values) transitions.
The results on S-1-peridinin and S-2-peridinin were obtained from a global fitting analysis as described in the text and were measured in the visible spectral region (see Fig. S2) unless otherwise noted.
Global fitting results derived from transient absorption measurements in the NIR spectral region (see Figs. S3C and D).
In an attempt to pinpoint the precise structural features that give rise to the solvent dependence of the excited state dynamics of peridinin, and to test the various models for the nature of the ICT state, we have undertaken an investigation of synthetic peridinins having altered π-electron conjugated chain lengths and different functional groups relative to those found in naturally-occurring peridinin.27-29 In the present work we investigated two peridinin analogues denoted S-1- and S-2-peridinin (Fig. 1A) in which the lactone ring and its associated carbonyl group, known to be obligatory for the solvent dependence of the lifetime of the S1 state, is positioned at different locations along the conjugated polyene chain. Ultrafast time-resolved spectroscopic experiments on these molecules show that the position of the carbonyl group is critical for determining the magnitude of the effect of solvent environment on the lifetime of the S1 excited state. Quantum mechanical computations demonstrate that the orientation of the ground state dipole moment is critical for inducing “1Ag-” and “1Bu+” state mixing sufficient to form the ICT state. The experimental and computational results address the molecular nature of the ICT state and reveal the source of the solvent polarity-induced modulation of the S1 excited state lifetime.
Materials and Methods
Sample preparation
S-1-peridinin and S-2-peridinin were synthesized according to a procedure to be reported in a future publication, and were obtained as dried samples. Prior to the spectroscopic measurements, the samples were purified using high-performance liquid chromatography (HPLC) using a Millipore Waters 600E HPLC instrument equipped with a Waters 996 single diode-array detector. The samples were dissolved separately in acetonitrile and injected into the system employing a YMC-Carotenoid C30 column (250 × 4.6 mm with 5 μM particle size) and an isocratic mobile phase consisting of acetonitrile/methanol/water (87/10/3, v/v/v) at a flow rate of 0.8 mL/min. S-1- and S-2-peridinin eluted in separate runs at 19 ± 1 and 20 ± 1 min, respectively. The molecules were collected from the HPLC, dried under a gentle stream of nitrogen gas, and stored at -80°C until ready for use in the spectroscopic experiments.
Steady-state absorption and fluorescence
For the spectroscopic measurements, S-1- and S-2-peridinin were dissolved in solvents having different polarities, P(ε), but similar polarizabilities, P(n). The solvents were: n-hexane (P(ε) = 0.229, P(n) = 0.228), methyl tert-butyl ether (MTBE, P(ε) = 0.350, P(n) = 0.226), ethyl acetate (P(ε) = 0.626, P(n) = 0.226), 2-propanol (P(ε) = 0.852, P(n) = 0.230), and methanol (P(ε) = 0.913, P(n) = 0.203). Steady-state absorption spectra were measured on a Varian Cary 50 UV-visible spectrometer. Fluorescence spectra were recorded on a Jobin-Yvon Horiba Fluorolog-3 model FL3-22 equipped with double monochromators having 1200 grooves/mm gratings, a Hamamatsu R928P photomultiplier tube detector, and a 450 W ozone-free Osram XBO xenon arc lamp. The sample fluorescence was detected at a right angle relative to the excitation light set at 476 nm. The emission spectra were corrected for the instrumental response using a file generated from a standard lamp. The emission and excitation bandwidths were set at 5 nm. All measurements were done at room temperature.
Transient absorption spectroscopy
Transient absorption spectra were recorded at room temperature on a femtosecond transient absorption spectrometer system based on a Ti:Sapphire amplifier pumped by a Nd:YLF laser at a repetition rate of 1 kHz as reported previously.30 The samples were adjusted to an optical density between 0.4 and 0.6 in a 2 mm path length cuvette at the excitation wavelength set at 483 nm for all the transient absorption measurements in the visible and near IR (NIR) spectral regions. The pump laser beam was set to an energy of 1 μJ/pulse and a spot size of 1 mm diameter, corresponding to an intensity of ~3.1 × 10¹⁴ photons/cm2 per pulse. The transient signals were recorded as an average over 5 s. A 2048-pixel array charge-coupled detector (CCD) from Ocean Optics was used for detection of transient signals in the visible spectral region. A 512-pixel array SU-LDV Digital Line Scan Camera from Sensors Unlimited was used for detection in the NIR region. The samples were mixed continuously with a magnetic microstirrer during the transient absorption measurements. Steady-state absorption spectra were taken before and after measurements to ensure no photodegradation occurred during the course of the experiment. The transient data were subtracted with background or scattered excitation light and corrected with chirp due to the probe pulse using Surface Xplorer Pro (v.1.2.2.26) software. Global fitting analysis on the basis of a sequential decay model was carried out using ASUfit version 3.0 software made available by Dr. Evaldas Katilius (Arizona State University). The quality of fit was checked based on minimization of the residuals plot and chi squared (χ2) value.
Computational methods
All calculations were carried out on the model chromophores shown in Fig. 1B. These model compounds include the entire polyene chain as well as all substitutions along the polyene chain. The large β-rings, however, are excluded. Comparison of transition energies calculated for the full chromophore versus the model chromophore indicate that the level ordering of the four lowest excited singlet states is unaffected by exclusion of the rings (see Fig. S1 in the supplementary information). The significant advantage afforded by the use of these model compounds includes not only a smaller size but also Cs symmetry. The combination reduces computation time by a factor of 50 for the time consuming equation of motion coupled cluster singles with doubles (EOM-CCSD) calculations, and makes solvent calculations tractable.
Ground state geometries were generated using B3LYP/6-31G(d) methods as implemented in Gaussian 09. Excited state geometries were generated using configuration interaction single (CIS) methods, with an 8 filled × 8 virtual molecular orbital (MO) active space.31 The effect of solvent environment was simulated using the Polarizable Continuum Model (PCM).32-35 We found that a combination of CIS and PCM methods provided the most reliable method of generating excited state geometries in the solvent environment.32-34
Spectroscopic properties were calculated using EOM-CCSD methods.36-38 The EOM-CCSD methods work well in conjunction with PCM solvent effects.32 We also explored the dipolar properties of the excited states by symmetry adapted clustered configuration interaction (SAC-CI) methods.39-41
Results
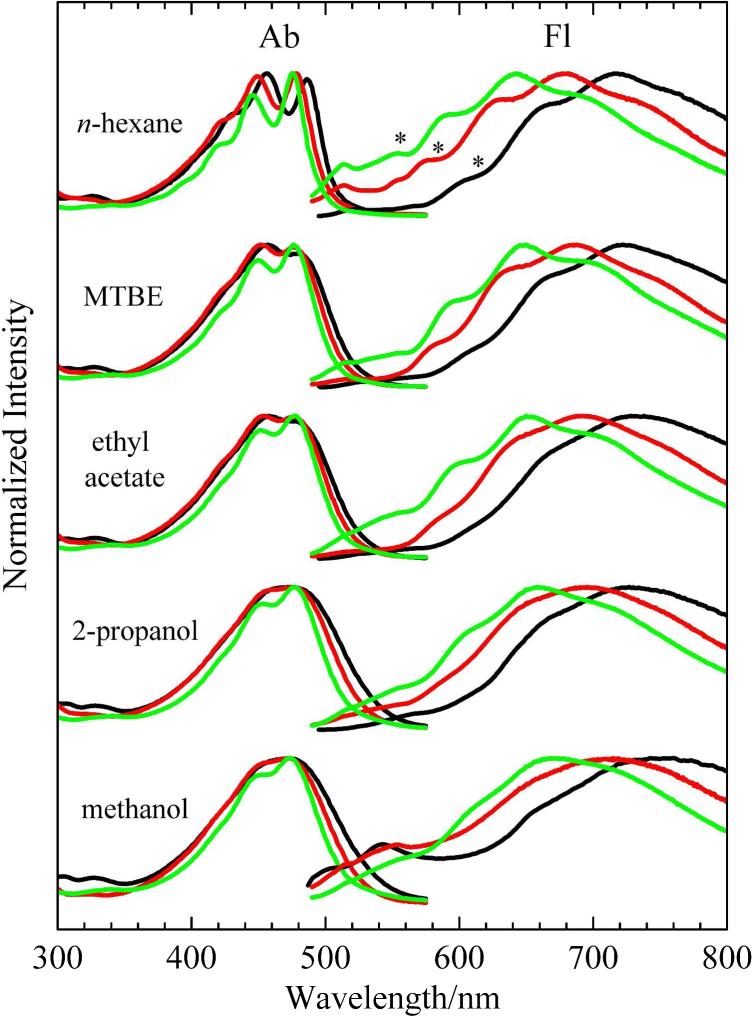
Steady-state absorption spectra of peridinin and S-1- and S-2-peridinin in solvents having different polarities are shown in Fig. 2. The figure shows that the (0-0) spectral origin band of the strongly-allowed S (11Ag-) → S2 (11Bu+) transition of S-1-peridinin and S-2-peridinin in the non-polar solvent, n-hexane, is blue-shifted 7 and 9 nm, respectively, relative to the spectral origin of peridinin. Also, in n-hexane, the molecules exhibit resolved vibrational features in the absorption spectral lineshapes (Fig. 2), but the relative intensities of the vibronic bands are different. The Franck-Condon maximum in the absorption spectrum of peridinin corresponds to the 0-1 vibrational band, whereas the most prominent band in the absorption spectra of S-1-peridinin and S-2-peridinin is the 0-0 band. This difference in intensity of the vibronic bands indicates that there is less of a shift of the S2 potential energy surface relative to the ground S0 state for S-1-peridinin and S-2-peridinin compared to naturally-occurring peridinin. However, as the polarity of the solvent increases, the vibrational structure in the absorption spectra becomes less evident, and for peridinin and S-1-peridinin dissolved in the most polar solvent, methanol, the features are broadened and completely unresolved. This behavior is typical of carotenoids containing a carbonyl group. However, S-2-peridinin in methanol retains a very small, but noticeable amount of vibronic resolution in its absorption spectrum (Fig. 2). Thus, moving the lactone ring toward the center of the conjugated π-electron chain results in a slight increase in the energy of the S0 → S2 transition (for both S-1- and S-2-peridinin) and a modest improvement in the vibronic resolution of the spectrum (for S-2 peridinin only) relative to peridinin.
Figure 2.
Steady-state absorption (Ab) and fluorescence (Fl) spectra of peridinin (black lines), S-1-peridinin (red lines) and S-2-peridinin (green lines) recorded in different solvents at room temperature. The spectra were normalized to each other. Asterisks indicate the (0-0) vibrational bands of the S1 → S0 fluorescence in n-hexane.
As seen in the absorption spectra, a blue-shift is observed in the fluorescence profiles of S-1- and S-2-peridinin relative to that of peridinin, and the spectra broaden and lose vibronic resolution as the polarity of the solvent increases (Fig. 2). The prominent emission bands observed in the visible region from all the molecules correspond to fluorescence from the S1 state. The dominance of S1 emission over S2 emission is characteristic of carotenoids having less than eight conjugated carbon-carbon double bonds.42-44 However, the fluorescence spectra of peridinin and S-1-peridinin in methanol exhibit a noticeable band at ~540 nm (bottom right hand black and red lines in Fig. 2) that can be attributed to fluorescence from the S2 state. The corresponding band in the fluorescence spectrum of S-2-peridinin in methanol (bottom right hand green line in Fig. 2) is significantly weaker, and it is also evident at ~510 nm in the spectrum of S-2-peridinin in n-hexane (top right hand green line in Fig. 2). Whether S2 → S0 fluorescence appears in the overall emission spectrum depends on the lifetime of the S2 state, which may be modulated by changes in the S2 - S1 energy gap induced by the solvent, and further affected by alterations in the molecular structure of the carotenoid.28,45 A short S2 lifetime driven by internal conversion to S1 or by populating the ICT state would lead to a lower probability of observing fluorescence from the S2 state.28
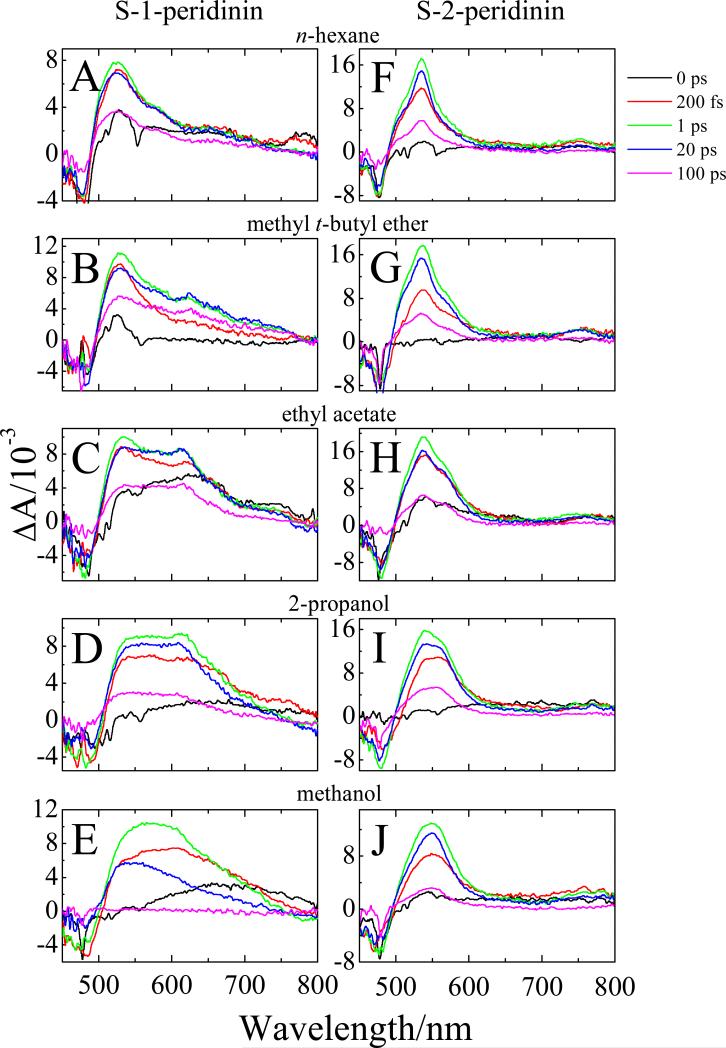
Transient absorption spectra of S-1- and S-2-peridinin recorded in the visible region at 0, 0.2, 1, 20 and 100 ps time delays are shown in Fig. 3. The samples were excited into the (0-0) vibrational bands of their S0 → S2 transitions. The transient spectra exhibit ground state bleaching of the steady-state absorption in the 450 to 500 nm wavelength region and a build-up of excited state absorption (ESA) starting at 500 nm and extending as far out as 800 nm depending on the molecule and the solvent. For S-1-peridinin in the non-polar solvent, n-hexane (Fig. 3A), the major ESA band reaches a maximum at ~1 ps at a wavelength of ~525 nm and is associated with a strongly-allowed S1 → Sn transition. However, as the polarity of the solvent increases (Figs. 3B-E) the build-up of a lower energy ESA band in this time domain at ~610 nm is evident. This band is attributed to an ICT → Sn transition which has been reported to be present in the ESA spectra of carbonyl-containing carotenoids recorded in polar solvents.8,9,16,46 The ICT → Sn spectral feature becomes much more pronounced and merges with the S1 → Sn band as the solvent polarity increases. In the most polar solvent, methanol, the ESA spectrum of S-1-peridinin taken at a 1 ps delay (green line in Fig. 3E) appears almost entirely as single broad band.
Figure 3.
Transient absorption spectra in the visible region of S-1-peridinin and S-2-peridinin recorded in different solvents at room temperature at 0, 0.2, 1, 20 and 100 ps time delays. The excitation wavelength of the samples was 483 nm.
For S-2-peridinin in n-hexane, MTBE, ethyl acetate and 2-propanol (Figs. 3F-I), the major ESA signal at 1 ps is characterized by a strong band peaking at ~540 nm attributed to the S1 → Sn transition. Also, in the solvents, MTBE, ethyl acetate and 2-propanol, a shoulder at ~560 nm is evident in the transient absorption spectra. This spectral feature may be associated with the ICT → Sn transition, and it is significantly blue-shifted from ~610 nm as seen for S-1-peridinin. The transient absorption of S-2-peridinin in methanol (Fig. 3J) is characterized by a broad, asymmetric band, due to the fact that the S1 → Sn and ICT → Sn transitions have coalesced.
Figure S2 shows the results of a global analysis of the spectral and temporal datasets in the visible region for S-1-peridinin and S-2-peridinin fit to a sequential decay model. The fitting results in evolution-associated difference spectra (EADS). In all cases three decay components were required to obtain a good fit to data based on a minimization of the residuals plot and χ2 value. The kinetic lifetimes obtained from the global analysis are summarized in Table 1. The fastest EADS component (black lines in Fig. S2) is associated with the lifetime of the S2 excited state and is characterized by the onset of a bleaching of the S0 → S2 steady-state absorption and stimulated emission from S2. For S-1-peridinin the first EADS decayed anywhere from 120 to 240 fs depending on the solvent, to form the second EADS (red lines in Figs. S2A-E). This second component decayed in 0.9 to 10 ps depending on the solvent. The third EADS for S-1-peridinin (green lines in Figs. S2A-E), which is generally thought to correspond to the vibrationally relaxed S1/ICT → Sn component decayed in 155 ps in n-hexane, 156 ps in MTBE, 132 ps in ethyl acetate, 70 ps in 2-propanol, and 16 ps in methanol.
For S-2-perdinin, the first EADS component decayed in 110 to 150 fs and is associated with the lifetime of its S2 excited state. This component evolved into the second EADS (red lines in Figs. S2F-J), with lifetimes ranging from 0.6 to 2.0 ps. The third EADS (green lines in Figs. S2F-J) exhibited a value of 90 ± 2 ps in n-hexane, MTBE, ethyl acetate and 2-propanol and was slightly shortened to 64 ps in methanol.
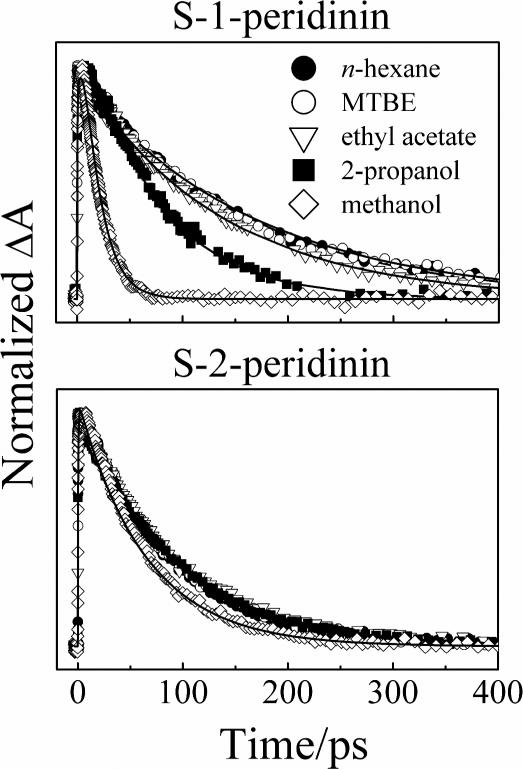
Kinetic traces probed at the maximum of the S1 → Sn transition of S-1- and S-2-peridinin are shown Fig. 4. S-1-peridinin displayed a dramatic shortening of the S1 state lifetime from 155 ps to 16 ps in going from the non-polar solvent, n-hexane, to the most polar solvent, methanol. S-2-peridinin, on the other hand, displayed only a very weak dependence of solvent on the S1 excited state lifetime, which changed from 88 ps in n-hexane to 64 ps in methanol.
Figure 4.
Experimental kinetic traces (symbols) monitored at the maximum wavelength associated with the S1 → Sn transient absorption with fits (solid lines) obtained from a global analysis. The probe wavelengths for S-1-peridinin were 524 (n-hexane), 530 (MTBE), 536 (ethyl acetate) and 555 nm (2-propanol and methanol). The probe wavelengths for S-2-peridinin were 534 (n-hexane), 536 (MTBE), 539 (ethyl acetate), 540 (2-propanol) and 549 nm (methanol). The amplitudes of the kinetic traces were normalized to facilitate comparison.
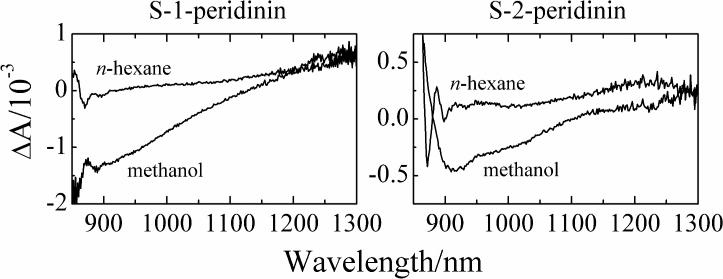
To further investigate the nature of the ICT state, the transient spectra of S-1-peridinin and S-2-peridinin were recorded in the NIR region from 850 to 1300 nm. Transient data taken at different time delays for the molecules dissolved in methanol, and the corresponding EADS resulting from a global fitting analysis, are shown in Fig. S3. The results of the kinetic analysis in the NIR reveal that the lifetimes are consistent with those obtained from spectra recorded in the visible region (Table 1). The transient spectra in the NIR for both molecules were dominated by a negative band at ~900 nm which is the feature typically associated with stimulated emission from the ICT state. Figure 5 overlays the transient features of S-1- and S-2-peridinin in n-hexane and methanol taken in the NIR region at a 1 ps time delay. From these data it is clear that stimulated emission from the ICT state is not observed for the molecules dissolved in the nonpolar solvent, n-hexane, but it is observed when the molecules are dissolved in the polar solvent, methanol. This supports the assignment of the emission at ~900 nm to the ICT state. However, the amplitude of the ICT state emission of S-1-peridinin is stronger than that of S-2-peridinin, and is seen by comparing the traces for the two molecules taken at a 1 ps delay (Figs. S3A and B) prior to any substantial decay of the ICT state, and also by comparing the third EADS traces (Figs. S3C and D) which are dominated by ICT emission. Both comparisons suggest that S-1-peridinin has a larger ICT state population than S-2-peridinin.
Figure 5.
Overlay of the transient absorption spectra of S-1-peridinin and S-2-peridinin in n-hexane and methanol taken in the NIR region at a 1 ps time delay after excitation at 483 nm.
Discussion
Steady-state absorption and fluorescence
The absorption spectra of S-1-peridinin and S-2-peridinin show substantial line-broadening and loss of vibronic resolution when the molecules are dissolved in increasingly polar solvents (Fig. 2). This behavior is very similar to that seen for peridinin (Fig. 2) and is characteristic of carotenoids having a carbonyl group in conjugation with the π-electron system.16,28,29,47 The spectral broadening can be attributed to the proliferation of conformational isomers with increasing polarity of the solvent in which the carotenoid is dissolved. This occurs because of inhomogeneity imposed by the polar solvent whereby each spectrum of a member of the ensemble is shifted by slightly different amounts based on the local environment. The vibronic distribution is also affected by solvent polarity.26,48,49 A similar phenomenon is observed in the fluorescence spectra of the molecules (Fig. 2). Less vibronic resolution is observed in the emission spectra of the molecules dissolved in the more polar solvents, 2-propanol and methanol (Fig. 2), compared to the spectra of the molecules dissolved in the less polar solvents, n-hexane and MTBE (Fig. 2). This behavior can also be attributed to an increase in the number of conformational isomers when the carotenoids are dissolved in polar solvents.
It is interesting to note that in a given solvent, the spectral origin (0-0) band of the S0 → S2 absorption spectrum changes less than 10 nm in going from peridinin to S-1-peridinin to S-2-peridinin. For the molecules dissolved in n-hexane, the values are 485 nm, 478 nm and 476 nm, respectively (Fig. 2), which suggests that the effective π-electron conjugated chain length of all three molecules is very similar. This observation stands in contrast to the significant difference in the position of the spectral origin in the S1 → S0 fluorescence spectra of the three molecules. For the molecules dissolved in n-hexane, the (0-0) band blue-shifts from 615 nm to 585 nm to 555 nm for peridinin, S-1-peridinin, and S-2-peridinin, respectively, (Fig. 2). Thus, the energy of the S1 state is much more profoundly affected by the position of the lactone ring along the polyene chain of the structure, than is the energy of the S2 state. The S1 state shifts to higher energy as the lactone ring moves toward the geometric center of the molecule. This experimental observation is reproduced in the theoretical calculations discussed in detail below.
Excited state spectra and dynamics
For the molecules dissolved in the nonpolar solvent, n-hexane, although the S1 state energy increases in going from peridinin to S-1-peridinin to S-2-peridinin, the lifetime of the S1 state decreases from 186 ps to 155 ps to 88 ps for the molecules in this same order (Table 1). This trend is precisely the opposite of that expected for carotenoids based on the energy gap law for radiationless transitions.28,50,51 Thus, the present data suggest that factors other than the energy of the S1 state are controlling the dynamics of this state. These factors most likely involve the ICT state.
It is observed that as the polarity of the solvent in which the carotenoid is dissolved increases, the S1 lifetime decreases. This effect is substantial for peridinin and S-1-peridinin, but much less for S-2-peridinin (Table 1). Previous work has attributed the trends in the dynamics of the lowest-lying excited state of carbonyl-containing carotenoids to the relative positions of the S1 and ICT excited states which can change as a function of π-electron chain length and solvent polarity.28 Alterations in the π-electron conjugation affect primarily the S1 energy, whereas the polarity of the solvent modulates the position of the ICT state. As the polarity of the solvent increases, the ICT state becomes stabilized, and in many cases falls below that of the S1 state, opening up a new avenue for nonradiative deactivation of the S1 state. The present kinetic data suggest that either stabilization of the ICT state is occurring for S-1-peridinin, and much less so for S-2-peridinin, or that the formation of the ICT state of S-2-peridinin is somehow otherwise inhibited. In any case, the precise π-electron configuration and the nature of the solvent must be considered simultaneously to fully interpret the excited state spectra and dynamics of these molecules.
Modeling the ICT state in S-1- and S-2-peridinin
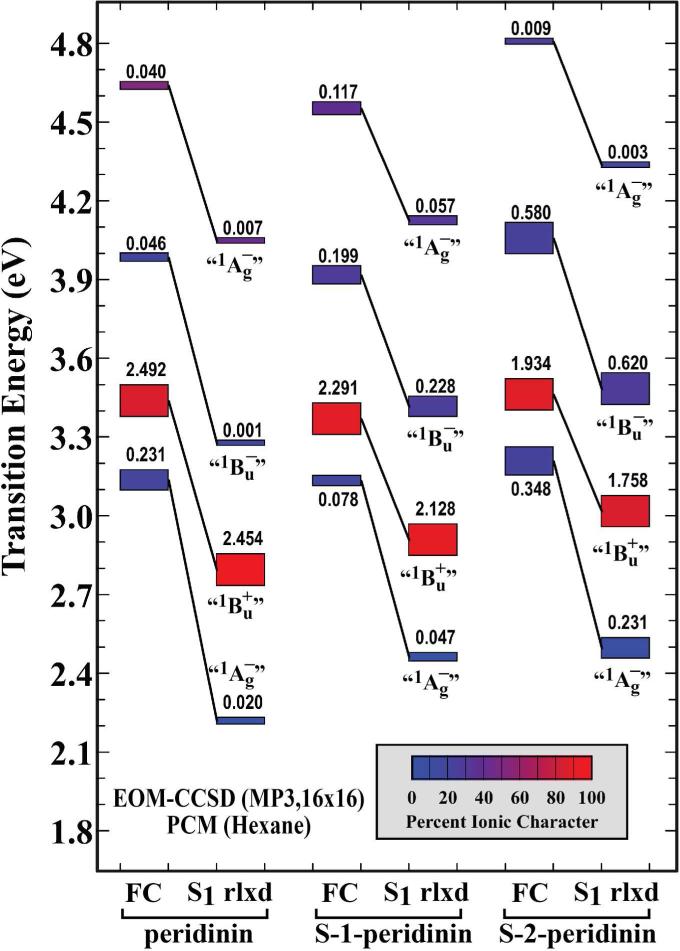
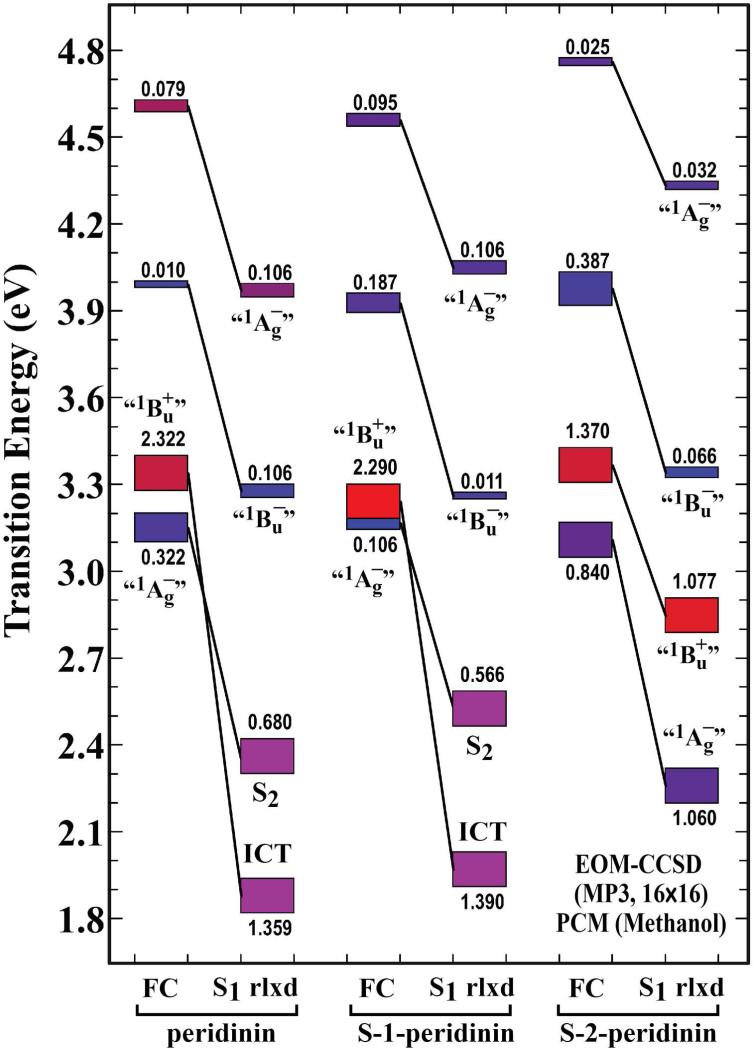
In order to address the molecular nature of the ICT state, we explored the hypothesis that in peridinin it is an evolved state formed via interaction of the lowest-excited singlet state with a polar solvent environment.52 The first excited singlet state geometries were minimized in n-hexane and methanol using the CIS and PCM methods. (See the Computational methods details in the Materials and Methods section.) We then calculated the transition energies and oscillator strengths using EOM-CCSD theory.36-38 The EOM-CCSD results are presented in Figs. 6 (n-hexane) and 7 (methanol). The experimental results indicate that the ICT state is only formed in polar solvent, and furthermore, that a pure ICT state is only observed in peridinin and S-1-peridinin. As shown in Fig. 6, the calculations predict that all three chromophores have lowest-lying forbidden states in n-hexane. As we will explore in more detail below, the relaxation process involves a bond order shift which previous studies indicate would be complete in less than 100 fs.47 Thus, we can assume that fluorescence occurs from the relaxed S1 state. The model compound calculations shown in Fig. 6 predict oscillator strengths of 0.02, 0.05 and 0.23 for peridinin, S-1-peridinin and S-2-peridinin. These values are consistent with an inverse relationship with the lifetimes shown in the last column of Table 1, which are 186 ps, 155 ps and 88 ps, respectively. The corresponding values for methanol from Fig. 7 are 1.359 (11 ps), 1.390 (16 ps) and 1.060 (64 ps) for the oscillator strength and lifetime in parentheses. Again we observe an inverse relationship. It should be noted that if we use the Franck-Condon oscillator strength (FC in Figs. 6 and 7), we get a very poor agreement with experiment. These results justify the comparison of the experimental data with the relaxed S1 results and provide support for our methods and theoretical procedures.
Figure 6.
Properties of the excited state manifolds of peridinin, S-1-peridinin, and S-2-peridinin calculated in n-hexane (ε=1.8819) on EOM-CCSD theory. The EOM-CCSD calculations used a 16×16 molecular orbital active space, and are referenced to the partially correlated MP3 ground state. Calculations were carried out for the ground state geometry in n-hexane (FC=Franck-Condon geometry, rlxd= S1-relaxed) and for the first excited singlet state relaxed geometry in n-hexane. The lowest excited singlet state geometries were calculated by using single CI methods and an 8×8 active space and PCM solvent methods. Calculations were based on the model compounds shown in Fig. 1B.
Figure 7.
Properties of the excited state manifolds of peridinin, S-1-peridinin, and S-2-peridinin calculated in methanol (ε=32.613) based on EOM-CCSD theory. The EOM-CCSD calculations used a 16×16 molecular orbital active space, and are referenced to the partially correlated MP3 ground state. Calculations were carried out for the ground state geometry in methanol (FC=Franck-Condon geometry, rlxd= S1-relaxed) and for the first excited singlet state relaxed geometry in n-hexane. The lowest excited singlet state geometries were calculated by using single CI methods and an 8×8 active space and PCM solvent methods. Calculations were based on the model compounds shown in Fig. 1B.
Configurational analysis of the EOM-CCSD calculations indicates that in methanol, peridinin and S-1-peridinin form a lowest-lying ICT state but that S-2-peridinin retains the standard level ordering of a lowest-lying “1Ag–” state (Fig. 7). Polar solvent does increase the mixing of the “1Ag–” and “1Bu+” states in S-2-peridinin which is a prerequisite to the formation of the ICT state.
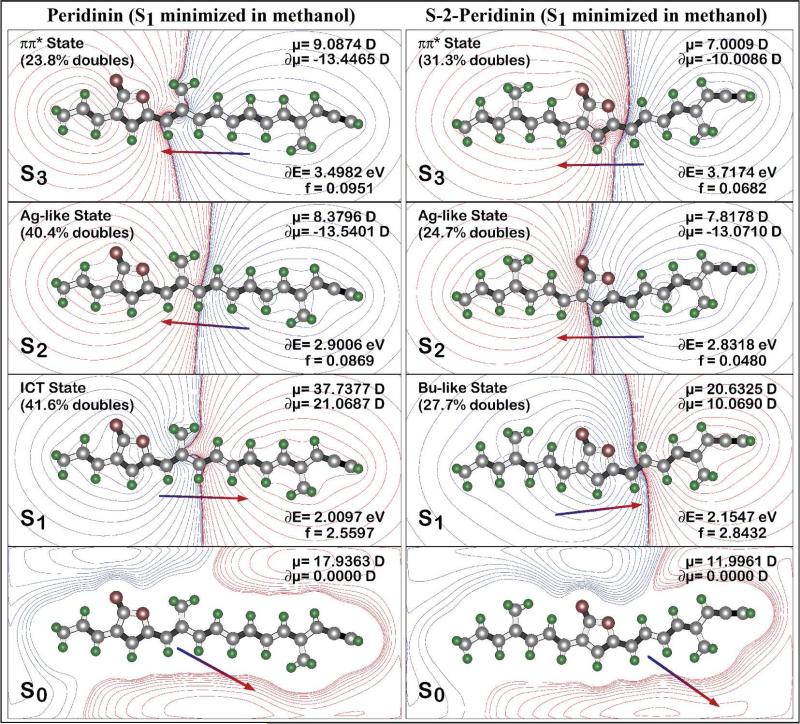
The molecular origins of the above differences and the effect of solvent on the dynamics can be attributed to the directions and magnitudes of the ground and excited state dipole moments. To explore this issue in quantitative detail, we used SAC-CI methods to calculate the dipolar properties of the chromophores. The results for peridinin and S-2-peridinin, based on the model compounds (Fig. 1B), are shown in Fig. 8. These results are associated with the static ground state dipole moments shown in Fig. 1B. First, the position of the lactone ring has an important influence on the magnitude and direction of the ground state and excited state dipole moments. For optimal ICT state formation, the ground and excited state dipole moments should be aligned identically and the ground state dipole moment should be as large as possible. This goal is achieved to a maximal extent in peridinin, and poorly achieved in S-2-peridinin. S-1-peridinin represents an intermediate case. Formation of the ICT state must be accomplished in less than 100 fs based on experimental observation. (See above.) Thus, the excited state solvent distribution must be nearly identical to the ground state distribution to achieve the <100 fs goal. This observation explains why the ground and excited state dipole moments must be nearly co-aligned for efficient formation of the ICT state.
Figure 8.
Comparison of the dipolar and configurational characteristics of the low-lying excited singlet states in peridinin (left) and S-2-peridinin (right) for the relaxed S1 geometries in methanol. The properties were calculated using SAC-CI methods including full single and partial double configuration interaction using level three integral selection. The effect of solvent was calculated using PCM methods (see text). Calculations were based on the model compounds shown in Fig. 1B.
Molecular rearrangements in the ICT state
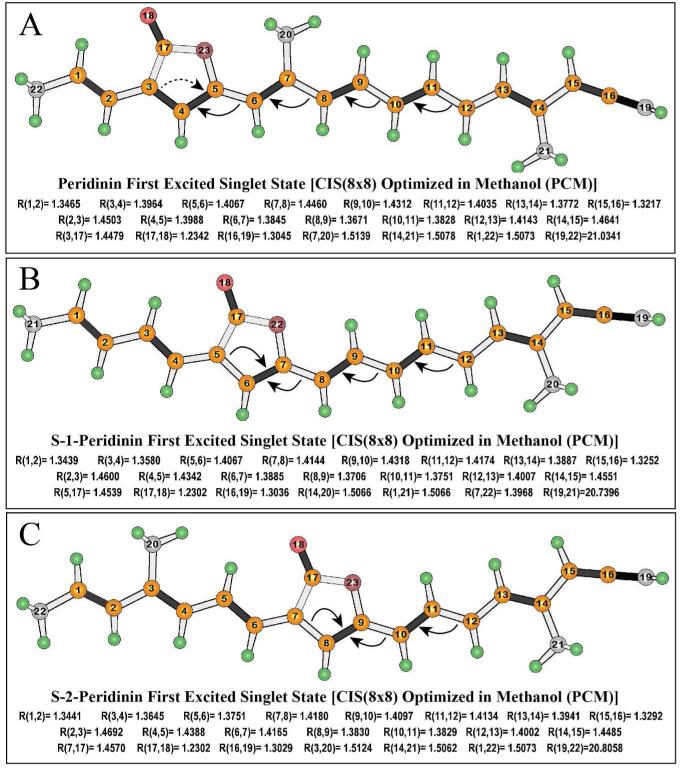
The formation of the ICT state involves bond order reversal near the center of the polyene chain. The key bond lengths in the lowest excited singlet states of the model compounds of peridinin, S-1-peridinin and S-2-peridinin are shown in Fig. 9, where the arrows indicate bonds, which have shortened upon relaxation into the S1 equilibrium geometry. Note that all of the bond order reversals take place between the β-carbon of the lactone ring (the carbon atom within the polyene chain closest to the carbonyl group) and C13 (Fig. 9). The electronic origins of these constraints are associated with the nature of the LUMO orbitals, and the role that the lactone ring plays in mediating these orbitals. This observation follows from the fact that the dominant configuration of the lowest-lying relaxed singlet state is a HOMO → LUMO single excitation, and it is occupation of the LUMO orbital that is key to the bond order reversal.
Figure 9.
Comparison of the excited state relaxed geometries of the model compounds in methanol based on Hartree Fock CIS methods using an 8×8 active space. Arrows identify the primary changes in bond order where the arrows point to those bonds, which are shortened in the excited state, and the origins of the arrows identify the bonds that are lengthened. Selected bond lengths in Ångstroms are listed below each structure. The corresponding values for the ground state are presented in Fig. S1.
The last distance reported in Fig. 9 is the total length of the chromophore segment (minus the hydrogen atoms). These values, when compared to the ground state values (Fig. S1 of the supplementary section), provide a theoretical estimate of the change in the chromophore length following excitation and relaxation in S1: Peridinin [21.0341-20.9643 = 0.0698 Å], S-1-peridinin [20.7396-20.8416 = -0.102 Å] and S-2-peridinin [20.8058-20.8412 = -0.0354 Å], where first number listed is the excited state length and the second, the ground state length. Thus, a positive value indicates the chromophore expands in the excited state and a negative number means the chromophore contracts. The largest change involves a 0.5% contraction of -0.1 Å of the S-1-peridinin chromophore upon excitation. Test calculations in which the S-1-peridinin chromophore length was constrained by locking atoms 19 and 21 (Fig. 9) generated EOM-CCSD transition energies and oscillator strengths that were within 2% of the values reported in Fig. 7. These differences would not be observable in the time resolved spectra, but suggest that solvent reorganization will generate spectral broadening. Furthermore, the above reported changes in geometry will induce an energy barrier separating the Franck-Condon and relaxed excited states, particularly for the native peridinin chromophore.
Conclusions
The theoretical calculations provide a good perspective on why the S-2-peridinin chromophore does not form an ICT state. The primary reason is that the ground state dipole moment is smaller and directed nearly orthogonal to the long axis of the chromophore (Fig. 1B). This observation leads to a poorly prepared solvent field that does not provide the necessary electrostatic support for ICT state formation. Second, although the relaxed excited singlet state of S-2-peridinin has a dipole moment with an appropriate directional component, the magnitude is lower by 17 D than that generated by the relaxed excited singlet state of peridinin (Fig. 8). Thus, the S-2 chromophore is not capable of generating a sufficient reaction field to induce the strong “1Ag–” and “1Bu+” state mixing that yields the ICT state.
These data provide a rationale for the formation of the ICT state and the solvent-modulated effect on the excited state lifetime of peridinin. The critical factors are the magnitude and orientation of the ground and excited state dipole moments which must be of adequate size and in the right direction to induce sufficient mixing of excited state configurations for the formation of the ICT state that is unique to carbonyl-containing carotenoids and polyenes.
Supplementary Material
Acknowledgements
This work has been supported in the laboratory of HAF by a grant from the National Science Foundation (MCB-0913022) and by the University of Connecticut Research Foundation. The work in the laboratory of RRB was supported by grants from the National Science Foundation (EMT-0829916) and the National Institutes of Health (GM-34548). This work was supported in the laboratory of SK by a Grant-in-Aid for Scientific Research (C) 22550160 from the Ministry of Education, Culture, Sports, Science and Technology, and Matching Fund Subsidy for a Private University. TK is also grateful for receiving Grant-in-Aid for JSPS Fellows.
Footnotes
Supporting Information Available
Comparison of the ground states of the model compounds in methanol based on DFT (B3LYP/6-31G(d)) methods, EADS in the visible region, and transient absorption spectra and EADS in the NIR region. This material is available free of charge via the Internet at http://pubs.acs.org.
References
- 1.Pariser R. J. Chem. Phys. 1955;24:250–268. [Google Scholar]
- 2.Hudson B, Kohler B. Ann. Rev. Phys. Chem. 1974;25:437–460. [Google Scholar]
- 3.Callis PR, Scott TW, Albrecht AC. J. Chem. Phys. 1983;78:16–22. [Google Scholar]
- 4.Birge RR. Accts. Chem. Res. 1986;19:138–146. [Google Scholar]
- 5.Christensen RL, Barney EA, Broene RD, Galinato MGI, Frank HA. Arch. Biochem. Biophys. 2004;430:30–36. doi: 10.1016/j.abb.2004.02.026. [DOI] [PubMed] [Google Scholar]
- 6.Polívka T, Sundström V. Chem. Rev. 2004;104:2021–2071. doi: 10.1021/cr020674n. [DOI] [PubMed] [Google Scholar]
- 7.Polívka T, Frank HA. Acc. Chem. Res. 2010;43:1125–1134. doi: 10.1021/ar100030m. [DOI] [PMC free article] [PubMed] [Google Scholar]
- 8.Bautista JA, Connors RE, Raju BB, Hiller RG, Sharples FP, Gosztola D, Wasielewski MR, Frank HA. J. Phys. Chem. B. 1999;103:8751–8758. [Google Scholar]
- 9.Frank HA, Bautista JA, Josue J, Pendon Z, Hiller RG, Sharples FP, Gosztola D, Wasielewski MR. J. Phys. Chem. B. 2000;104:4569–4577. [Google Scholar]
- 10.Goodwin TW. The Biochemistry of the Carotenoids. 2 ed. Vol. 1. Chapman & Hall; London: 1980. [Google Scholar]
- 11.Liaaen-Jensen S. Carotenoids and Chemosystematics. In: Britton G, Liaaen-Jensen S, Pfander H, editors. Carotenoids. Vol. 3. Birkhäuser Verlag; Berlin: 1998. pp. 217–246. [Google Scholar]
- 12.Zigmantas D, Hiller RG, Yartsev A, Sundström V, Polivka T. J. Phys. Chem. B. 2003;107:5339–5348. [Google Scholar]
- 13.Vaswani HM, Hsu CP, Head-Gordon M, Fleming GR. J. Phys. Chem. B. 2003;107:7940–7946. [Google Scholar]
- 14.Zigmantas D, Polivka T, Hiller RG, Yartsev A, Sundström V. J. Phys. Chem. A. 2001;105:10296–10306. [Google Scholar]
- 15.Zigmantas D, Hiller RG, Sundström V, Polivka T. Proc. Natl. Acad. Sci. USA. 2002;99:16760–16765. doi: 10.1073/pnas.262537599. [DOI] [PMC free article] [PubMed] [Google Scholar]
- 16.Zigmantas D, Hiller RG, Sharples FP, Frank HA, Sundström V, Polivka T. Phys. Chem. Chem. Phys. 2004;6:3009–3016. [Google Scholar]
- 17.Herek JL, Wendling M, He Z, Polivka T, Garcia-Asua G, Cogdell RJ, Hunter CN, van Grondelle R, Sundström V, Pullerits T. J. Phys. Chem. B. 2004;108:10398–10403. [Google Scholar]
- 18.Papagiannakis E. Ph.D. Dissertation. Free University of Amsterdam; 2004. Shedding light on the dark states of carotenoids. [Google Scholar]
- 19.Wild DA, Winkler K, Stalke S, Oum K, Lenzer T. Phys. Chem. Chem. Phys. 2006;8:2499–2505. doi: 10.1039/b601669c. [DOI] [PubMed] [Google Scholar]
- 20.Stalke S, Wild DA, Lenzer T, Kopczynski M, Lohse PW, Oum K. Phys. Chem. Chem. Phys. 2008;10:2180–2188. doi: 10.1039/b720037d. [DOI] [PubMed] [Google Scholar]
- 21.Kopczynski M, Ehlers F, Lenzer T, Oum K. J. Phys. Chem. A. 2007;111:5370–5381. doi: 10.1021/jp0672252. [DOI] [PubMed] [Google Scholar]
- 22.Ehlers F, Wild DA, Lenzer T, Oum K. J. Phys. Chem. A. 2007;111:2257–2265. doi: 10.1021/jp0676888. [DOI] [PubMed] [Google Scholar]
- 23.Linden PA, Zimmermann J, Brixner T, Holt NE, Vaswani HM, Hiller RG, Fleming GR. J. Phys. Chem. B. 2004;108:10340–10345. [Google Scholar]
- 24.Papagiannakis E, Larsen DS, van Stokkum IHM, Vengris M, Hiller RG, van Grondelle R. Biochem. 2004;43:15303–15309. doi: 10.1021/bi047977r. [DOI] [PubMed] [Google Scholar]
- 25.Papagiannakis E, Vengris M, Larsen DS, van Stokkum IHM, Hiller RG, van Grondelle R. J. Phys. Chem. B. 2006;110:512–521. doi: 10.1021/jp053094d. [DOI] [PubMed] [Google Scholar]
- 26.Shima S, Ilagan RP, Gillespie N, Sommer BJ, Hiller RG, Sharples FP, Frank HA, Birge RR. J. Phys. Chem. A. 2003;107:8052–8066. [Google Scholar]
- 27.Chatterjee N, Niedzwiedzki DM, Kajikawa T, Hasegawa S, Katsumura S, Frank HA. Chem. Phys. Lett. 2008;463:219–224. doi: 10.1016/j.cplett.2008.08.056. [DOI] [PMC free article] [PubMed] [Google Scholar]
- 28.Niedzwiedzki DM, Chatterjee N, Enriquez MM, Kajikawa T, Hasegawa S, Katsumura S, Frank HA. J. Phys. Chem. B. 2009;113:13604–13612. doi: 10.1021/jp903923r. [DOI] [PMC free article] [PubMed] [Google Scholar]
- 29.Fuciman M, Enriquez MM, Kaligotla S, Niedzwiedzki DM, Kajikawa T, Aoki K, Katsumura S, Frank HA. J. Phys. Chem. B. 2011;115:4436–4445. doi: 10.1021/jp110092c. [DOI] [PubMed] [Google Scholar]
- 30.Ilagan RP, Koscielecki JF, Hiller RG, Sharples FP, Gibson GN, Birge RR, Frank HA. Biochem. 2006;45:14052–14063. doi: 10.1021/bi061217u. [DOI] [PubMed] [Google Scholar]
- 31.Foresman JB, Head-Gordon M, Pople JA, Frisch MJ. J. Phys. Chem. 1992;96:135–149. [Google Scholar]
- 32.Caricato M, Mennucci B, Scalmani G, Trucks GW, Frisch MJ. J. Chem. Phys. 2010;132:084102. doi: 10.1063/1.3314221. [DOI] [PubMed] [Google Scholar]
- 33.Fukuda R, Ehara M, Nakatsuji H, Cammi R. J. Chem. Phys. 2011;134:104109. doi: 10.1063/1.3562211. [DOI] [PubMed] [Google Scholar]
- 34.Marenich AV, Cramer CJ, Truhlar DG, Guido CA, Mennucci B, Scalmani G, Frisch M. J. Chem. Sci. 2011;2:2143–2161. [Google Scholar]
- 35.Frisch MJ, Trucks GW, Schlegel HB, Scuseria GE, Robb MA, Cheeseman JR, Scalmani G, Barone V, Mennucci B, Petersson GA, et al. Gaussian 09, Revision A.02. Gaussian, Inc.; Wallingford, CT: 2009. [Google Scholar]
- 36.Stanton JF, Bartlett RJ. J. Chem. Phys. 1993;98:7029–7039. [Google Scholar]
- 37.Koch H, Kobayashi R, Sánchez de Merás A, Jørgensen P. J. Chem. Phys. 1994;100:4393–4400. [Google Scholar]
- 38.Kállay M, Gauss J. J. Chem. Phys. 2004;121:9257–9269. doi: 10.1063/1.1805494. [DOI] [PubMed] [Google Scholar]
- 39.Nakatsuji H. Chem. Phys. Lett. 1991;177:331–337. [Google Scholar]
- 40.Ishida M, Toyota K, Ehara M, Frisch MJ, Nakatsuji H. J. Chem. Phys. 2004;120:2593–2605. doi: 10.1063/1.1637033. [DOI] [PubMed] [Google Scholar]
- 41.Nakajima T, Nakatsuji H. Chem. Phys. 1999;242:177–193. [Google Scholar]
- 42.Christensen RL, Goyette M, Gallagher L, Duncan J, DeCoster B, Lugtenburg J, Jansen FJ, Hoef I. v. d. J. Phys. Chem. A. 1999;103:2399–2407. [Google Scholar]
- 43.Christensen RL, Galinato MGI, Chu EF, Howard JN, Broene RD, Frank HA. J. Phys. Chem. A. 2008;112:12629–12636. doi: 10.1021/jp8060202. [DOI] [PMC free article] [PubMed] [Google Scholar]
- 44.Andersson PO, Bachilo SM, Chen R-L, Gillbro T. J. Phys. Chem. 1995;99:16199–16209. [Google Scholar]
- 45.Maiuri M, Polli D, Brida D, Lüer L, LaFountain AM, Fuciman M, Cogdell RJ, Frank HA, Cerullo G. Phys. Chem. Chem. Phys. 2012;14:6312–6319. doi: 10.1039/c2cp23585d. [DOI] [PubMed] [Google Scholar]
- 46.Polivka T, Kaligotla S, Chabera P, Frank HA. Phys. Chem. Chem. Phys. 2011;13:10787–10796. doi: 10.1039/c1cp20269c. [DOI] [PubMed] [Google Scholar]
- 47.Enriquez MM, Fuciman M, LaFountain AM, Wagner NL, Birge RR, Frank HA. J. Phys. Chem. B. 2010;114:12416–12426. doi: 10.1021/jp106113h. [DOI] [PMC free article] [PubMed] [Google Scholar]
- 48.Christensen RL, Kohler BE. Photochem. Photobiol. 1973;18:293–301. [Google Scholar]
- 49.Birge RR, Bocian DF, Hubbard LM. J. Am. Chem. Soc. 1982;104:1196–1207. [Google Scholar]
- 50.Englman R, Jortner J. Mol. Phys. 1970;18:145–164. [Google Scholar]
- 51.Chynwat V, Frank HA. Chem. Phys. 1995;194:237–244. [Google Scholar]
- 52.Wagner NL, Greco JA, Enriquez MM, Frank HA, Birge RR. J. Phys. Chem. B. 2012 submitted for publication. [Google Scholar]
Associated Data
This section collects any data citations, data availability statements, or supplementary materials included in this article.


