

Abstract
Minichromosome maintenance complex (MCM2-7) and Geminin are important in the prevention of DNA re-replication in the cell cycle, and are also prognostic markers for numerous human malignancies. The present study examined Minichromosome maintenance protein 7 (MCM7) and Geminin expression in human soft tissue sarcomas (STSs) to clarify their correlation to the clinicopathological factors. Immunohistochemistry was performed to detect the expression of MCM7, Geminin and Ki-67 on paraffin-embedded sections of 109 STSs. Labeling indices (LIs) of the molecules were evaluated in the tumors. Higher LIs of MCM7, Geminin and Ki-67 were significantly correlated with distant metastasis (P<0.01), histological grade (P<0.01) and poor prognosis (P<0.01), respectively. LIs of MCM7 and Geminin were significantly correlated with Ki-67 LIs, (MCM7/Ki-67: rs=0.745, P<0.01 and Geminin/Ki-67: rs=0.604, P<0.01). Multivariate analyses showed that the higher LIs of Geminin, but not MCM7 and Ki-67, were shown to be an independent factor of poorer prognosis (relative risk 2.72, P=0.013). The immunohistochemical expression of MCM7 and Geminin may be novel and useful markers for evaluating the prognosis in patients with human STS.
Keywords: Minichromosome maintenance protein 7, Geminin, Ki-67, soft tissue sarcoma, prognostic factor
Introduction
Soft tissue sarcomas (STSs) are heterogeneous malignant mesenchymal tumors, histologically classified based on morphological characteristics (1). STSs often display highly aggressive behavior with a tendency towards early metastasis. Although the same histological categories of STSs exist, various grades of malignancy with different prognosis are included (2). A variety of clinicopathological factors, such as tumor size, depth and histological grade, have been studied to predict the malignant potential of STSs (1–4). It is necessary to select the appropriate therapy for patients with STSs due to their different pathobiological behavior and prognostic significance. A number of prognostic or biological markers were studied in STSs and reported to be significant prognostic markers (5–19).
Minichromosome maintenance complex (MCM2-7) and Geminin are important in the prevention of DNA re-replication in the cell cycle. MCM proteins are expressed throughout the whole cell cycle, including cells that exit the G0 and enter the G1 phase (20). Geminin is present from G1-S transition to early M phases (21). Thus, MCM is the G0/G1/S/G2/M-phase marker and Geminin the S/G2/M-phase marker. MCM proteins are known to contribute to the regulation of transcription, chromatin remodeling and checkpoint responses. The activated MCM complex appears to play a key role in the DNA unwinding step, acting as a DNA helicase (22,23). Following the initiation of DNA replication during the cell cycle, Geminin inhibits the re-uploading of the MCM complex onto chromatin and prevents DNA re-replication in the same cell cycle (24–26).
MCM proteins were suggested as potential prognostic markers in a variety of human malignancies, including prostate and breast cancer and bronchial adenocarcinoma (19,27–34). Overexpression of Minichromosome maintenance protein 7 (MCM7) was reported to actively contribute to tumor formation, progression and malignant conversion. Moreover, MCM7 was considered a useful proliferation marker in colonic, prostate, endometrial and cervical cancers (30,31). In addition, Geminin is overexpressed in breast, colorectal and prostate cancers (33–38). However, the clinicopathological importance of MCM7 and Geminin expression in STSs has yet to be thoroughly investigated.
The present study examined MCM7 and Geminin expression levels in human STSs to clarify the correlation with the clinicopathological factors, in comparison with the proliferation marker, Ki-67 expression.
Materials and methods
Surgical specimens
A total of 109 patients with localized STSs were selected from the files of the Division of Organ Pathology, Faculty of Medicine, Tottori University and the affiliated teaching hospitals. Of the 109 patients, 106 were recruited following surgery and 3 following biopsy, during the period between 1981 and 2007. The clinical information was collected from the medical records regarding clinical presentation, age, gender, tumor location, tumor size, distant metastasis and pre-operative treatment.
Radiotherapy (30–50 Gy) was performed in 25 patients, chemotherapy in 27 and both in 13 patients, as a pre-operative treatment. Mean follow-up periods were 51.4 months (range 1–228).
All of the specimens were fixed in 10% buffered formalin and embedded in paraffin wax. Serial sections (4-μm) were stained using hematoxylin and eosin, and periodic acid-Schiff reaction. Immunohistochemistry was performed to detect immunoreactivity for α-smooth muscle actin, desmin, caldesmon, S-100 protein, vimentin, CD34 and epithelial membrane antigen. A histologic diagnosis was established according to the World Health Organization classification (39). Histological grades were assigned according to the French Federation of the Cancer Center Sarcoma Group (FNCLCC) system, based on necrosis, number of mitoses and the degree of tumor differentiation (40).
Immunohistochemistry
Immunohistochemistry was performed using a standard streptavidin-biotin-peroxidase complex technique (SAB method). Briefly, paraffin-embedded tumor tissue specimens were cut into 4-μm sections, dewaxed in xylene, rehydrated through a graded series of ethanol solution and rinsed in distilled water for 5 min. Tissue sections were retrieved using a microwave (MI-77; Azumaya, Tokyo, Japan) in citrate buffer (0.01 M, pH 6.0) at 95°C for 20 min. After cooling to room temperature, endogenous peroxidase activity was blocked by incubation with 0.6% hydrogen peroxide in methanol for 30 min. After rinsing with phosphate-buffered saline, the sections were incubated with blocking serum (2% fetal bovine serum) at room temperature for 20 min and incubated at 4°C overnight, with the primary antibody as follows: mouse anti-MCM7 antibody (diluted 1:100; Santa Cruz Biotechnology, Santa Cruz, CA, USA); rabbit anti-Geminin antibody (diluted 1:100; Santa Cruz Biotechnology); and mouse anti-Ki-67 antibody (MIB-1, diluted 1:50; Dako, Glostrup, Denmark). Incubation with biotinylated anti-mouse IgG (Nichirei, Tokyo, Japan) for MCM7 and Ki-67, and the secondary antibody, anti-rabbit IgG (Nichirei) for Geminin, was carried out for 30 min, followed by incubation with a streptavidin biotinylated-HRP complex for 30 min. The immunoreaction was visualized with 3,3′-diaminobenzidine and 100 μl hydrogen peroxide in 0.05 M Tris-HCl buffer (pH 7.6). Finally, the sections were counterstained with hematoxylin.
Evaluation of immunohistochemical findings
To evaluate MCM7, Geminin and Ki-67 expression levels, positive tumor cell nuclei were captured by CCD camera in the most distinctly labeled area. Subsequently, counts were performed in high-magnification fields using the FLOVEL Image Filing System FlvFs (FLOVEL Inc., Tachikawa, Japan). The percentage of positive cells was determined for each antibody by two authors who were unaware of the clinicopathological variables. At least 1,000 tumor cells for MCM7, Geminin and Ki-67 were counted. The labeling indices (LIs) were determined by counting the number of positive cells (expressed as a percentage). MCM7, Geminin and Ki-67 LIs in the 109 STSs were classified as high expression if they were equal to or more than median LIs. To confirm the specificity of the immunostaining results, sections that immunoreacted without the primary antibodies were used as negative controls.
Statistical analysis
Statistical analysis was performed using Excel 2003 (Microsoft, USA) with the add-in software StatView version program 5.0 (Abacus Concept, USA). The correlation between MCM7 and Geminin LIs and Ki-67 LI was calculated using the Spearman rank order correlation test. The Mann-Whitney U test was used when the categorical variables of interest were two and the Kruskal-Wallis test was used when the variables were three or more. Survival curves were calculated using the Kaplan-Meier method. Univariate analysis was performed using the log-rank test and multivariate analysis was performed using a Cox proportional hazards regression model in a stepwise manner. Hazard ratios were reported with 95% confidence intervals (CI). P<0.05 was considered to be statistically significant.
Results
Table I shows the characteristics of the 109 patients with STSs. There were 67 men and 42 women with a mean age of 55.8 years (range 0.1–93). The tumors were located in the extremities in 90 patients and in the trunk in 19 patients. Tumors were >5 cm in 77 patients and <5 cm in 32 patients. The distant metastases were absent in 68 patients and present in 41 patients. Histological grades 1, 2 and 3 were identified in 27, 51 and 31 cases, respectively. The tumors consisted of 40 leiomyosarcomas, 34 liposarcomas, 18 synovial sarcomas, 5 myxofibrosarcomas, 5 epithelioid sarcomas, 4 malignant fibrous histiocytomas (MFH)/undifferentiated pleomorphic sarcomas (UPS) and 3 rhabdomyosarcomas.
Table I.
Correlation between LIs for MCM7, Geminin and Ki-67, and clinicopathological profiles.
| Variables | No. | MCM7 LIs | P-value | Geminin LIs | P-value | Ki-67 LIs | P-value |
|---|---|---|---|---|---|---|---|
| All patients | 109 | 17.4±15.7 | 7.45±8.51 | 14.2±14.9 | |||
| Age (mean 55.8 years) | NS | NS | NS | ||||
| ≥55.8 | 56 | 20.4 | 8.14 | 16.5 | |||
| <55.8 | 53 | 15.0 | 6.71 | 11.9 | |||
| Gender | NS | NS | NS | ||||
| Male | 67 | 17.1 | 7.24 | 14.6 | |||
| Female | 42 | 18.8 | 8.24 | 14.2 | |||
| Tumor location | NS | NS | NS | ||||
| Extremity | 90 | 18.6 | 7.58 | 14.8 | |||
| Trunk | 19 | 13.9 | 6.81 | 11.7 | |||
| Tumor size | NS | NS | NS | ||||
| ≥5 cm | 77 | 18.0 | 7.80 | 14.4 | |||
| <5 cm | 32 | 17.2 | 6.59 | 13.8 | |||
| Distant metastasis | <0.01 | <0.01 | <0.01 | ||||
| Absent | 68 | 11.5 | 4.71 | 8.64 | |||
| Present | 41 | 28.2 | 12.00 | 23.5 | |||
| Histological gradea | <0.01 | <0.01 | <0.01 | ||||
| 1 | 27 | 5.37 | 1.18 | 2.05 | |||
| 2 | 51 | 17.1 | 7.69 | 14.8 | |||
| 3 | 31 | 29.7 | 12.50 | 23.9 | |||
| Histologic type | |||||||
| Leiomyosarcoma | 40 | 24.6 | 10.20 | 21.5 | |||
| Liposarcoma | 34 | 6.6 | 1.74 | 4.35 | |||
| Well-differentiated | 16 | ||||||
| Myxoid | 13 | ||||||
| Pleomorphic | 2 | ||||||
| Dedifferentiated | 1 | ||||||
| Round cell | 1 | ||||||
| Synovial sarcoma | 18 | 28.2 | 12.10 | 16.5 | |||
| Monophasic | 8 | ||||||
| Biphasic | 10 | ||||||
| Epithelioid sarcoma | 5 | 11.2 | 8.24 | 18.3 | |||
| Myxofibrosarcoma | 5 | 12.8 | 7.90 | 14.4 | |||
| MFH/UPS | 4 | 12.1 | 3.45 | 11.5 | |||
| Pleomorphic | 3 | ||||||
| Inflammatory | 1 | ||||||
| Rhabdomyosarcoma | 3 | 18.1 | 11.10 | 13.7 | |||
| Alveolar | 2 | ||||||
| Embryonal | 1 | ||||||
LIs, labeling indices (%);
FNCLCC grade;
NS, not significant; MFH/UPS, malignant fibrous histiocytoma/undifferentiated pleomorphic sarcoma.
MCM7 and Geminin expression was observed in all STSs examined. Their immunoreactivity was noted in the nuclei of the tumor cells, as shown in Fig. 1. Table I shows the association of MCM7, Geminin and Ki-67 LIs with the clinicopathological factors of the 109 patients with STSs. Mean LIs of MCM7, Geminin and Ki-67 were 17.4±15.7, 7.45±8.51 and 14.2±14.9%, respectively. The LIs were highest for MCM7, followed by Ki-67 and Geminin. Significant correlations were noted between the LIs of the three molecules and distant metastasis (P<0.01) or histological grade (P<0.01), respectively. On the other hand, no correlation was observed between the LIs and the remaining clinicopathological factors, including age, gender, tumor location or tumor size. Among the histologic type, MCM7 and Geminin LIs were highest in synovial sarcoma, followed by leiomyosarcoma. MCM7 LIs were higher than Ki-67 LIs in all histologic types of tumors, except for myxofibrosarcoma and epithelioid sarcoma. On the other hand, Geminin LIs were lower than Ki-67 LIs in all histologic types of tumors.
Figure 1.
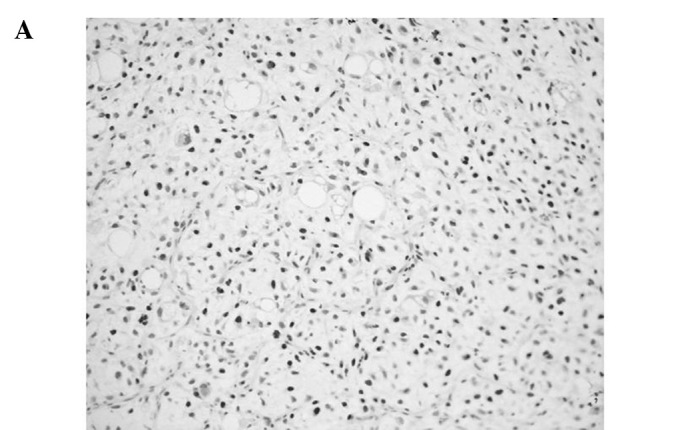
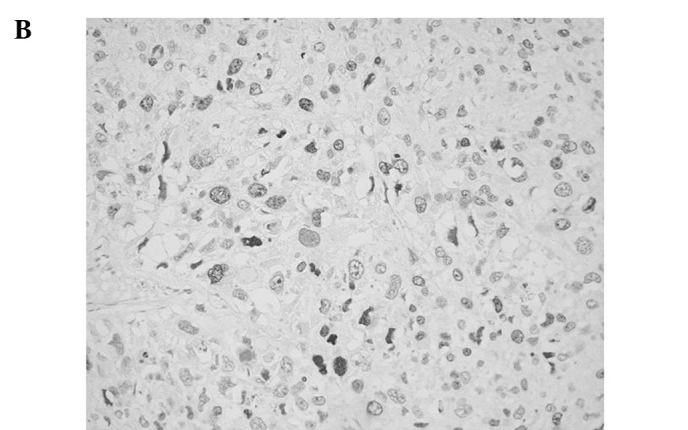
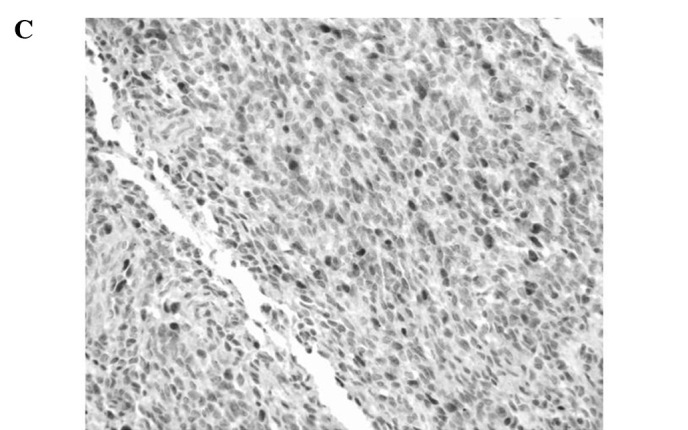
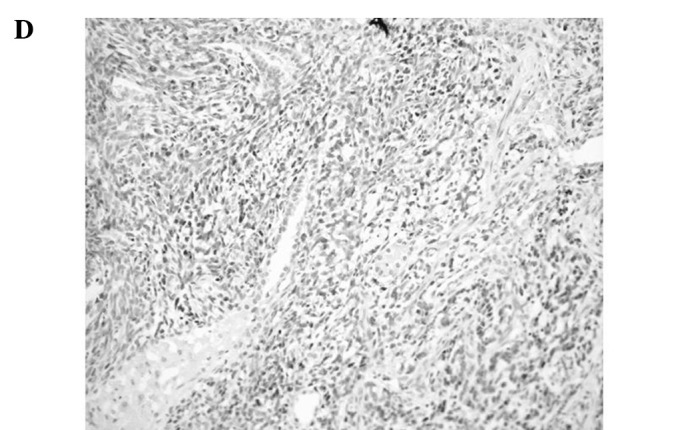
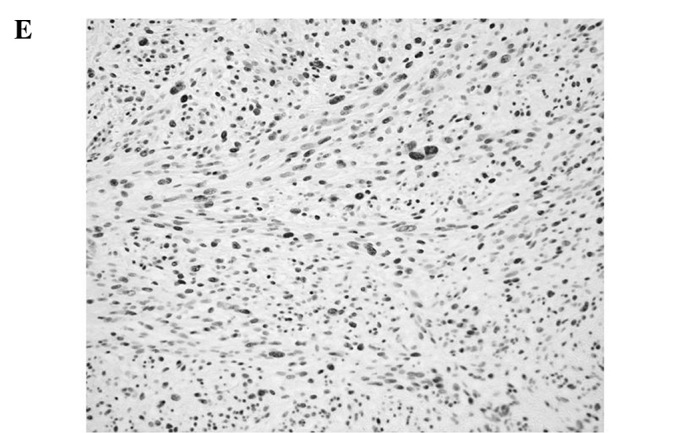
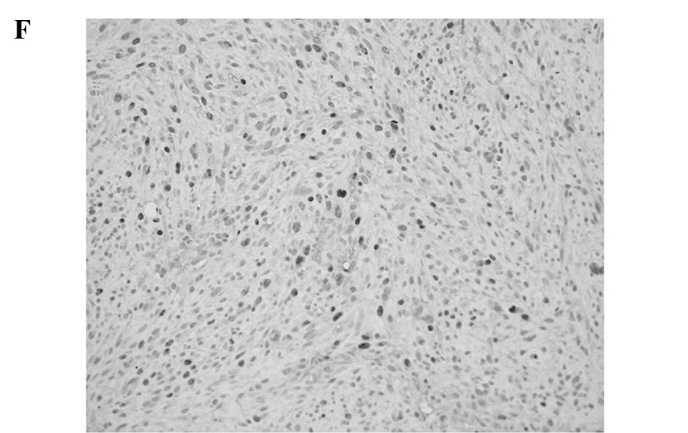
Representative immunoreactivities for MCM7 and Geminin in soft tissue sarcomas (STSs). (A and B) MCM7 and Geminin in liposarcoma, respectively. (C and D) MCM7 and Geminin in synovial sarcoma, respectively. (E and F) MCM7 and Geminin in leiomyosarcoma, respectively.
A positive linear correlation was found between MCM7 and Ki-67 in the analyzed samples (Fig. 2A), as well as between Geminin and Ki-67 (Fig. 2B), with Spearman’s correlation coefficients of rs=0.745 (P<0.01) and rs=0.604 (P<0.01), respectively.
Figure 2.
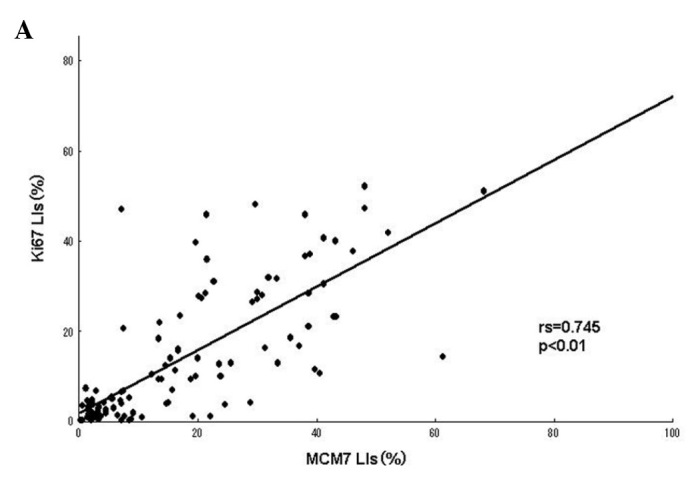
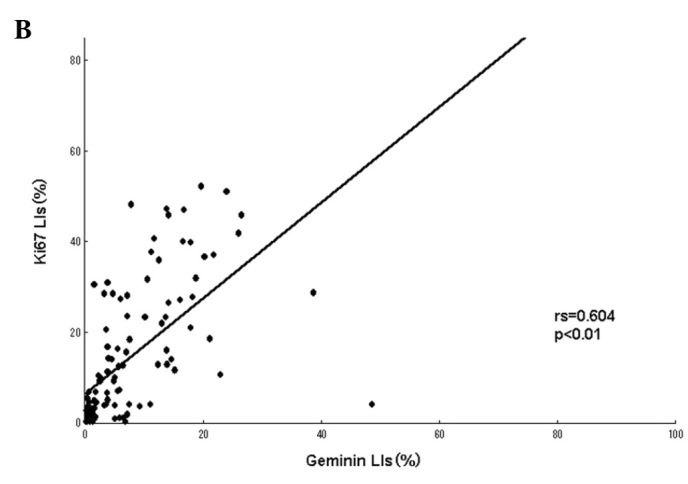
(A) Correlation between MCM7 and Ki-67 labeling indices (LIs) in the 109 soft tissue sarcomas (STSs). A significant positive correlation was noted between MCM7 and Ki-67 LIs (rs=0.745, P<0.01). (B) Correlation between Geminin and Ki-67 LIs in the 109 STSs. A significant positive correlation was found between Geminin and Ki-67 LIs (rs=0.604, P<0.01).
Fig. 3 shows the Kaplan-Meier survival curves for MCM7 and Geminin LIs in patients with 109 STSs. The patients were classified into higher and lower LIs, which were divided by the median LIs. A significantly poorer prognosis was found in patients with higher LIs for MCM7 (>17.4%), Geminin (>7.45%) and Ki-67 LIs (>14.2%) compared to patients with lower LIs (P<0.01), respectively (Fig. 3A and B).
Figure 3.
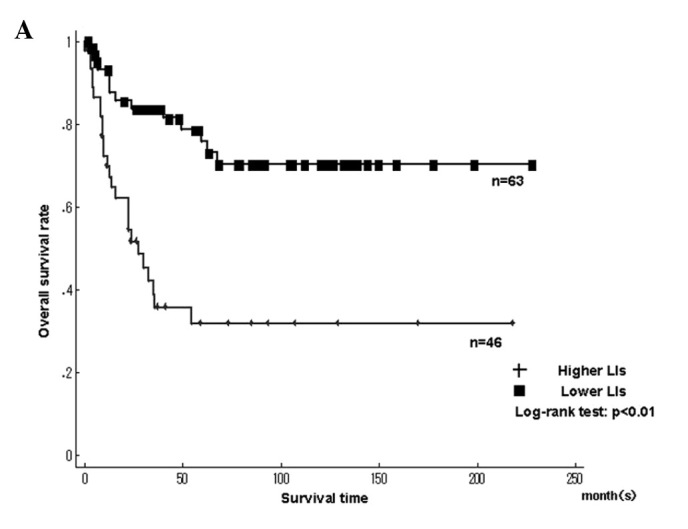
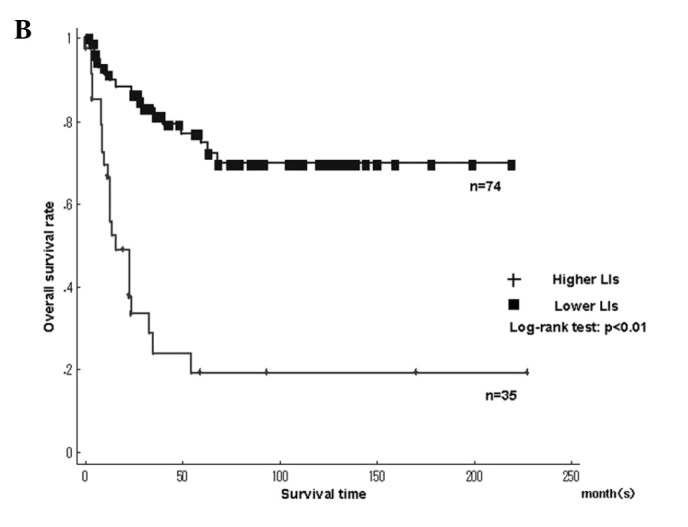
Kaplan-Meier survival curves for (A) MCM7 and (B) Geminin labeling indices (LIs) in the 109 soft tissue sarcomas (STSs). Patients with higher LIs of MCM7 and Geminin showed significantly poorer prognosis.
Fig. 4 shows the Kaplan-Meier survival curves for MCM7 and Geminin LIs in the leiomyosarcomas. Among the histologic types, the overall survival rate was significantly worse in leiomyosarcomas with higher LIs of MCM7 and Geminin than in those with lower LIs (MCM7, P<0.01; Geminin, P<0.01)(Fig. 4A and B). The overall survival rate was significantly worse in liposarcomas with higher LIs of Ki-67 than in those with lower LIs (Ki-67, P=0.02). On the other hand, the overall survival for Ki-67 LIs in leiomyosarcomas, MCM7 and Geminin LIs in liposarcomas, as well as MCM7, Geminin and Ki-67 LIs in synovial sarcomas did not show significant differences between higher and lower LIs. Survival with myxofibrosarcoma, epithelioid sarcoma, MFH/UPS and rhabdomyosarcoma was not determined, since the small number of cases did not enable the required statistical analysis.
Figure 4.
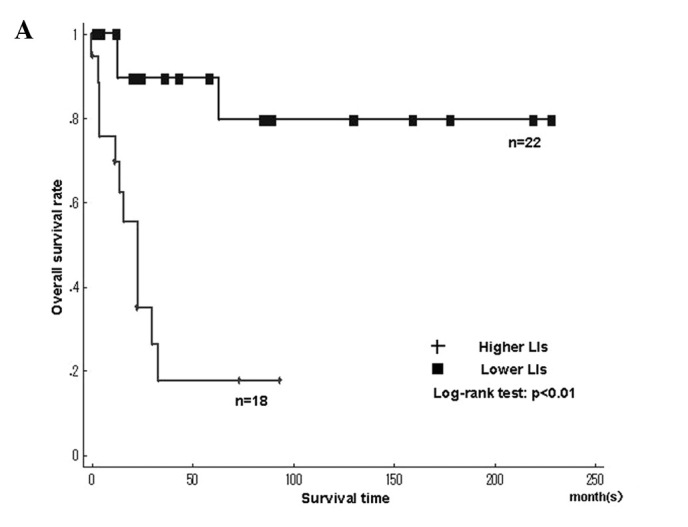
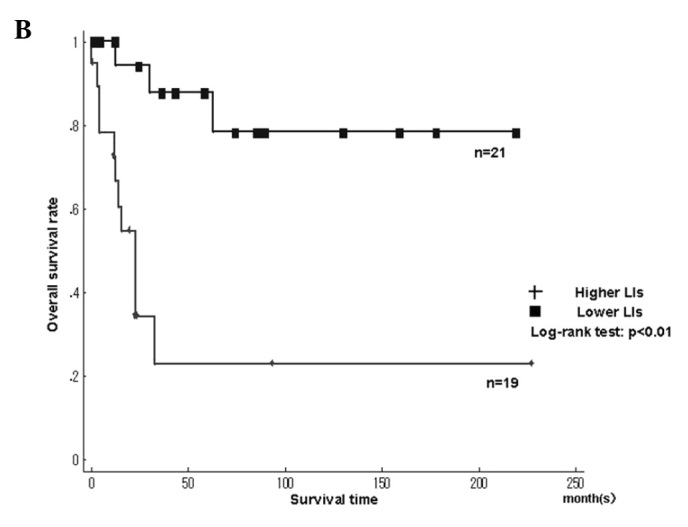
Kaplan-Meier survival curves for MCM7 and Geminin labeling indices (LIs) in individual histologic types. (A and B) MCM7 and Geminin in leiomyosarcoma, respectively.
We performed univariate Cox regression analyses to evaluate the contributions of potential prognostic markers to overall survival (Table II). Overall survival was significantly correlated with higher LIs for MCM7 (relative risk (RR)=3.70; 95% CI 1.92–7.16; P<0.01), higher LIs for Geminin (RR=5.25; 95% CI 2.75–10.0; P<0.01) and higher LIs for Ki-67 (RR=3.16; 95% CI 1.68–5.95; P<0.01). Patients with distant metastasis (RR=14.7; 95% CI 6.10–35.4; P<0.01) and histological grade (grade 1 vs. 2: RR=3.38, 95% CI 0.99–11.6, P=0.052 and grade 1 vs. 3: RR=7.75, 95% CI 2.29–26.2, P<0.01) were also significantly correlated with the overall survival rate, respectively.
Table II.
Univariate and multivariate analysis of clinicopathological factors for overall survival.
| Relative risk | 95% CI | P-value | |
|---|---|---|---|
| Univariate analysis | |||
| MCM7 LIs | |||
| <17.4% | 1 | - | - |
| >17.4% | 3.70 | 1.92–7.16 | <0.01 |
| Geminin LIs | |||
| <7.45% | 1 | - | - |
| >7.45% | 5.25 | 2.75–10.0 | <0.01 |
| Ki-67 LIs | |||
| <14.2% | 1 | - | - |
| >14.2% | 3.16 | 1.68–5.95 | <0.01 |
| Distant metastasis | |||
| Absent | 1 | - | - |
| Present | 14.7 | 6.10–35.4 | <0.01 |
| Histological gradea | |||
| 1 | 1 | - | - |
| 2 | 3.38 | 0.99–11.6 | 0.05 |
| 3 | 7.75 | 2.29–26.2 | <0.01 |
| Multivariate analysis | |||
| Geminin LIs | |||
| <7.45% | 1 | - | - |
| >7.45% | 2.72 | 1.23–5.99 | 0.01 |
LIs, labeling indices (%);
FNCLCC grade.
The Cox proportional hazards regression model was conducted, adjusting for age (≥55.8 or <55.8 years), gender (male or female), tumor location (extremity or trunk), tumor size (≥5 or <5 cm), histological grade (1, 2 or 3), MCM7 LIs (higher or lower), Geminin LIs (higher or lower) and Ki-67 LIs (higher or lower). Distant metastasis (absent or present) was excluded, since it was not present at diagnosis, but developed during the follow-up. In multivariate analyses, higher LIs of Geminin (RR=2.72, 95% CI 1.23–5.99, P=0.013), but not of MCM7 (RR=1.64, 95% CI 0.678–3.990, P=0.27), Ki-67 (RR=1.02, 95% CI 0.440–2.347, P=0.97) and histological grade (RR=2.07, 95% CI 0.555–7.734, P=0.28), were identified as independent prognostic factors of poor prognosis in the 109 STSs (Table II).
Discussion
STSs are relatively rare but aggressive tumors, representing 1% of adult and 15% of pediatric malignancies. Although the prognosis of patients with STSs has improved, a subset of STSs shows an aggressive clinical course and results in tumor-related mortality (1,2). Therefore, a number of studies have been designed to investigate the prognostic factors of STSs, such as Ki-67, p53, cyclin D1, EGFR, cyclin A, CD40, CD44, VEGF, EZH2, FOXO1, c-Myc, osteopontin, Bcl-2, ERBB2, KIT, IGF-1R and MCM2, since they may aid in determining the course of adjuvant therapy and the length of follow-up (5–19). The present study shows the prognostic significance of MCM7, Geminin and Ki-67, using immunohistochemical methods in 109 STSs.
MCM proteins were reported to be correlated with the histologic grade in other types of cancer, including prostate cancer, lung adenocarcinoma and renal cell carcinoma (27–34). We previously reported the positive relation between the expression of MCM2 and the prognosis of patients with human malignant fibrous histiocytoma (19). The trimeric complex of MCM4, MCM6 and MCM7 was found to possess DNA helicase activity in an in vitro study. This complex also interacts with and is regulated by another trimeric complex, comprising MCM2, MCM3 and MCM5, to form a hexameric complex. Furthermore, MCM7 is the only family member whose promoter contains an E-box sequence, which is the binding site for members of the MYC transcription factor family. MCM7 is also a direct target of MYCC and MYCN (31,41,42). Therefore, we focused on the significance of MCM7 expression in STSs.
Geminin is a protein that blocks re-replication of the gene in the same cycle. It is present in S, G2 and M phases of the cell cycle, but absent in the G1 phase (20,21). Numerous previous studies examined the effect of Geminin expression on the overall survival of patients with breast, colorectal and prostatic cancers and showed that a higher expression of Geminin was a poor prognostic marker in patients with these types of cancer (33–35,37,38). On the other hand, Shrestha et al found that the relationship between Geminin expression and survival in patients with high-grade astrocytic tumors contradicted the previous findings (36), and that the overexpression of Geminin was associated with a longer survival of patients with high-grade astrocytic tumors. These contradictory results may partially explain why the overexpression of Geminin may increase radiosensitivity, leading to a better prognosis after radiotherapy, even though the Geminin expression is elevated with increasing tumor grade. However, direct evidence for this increasing sensitivity has yet to be presented (36). In the present study, a higher Geminin LI was a significant poor prognostic marker in patients with STSs, but the small number of cases with pre-operative radiotherapy did not enable confirmation of the relationship between Geminin LIs and radiosensitivity.
Gerdes et al first reported that the Ki-67 antigen was a nuclear protein associated with cellular proliferation (43). Ki-67 was present throughout the complete cell cycle, except for the early G1 phase, which is associated with poor prognosis of the disease (43–45). A Ki-67 LI was correlated with the poor prognosis of patients with several malignancies (28,34,43). Ki-67 has been used as a common and valuable prognostic marker in STSs (8,9,44,45). We also showed that MCM7 and Geminin LIs are positively correlated with Ki-67 LIs.
The survival rate in the 109 patients calculated by Kaplan-Meier analysis showed significant correlations between patient prognosis and the LIs of MCM7, Geminin and Ki-67. As a result, higher LIs of these markers were negative prognostic factors in the 109 STSs. The survival rate demonstrated a significant correlation between patient prognosis and MCM7 and Geminin LIs in leiomyosarcomas, and between patient prognosis and Ki-67 LIs in liposarcomas. On the other hand, the survival rates in other histologic types were not confirmed in this study due to the small number of cases. The results suggest that MCM7 and Geminin in STSs, as well as Ki-67, are useful prognostic markers.
Furthermore, multivariate analyses revealed that higher Geminin LIs, but not higher those of MCM7 and Ki-67, were independent prognostic factors for survival in the 109 STSs. Our data suggest that Geminin LIs are a more useful prognostic marker than those of MCM7 and Ki-67 in STSs.
Acknowledgements
We thank Mr. N. Itaki, Ms. T. Yamasaki and Ms. M. Iwatani for the excellent technical assistance.
References
- 1.Stefanovski PD, Bidoli E, De Paoli A, et al. Prognostic factors in soft tissue sarcomas: a study of 395 patients. Eur J Surg Oncol. 2002;28:153–164. doi: 10.1053/ejso.2001.1242. [DOI] [PubMed] [Google Scholar]
- 2.Tomita Y, Aozasa K, Myoui A, et al. Histologic grading in soft-tissue sarcomas – an analysis of 194 cases including agnor count and mast-cell count. Int J Cancer. 1993;54:194–199. doi: 10.1002/ijc.2910540206. [DOI] [PubMed] [Google Scholar]
- 3.Levine EA. Prognostic factors in soft tissue sarcoma. Semin Surg Oncol. 1999;17:23–32. doi: 10.1002/(sici)1098-2388(199907/08)17:1<23::aid-ssu4>3.0.co;2-r. [DOI] [PubMed] [Google Scholar]
- 4.Engellau J, Bendahl PO, Persson A, et al. Improved prognostication in soft tissue sarcoma: independent information from vascular invasion, necrosis, growth pattern, and immunostaining using whole-tumor sections and tissue microarrays. Hum Pathol. 2005;36:994–1002. doi: 10.1016/j.humpath.2005.07.008. [DOI] [PubMed] [Google Scholar]
- 5.Ahlen J, Wejde J, Brosjo O, et al. Insulin-like growth factor type 1 receptor expression correlates to good prognosis in highly malignant soft tissue sarcoma. Clin Cancer Res. 2005;11:206–216. [PubMed] [Google Scholar]
- 6.Bramwell VHC, Tuck AB, Wilson SM, et al. Expression of osteopontin and HGF/Met in adult soft tissue tumors. Cancer Biology and Therapy. 2005;4:1336–1341. doi: 10.4161/cbt.4.12.2166. [DOI] [PubMed] [Google Scholar]
- 7.Huuhtanen RL, Blomqvist CP, Bohling TO, et al. Expression of cyclin A in soft tissue sarcomas correlates with tumor aggressiveness. Cancer Res. 1999;59:2885–2890. [PubMed] [Google Scholar]
- 8.Jensen V, Sorensen FB, Bentzen SM, et al. Proliferative activity (MIB-1 index) is an independent prognostic parameter in patients with high-grade soft tissue sarcomas of subtypes other than malignant fibrous histiocytomas: a retrospective immunohistological study including 216 soft tissue sarcomas. Histopathology. 1998;32:536–546. [PubMed] [Google Scholar]
- 9.Lopes JM, Nesland JM, Reis JS, Holm R. Differential Ki67 and bcl-2 immunoexpression in solid-glandular and spindle cell components of biphasic synovial sarcoma: a double immunostaining assessment with cytokeratin and vimentin. Histopathology. 2002;40:464–471. doi: 10.1046/j.1365-2559.2002.01371.x. [DOI] [PubMed] [Google Scholar]
- 10.Oda Y, Tateishi N, Matono H, et al. Chemokine receptor CXCR4 expression is correlated with VEGF expression and poor survival in soft-tissue sarcoma. Int J Cancer. 2009;124:1852–1859. doi: 10.1002/ijc.24128. [DOI] [PubMed] [Google Scholar]
- 11.Ottaiano A, De Chiara A, Perrone F, et al. Prognostic value of CD40 in adult soft tissue sarcomas. Clin Cancer Res. 2004;10:2824–2831. doi: 10.1158/1078-0432.ccr-0139-03. [DOI] [PubMed] [Google Scholar]
- 12.Peiper M, Sato T, Zurakowski D, et al. CD44s expression is associated with improved survival in soft tissue sarcoma. Anticancer Res. 2004;24:1053–1056. [PubMed] [Google Scholar]
- 13.Sato O, Wada T, Kawai A, et al. Expression of epidermal growth factor receptor, ERBB2 and KIT in adult soft tissue sarcomas – a clinicopathologic study of 281 cases. Cancer. 2005;103:1881–1890. doi: 10.1002/cncr.20986. [DOI] [PubMed] [Google Scholar]
- 14.Tsiatis AC, Herceg ME, Keedy VL, et al. Prognostic significance of c-Myc expression in soft tissue leiomyosarcoma. Mod Pathol. 2009;22:1432–1438. doi: 10.1038/modpathol.2009.113. [DOI] [PubMed] [Google Scholar]
- 15.Vesely K, Jurajda M, Nenutil R, Vesela M. Expression of p53, cyclin D1 and EGFR correlates with histological grade of adult soft tissue sarcomas: a study on tissue microarrays. Neoplasma. 2009;56:239–244. doi: 10.4149/neo_2009_03_239. [DOI] [PubMed] [Google Scholar]
- 16.Yamaga K, Osaki M, Kidani K, Shomori K, Yoshida H, Ito H. High expression of enhancer of zeste homologue 2 indicates poor prognosis in patients with soft tissue sarcomas. Mol Med Rep. 2008;1:633–639. doi: 10.3892/mmr_00000004. [DOI] [PubMed] [Google Scholar]
- 17.Yudoh K, Kanamori N, Ohmori K, Yasuda T, Aoki M, Kimura T. Concentration of vascular endothelial growth factor in the tumour tissue as a prognostic factor of soft tissue sarcomas. Br J Cancer. 2001;84:1610–1615. doi: 10.1054/bjoc.2001.1837. [DOI] [PMC free article] [PubMed] [Google Scholar]
- 18.Zhang B, Tomita Y, Ch’ng E, et al. Prognostic significance of phosphorylated FOXO1 expression in soft tissue sarcoma. Ann Surg Oncol. 2009;16:1925–1937. doi: 10.1245/s10434-009-0481-x. [DOI] [PubMed] [Google Scholar]
- 19.Osaki M, Yamashita H, Shomori K, Yoshida H, Ito H. Expression of minichromosome maintenance-2 in human malignant fibrous histiocytomas: Correlations with Ki-67 and P53 expression and apoptosis. Int J Mol Med. 2002;10:161–168. [PubMed] [Google Scholar]
- 20.Lindner K, Gregan J, Montgomery S, Kearsey SE. Essential role of MCM proteins in premeiotic DNA replication. Mol Biol Cell. 2002;13:435–444. doi: 10.1091/mbc.01-11-0537. [DOI] [PMC free article] [PubMed] [Google Scholar]
- 21.Nishitani H, Lygerou Z. Control of DNA replication licensing in a cell cycle. Genes to Cells. 2002;7:523–534. doi: 10.1046/j.1365-2443.2002.00544.x. [DOI] [PubMed] [Google Scholar]
- 22.Ishimi Y. A DNA helicase activity is associated with an MCM4, -6 and -7 protein complex. J Biol Chem. 1997;272:24508–24513. doi: 10.1074/jbc.272.39.24508. [DOI] [PubMed] [Google Scholar]
- 23.Forsburg SL. Eukaryotic MCM proteins: beyond replication initiation. Microbiol Mol Biol Rev. 2004;68:109–131. doi: 10.1128/MMBR.68.1.109-131.2004. [DOI] [PMC free article] [PubMed] [Google Scholar]
- 24.McGarry TJ, Kirschner MW. Geminin, an inhibitor of DNA replication, is degraded during mitosis. Cell. 1998;93:1043–1053. doi: 10.1016/s0092-8674(00)81209-x. [DOI] [PubMed] [Google Scholar]
- 25.Lygerou Z, Nurse P. Cell cycle. License withheld – Geminin blocks DNA replication. Science. 2000;290:2271–2273. doi: 10.1126/science.290.5500.2271. [DOI] [PubMed] [Google Scholar]
- 26.Wohlschlegel JA, Kutok JL, Weng AP, Dutta A. Expression of geminin as a marker of cell proliferation in normal tissues and malignancies. Am J Pathol. 2002;161:267–273. doi: 10.1016/S0002-9440(10)64178-8. [DOI] [PMC free article] [PubMed] [Google Scholar]
- 27.Gonzalez MA, Pinder SE, Callagy G, et al. Minichromosome maintenance protein 2 is a strong independent prognostic marker in breast cancer. J Clin Oncol. 2003;21:4306–4313. doi: 10.1200/JCO.2003.04.121. [DOI] [PubMed] [Google Scholar]
- 28.Hashimoto K, Araki K, Osaki M, et al. MCM2 and Ki-67 expression in human lung adenocarcinoma: prognostic implications. Pathobiology. 2004;71:193–200. doi: 10.1159/000078673. [DOI] [PubMed] [Google Scholar]
- 29.Nariculam J, Loddo M, Masters J, Williams G, Feneley M. MCM-2 expression in clinically localised prostate cancer. Eur Urol Suppl. 2008;7:738. [Google Scholar]
- 30.Padmanabhan V, Callas P, Philips G, Trainer TD, Beatty BG. DNA replication regulation protein MCM7 as a marker of proliferation in prostate cancer. J Clin Pathol. 2004;57:1057–1062. doi: 10.1136/jcp.2004.016436. [DOI] [PMC free article] [PubMed] [Google Scholar]
- 31.Nishihara K, Shomori K, Fujioka S, et al. Minichromosome maintenance protein 7 in colorectal cancer: Implication of prognostic significance. Int J Oncol. 2008;33:245–251. [PubMed] [Google Scholar]
- 32.Shimizu M, Nikaido T, Kato K, et al. Expression of replication-licensing factors MCM2 and MCM3 in normal endometrium and endometrial carcinomas. 9th International Menopause Society World Congress on the Menopause; 1999. pp. 159–162. [Google Scholar]
- 33.Torres-Rendon A, Roy S, Craig GT, Speight PM. Expression of MCM2, geminin and Ki67 in normal oral mucosa, oral epithelial dysplasias and their corresponding squamous-cell carcinomas. Br J Cancer. 2009;100:1128–1134. doi: 10.1038/sj.bjc.6604967. [DOI] [PMC free article] [PubMed] [Google Scholar]
- 34.Vargas PA, Cheng Y, Barrett AW, Craig GT, Speight PM. Expression of Mcm-2, Ki-67 and geminin in benign and malignant salivary gland tumours. J Oral Pathol Med. 2008;37:309–318. doi: 10.1111/j.1600-0714.2007.00631.x. [DOI] [PubMed] [Google Scholar]
- 35.Salabat MR, Melstrom LG, Strouch MJ, et al. Geminin is overexpressed in human pancreatic cancer and downregulated by the bioflavanoid apigenin in pancreatic cancer cell lines. Mol Carcinogen. 2008;47:835–844. doi: 10.1002/mc.20441. [DOI] [PubMed] [Google Scholar]
- 36.Shrestha P, Saito T, Hama S, et al. Geminin: a good prognostic factor in high-grade astrocytic brain tumors. Cancer. 2007;109:949–956. doi: 10.1002/cncr.22474. [DOI] [PubMed] [Google Scholar]
- 37.Nishihara K, Shomori K, Tamura T, Fujioka S, Ogawa T, Ito H. Immunohistochemical expression of geminin in colorectal cancer: Implication of prognostic significance. Oncol Rep. 2009;21:1189–1195. doi: 10.3892/or_00000340. [DOI] [PubMed] [Google Scholar]
- 38.Gonzalez MA, Tachibana KK, Chin SF, et al. Geminin predicts adverse clinical outcome in breast cancer by reflecting cell-cycle progression. J Pathol. 2004;204:121–130. doi: 10.1002/path.1625. [DOI] [PubMed] [Google Scholar]
- 39.Fletcher CDM, Unni KK, Mertens F. Pathology and Genetics of Tumours of Soft tissue and Bone. IARC Press; Lyon: 2002. World Health Organization Classification of Tumours. [Google Scholar]
- 40.Guillou L, Coindre JM, Bonichon F, et al. Comparative study of the National Cancer Institute and French Federation of Cancer Centers Sarcoma Group grading systems in a population of 410 adult patients with soft tissue sarcoma. J Clin Oncol. 1997;15:350–362. doi: 10.1200/JCO.1997.15.1.350. [DOI] [PubMed] [Google Scholar]
- 41.Eisenman RN. Deconstructing Myc. Genes Dev. 2001;15:2023–2030. doi: 10.1101/gad928101. [DOI] [PubMed] [Google Scholar]
- 42.Shohet JM, Hicks MJ, Plon SE, et al. Minichromosome maintenance protein MCM7 is a direct target of the MYCN transcription factor in neuroblastoma. Cancer Res. 2002;62:1123–1128. [PubMed] [Google Scholar]
- 43.Gerdes J, Lemke H, Baisch H, Wacker HH, Schwab U, Stein H. Cell-cycle analysis of a cell proliferation-associated human nuclear antigen defined by the monoclonal-antibody Ki-67. J Immunol. 1984;133:1710–1715. [PubMed] [Google Scholar]
- 44.Hoos A, Stojadinovic A, Mastorides S, et al. High Ki-67 proliferative index predicts disease specific survival in patients with high-risk soft tissue sarcomas. Cancer. 2001;92:869–874. doi: 10.1002/1097-0142(20010815)92:4<869::aid-cncr1395>3.0.co;2-u. [DOI] [PubMed] [Google Scholar]
- 45.Hasegawa T, Yamamoto S, Yokoyama R, Umeda T, Matsuno Y, Hirohashi S. Prognostic significance of grading and staging systems using MIB-1 score in adult patients with soft tissue sarcoma of the extremities and trunk. Cancer. 2002;95:843–851. doi: 10.1002/cncr.10728. [DOI] [PubMed] [Google Scholar]