

Abstract
Introduction:
The home can represent a significant source of secondhand smoke (SHS), especially for individuals who live in close proximity to one another in multiunit housing (MUH). The objective of this study was to quantify real-time SHS transfer between smoke-permitted and smoke-free living units within the same MUH structure.
Methods:
Air monitors were used to assess PM2.5, an environmental marker for SHS, in 14 smoke-free living units and 16 smoke-permitted units within 11 MUH buildings in the Buffalo, New York, area between July 2008 and August 2009. Air monitors were operated concurrently in both smoke-permitted and smoke-free units within each building. When feasible, additional monitors were stationed in shared hallways and on outdoor patios. Participants completed logs to document activities that could affect air quality.
Results:
Evidence of SHS transfer from smoke-permitted units was detected in 2 of the 14 smoke-free units and 6 of the 8 hallways. Real-time PM2.5 plots and participant logs suggest that SHS transfer is a function of many determinants, including ventilation and proximity between units. Following stratification by time of day, median PM2.5 levels were greatest between 4:00 PM and 11:59 PM but varied by location: 10.2 μg/m3 in smoke-free units, 18.9 μg/m3 in hallways, and 29.4 μg/m3 in smoke-permitted units.
Conclusions:
This study documents SHS incursions from smoke-permitted units into smoke-free units and adjacent hallways within the same building. Since many factors appear to impact the amount of SHS transfer between these areas, the implementation of a smoke-free building policy represents the most effective way to ensure that residents of MUH units are not exposed to SHS.
Introduction
Secondhand smoke (SHS), or tobacco smoke pollution, consists of a mixture of gases and particulate matter generated from the mouth of a smoker after taking a puff on a cigarette (mainstream smoke) or from the burning end of a smoldering cigarette (sidestream smoke) (National Toxicology Program [NTP], 2005). SHS has been shown to cause significant morbidity and mortality among both adults and children who do not smoke (U.S. Department of Health and Human Services [USDHHS], 1986, 2006). Each year, SHS accounts for an estimated 50,000 deaths among adult nonsmokers, including approximately 3,400 from lung cancer and between 22,700 and 69,600 from heart disease (California Environmental Protection Agency, 2005). SHS has also been classified as a human carcinogen by the U.S. Environmental Protection Agency (USEPA), NTP, U.S. Surgeon General, and International Agency for Research on Cancer (IARC) (IARC, 2004; NTP, 2005; USDHHS, 2006; USEPA, 1992). The health effects of SHS are believed to be dependent upon both intensity and length of exposure (Davis, 1998), where intensity is a function of smoking rate, ventilation, and the size of the microenvironment (USDHHS).
Public advocacy and scientific inquiry have prompted many municipalities to adopt bans on smoking in public areas (Eriksen and Cerak, 2008). As of April 2010, an estimated 74.2% of the U.S. population was covered by either a state or a local law that prohibits smoking inside workplaces, bars, or restaurants (Americans for Non-Smokers’ Rights, 2010). However, relatively few regulatory entities have instituted restrictions on smoking in personal living areas (Center for Social Gerontology, 2009), which represent an increasing and significant source of SHS exposure for many individuals (Klepeis et al., 2001; USDHHS, 2006).
The Surgeon General's Call to Action to Promote Healthy Homes has stressed the importance of instituting smoke-free home policies (USDHHS, 2009). Such policies have been shown to reduce SHS exposure in the home (USDHHS, 2006), increase cessation among smokers, and decrease relapse among former smokers (Hyland et al., 2009; Mills, Messer, Gilpin, and Pierce, 2009). Although the prevalence of smoke-free home policies varies by region, approximately 40% of U.S. smokers and 80% of nonsmokers report that smoking is prohibited in their home (Giovino et al., 2009). Nonetheless, the potential for exposure in the home, including the health effects associated with such exposure, remains significant. Americans spend nearly 69% of their time in personal living spaces (Klepeis et al., 2001), and the adverse health effects associated with SHS are intensified with increasing length of exposure (Davis, 1998). Moreover, SHS exposure in the home has been linked to an increased risk of heart disease and lung cancer in nonsmokers (USDHHS), and metabolites of tobacco-specific lung carcinogens attributable to SHS have been observed in nonsmokers with a spouse who smokes (Anderson et al., 2001).
Nonsmokers who reside in multiunit housing (MUH) do not have the same level of control over exposure to SHS as those who live in single-unit housing, since they may share the same air space as those who smoke in adjacent units. Measurements of ventilation and infiltration systems in MUH show that a significant fraction of air entering living units originates from elsewhere in the building (Hewett, Sandell, Anderson, and Niebuhr, 2007; Repace, 2007). Moreover, almost all respirable suspended particulates (RSP) emitted from burning cigarettes are less than 2.5 μm in diameter (PM2.5), which are easily inhaled into the lungs (Klepeis, Apte, Gundel, Sextro, and Nazaroff, 2003) and capable of infiltrating through building cracks (Liu and Nazaroff, 2003; Thatcher, Lunden, Revzan, Sextro, and Brown, 2003). Furthermore, even brief exposure to SHS can have adverse effects on nonsmokers, especially those with preexisting respiratory and cardiac conditions (Institute of Medicine, 2009). Specific effects of brief exposure include sustained vascular injury (Heiss et al., 2008) and irritation of the eyes and nasal passages (Junker, Danuser, Monn, and Koller, 2001).
To date, few studies have quantitatively assessed indicators of SHS exposure in homes. Leaderer and Hammond (1991) first investigated PM2.5 in relation to SHS in 96 separate residences and found that levels in smoke-permitted homes (44 μg/m3) were 3 times greater than levels in smoke-free homes (15 μg/m3). In a subsequent review, Wallace (1996) found that levels in smoke-permitted homes were between 25 and 47 μg/m3 higher than those observed in smoke-free homes. In addition, Van Deusen et al. (2009) examined PM2.5 levels within 13 personal residences, 6 of which were single-family homes and the remaining 7 of which were within multiunit buildings. The authors observed elevated PM2.5 levels in both smoke-permitted and smoke-free areas within the assessed homes, which suggests that the confinement of smoking to certain areas of the home does not offer protection from SHS exposure. Most recently, Kraev, Adamkiewicz, Hammond, and Spengler (2009) assessed vapor phase nicotine in MUH and found detectable levels of nicotine contamination in 89% of smoke-free units. Although the latter study suggests that tobacco smoke contamination is not limited to only smoke-permitted units, the study design did not allow for an assessment of real-time transfer between units.
To date, no single compound has been identified as a valid indicator for every constituent of SHS. However, there are certain environmental markers, which are sufficiently specific to SHS that can provide a valid estimate of the overall magnitude, duration, and frequency of exposure (USDHHS, 2006). One such marker is RSP, which can be assessed in real time using relatively low cost, and standardized, measurement techniques (Jaakkola and Jaakola, 1997). The primary benefit of using real-time monitors to assess SHS is that pollution levels can be correlated with specific instances of active smoking and then tracked over time and space to identify mechanisms of exposure. Additionally, real-time monitors can measure RSP levels over a period of seconds, thus enabling researchers to determine peak pollution levels and to make direct comparisons with existing health standards and outcomes (Klepeis, Ott, and Switzer, 2007).
To our knowledge, no study has assessed the extent to which SHS distributes throughout MUH in real time. Therefore, the objective of this study was to simultaneously assess real-time PM2.5 levels in smoke-permitted living units, smoke-free living units, and shared hallways within the same MUH building.
Methods
Participants
Participants for this study were recruited between July 2008 and August 2009 via personal contacts, Internet advertisements, and flyer postings in the Buffalo, New York, area. Participant selection included an initial screening process to identify individuals who currently reside in MUH structures comprised both smoke-permitted and smoke-free units. A smoke-permitted unit was defined as a personal living unit in which the resident reported that smoking occurred on a daily basis, while a smoke-free unit was defined as a unit in which the resident reported that smoking was completely prohibited. After individuals from both types of units were identified within a single MUH structure, participants were formally invited to participate and the following eligibility criteria were verified: (a) willingness to allow research staff to enter and place continuously operating air monitoring equipment in their unit for at least 72 hr and (b) willingness and ability to keep a daily activity log describing the presence and time of activities that could affect air quality levels. Although an eligible building had to contain at least one smoke-permitted unit and one smoke-free unit, there was no set limit as to the quantity of units that could participate within a single building.
Procedures
Research staff visited each eligible residential unit to measure room dimensions, obtain informed consent, administer a brief questionnaire, provide instructions on completing the daily activity log, and setup the air monitoring equipment. Air monitors were simultaneously positioned in smoke-permitted and smoke-free units within the same building and were operated concurrently during the assessment period. Within each unit, air monitors were placed in a location identified as the primary living area, which was most commonly the living room for both smoke-permitted (94%) and smoke-free (86%) units. When feasible, additional monitors were also simultaneously stationed in a shared hallway between participating units and on the outdoor patios of smoke-free units. The patio monitors were included in the study to provide a control measure to which the indoor locations could be compared. Criteria for feasibility of a hallway and/or outdoor monitor included the presence of both an electrical source and a structure to which the monitor could be securely locked. To corroborate the validity of PM2.5 levels, vapor phase nicotine, a highly specific indicator of tobacco smoke (Jaakkola and Jaakola, 1997), was assessed in one of the buildings (Building 11). Hourly outdoor PM2.5 levels were also obtained from a nearby Department of Environmental Conservation monitoring station with the intent of confirming the validity of the levels measured on the patios.
All participants were instructed to keep a daily activity log detailing occurrences that could affect air quality levels, including smoking, cooking, pyrolosis (candle burning or non-tobacco smoking event), use of electrical appliances, and window or door placement. After approximately 72 hr, research staff retrieved the equipment and provided participants with a $50 compensation check. All research procedures were approved by the Institutional Review Board at Roswell Park Cancer Institute.
Equipment
TSI SidePak AM510 Personal Aerosol Monitors (TSI, Inc., St. Paul, MN; Figure 1) were used to assess RSP levels in real time. This device is a scientifically validated tool that has previously been used to quantify SHS exposure in both public (Alpert, Carpenter, Travers, and Connolly, 2007; Jones et al., 2006; Repace, 2004; Travers et al., 2004) and personal living (Van Deusen et al., 2009) areas. The SidePak functions via a built-in sampling pump which draws continuously streaming aerosol into a sensing chamber where it is illuminated by a laser light. Particles in the aerosol stream scatter the light, which is quantified by a photometer and converted to the mass concentration of the aerosol. The specific class of RSP assessed was PM2.5, or particulate matter with a diameter less than 2.5 μm; particles of this size are released in significant quantities from burning cigarettes and can easily be inhaled into the lungs (Travers et al.). Prior to each assessment, the SidePak was calibrated in accordance with the manufacturer's specifications, the flow rate was set at 1.7 L/min, and the logging interval was set to 1 min.
Figure 1.

Median PM2.5 levels in smoke-permitted units, hallways, smoke-free units, and outdoor patios by time of day.
For the validation assessment, vapor phase nicotine was evaluated in 2 units of a 3-unit building (Building 11), using an AirChek 52 air sampling pump (SKC Inc., Eight Four, PA) and XAD-4 sorbent tube set at a flow rate of 1.0 L/min. Calibration standards were analyzed before and after data collection and nicotine levels were assessed relative to a field blank. Resultant nicotine concentrations were then compared to expected concentrations derived from PM2.5 levels observed in the units during the same time period (Repace and Lowrey, 1993).
Definition of Measure
The primary outcome of interest was SHS transfer between smoke-permitted and smoke-free units. Transfer was defined as any instance in which tobacco combustion was documented on the activity log of a smoke-permitted unit and corresponding temporal increases in PM2.5, which could not be attributed to an exogenous source, were observed in both the smoke-permitted unit and the smoke-free unit or hallway within the same building. An exogenous source was defined as appliance use (including cooking) or pyrolosis (candle burning or non-tobacco smoking event) recorded in the activity logs.
Data Analysis
Data were downloaded for analysis using TrakPro software (TSI, Inc., St. Paul, MN), and a calibration factor reflective of SHS particles (0.32) was subsequently applied (Travers et al., 2004; Van Deusen et al., 2009). Median PM2.5 levels (micrograms per cubic meter) were calculated both overall and by 8-hr increments (12:00 AM to 7:59 AM, 8:00 AM to 3:59 PM, 4:00 PM to 11:59 PM), while linear regression was used to assess trends in PM2.5 across monitor locations. Monitoring time, household volume, and quantity of cigarettes were used to ascertain the cigarette density of each smoke-permitted unit (cigarettes/hr/100 m3).
Real-time data plots were constructed, and daily activity logs were matched with PM2.5 data to assess transfer between monitor locations and the relative contribution of smoking, ventilation, and other sources of particulate matter. In an effort to explore the temporal dynamics of particulate transfer, the correlation between PM2.5 levels in smoke-permitted and smoke-free units was examined using varying lag times between monitor locations. The lag time required to achieve the greatest spearman rho correlation represents the time it takes for SHS to transfer between units (Van Deusen et al., 2009).
Results
Air quality data were obtained from 30 living units within 11 different MUH structures. Table 1 presents descriptive summary statistics corresponding to the assessed smoke-permitted units (n = 16), smoke-free units (n = 14), hallways (n = 8), and outdoor patios (n = 3). Monitors ran for a total of 981 hr in smoke-permitted units (median = 72 hr; range 8–72), 938 hr in smoke-free units (median = 72 hr; range 12–72), 460 hr in hallways (median = 70 hr; range 10–72), and 217 hr in outdoor patios (median = 72 hr; range 70–75). Assessed buildings varied in size between 2 and 11 total units, with a median unit volume of 155 m3 (range 120–180).
Table 1.
Descriptive Summary of Smoke-Permitted (n = 16), Smoke-Free Units (n = 14), Hallways (n = 8), and Outdoor Patios (n = 3)
| Building size (units) | Building location (floor) | Sampling time (hr) | Cigarettes smoked (n) | Cigarette densitya (cig/hr/100 m3) | Median PM2.5 (μg/m3) | PM2.5 percentile levels |
||||||
| Building ID | Unit ID | Monitor location | 10th | 25th | 75th | 90th | ||||||
| 1 | 1 | Smoke permitted | 11 unit | First | 72 | 26 | 0.2 | 22.4 | 9.9 | 15.4 | 54.1 | 140.8 |
| 2 | 2 | Smoke permitted | 11 unit | Second | 72 | 50 | 0.4 | 22.1 | 10.9 | 16.0 | 45.4 | 132.8 |
| 3 | 3 | Smoke permitted | 11 unit | Ground | 14 | 37 | 1.6 | 60.8 | 31.4 | 53.4 | 75.8 | 99.4 |
| 3 | 4 | Smoke permitted | 11 unit | Ground | 72 | 11 | 0.1 | 16.6 | 7.0 | 11.2 | 51.6 | 124.8 |
| 4 | 5 | Smoke permitted | 11 unit | First | 69 | 18 | 0.1 | 19.2 | 7.0 | 12.2 | 30.4 | 47.4 |
| 4 | 6 | Smoke permitted | 11 unit | First | 69 | 10 | 0.1 | 17.0 | 5.4 | 8.6 | 25.0 | 45.4 |
| 4 | 7 | Smoke permitted | 11 unit | Second | 72 | 31 | 0.3 | 38.1 | 10.9 | 22.4 | 98.4 | 195.7 |
| 4 | 8 | Smoke permitted | 11 unit | Second | 72 | 15 | 0.1 | 16.0 | 7.7 | 8.3 | 21.1 | 40.0 |
| 5 | 9 | Smoke permitted | 11 unit | Second | 71 | 23 | 0.2 | 86.1 | 5.1 | 15.7 | 172.5 | 333.3 |
| 5 | 10 | Smoke permitted | 11 unit | Second | 72 | 23 | 0.2 | 22.7 | 9.0 | 11.5 | 63.0 | 125.4 |
| 6 | 11 | Smoke permitted | Four unit | First | 69 | 14 | 0.1 | 4.2 | 1.9 | 2.6 | 8.6 | 42.6 |
| 7 | 12 | Smoke permitted | Four unit | First | 72 | 22 | 0.2 | 34.2 | 2.2 | 10.6 | 84.6 | 174.4 |
| 8 | 13 | Smoke permitted | Four unit | Second | 8 | 18 | 1.5 | 229.6 | 85.8 | 147.7 | 313.8 | 428.7 |
| 9 | 14 | Smoke permitted | Two unit | First | 33 | 12 | 0.2 | 72.3 | 4.5 | 12.2 | 133.0 | 251.2 |
| 10 | 15 | Smoke permitted | Two unit | First | 72 | 10 | 0.1 | 7.4 | 4.5 | 5.8 | 15.7 | 48.6 |
| 11 | 16 | Smoke permitted | Three unit | Second | 72 | 93 | 1.1 | 16.6 | 4.8 | 6.1 | 57.0 | 148.8 |
| 1 | 17 | Smoke free | 11 unit | Ground | 12 | b | b | 9.9 | 1.9 | 2.6 | 19.5 | 30.7 |
| 1 | 18 | Smoke free | 11 unit | First | 72 | b | b | 12.2 | 5.1 | 7.0 | 19.2 | 25.0 |
| 2 | 19 | Smoke free | 11 unit | First | 72 | b | b | 12.2 | 8.0 | 9.9 | 15.0 | 18.7 |
| 2 | 20 | Smoke free | 11 unit | Second | 72 | b | b | 9.3 | 4.5 | 5.8 | 12.2 | 14.7 |
| 3 | 21 | Smoke free | 11 unit | First | 72 | b | b | 1.6 | 0.1 | 0.3 | 8.3 | 30.1 |
| 4 | 22 | Smoke free | 11 unit | First | 71 | b | b | 14.1 | 7.4 | 8.0 | 16.0 | 19.6 |
| 5 | 23 | Smoke free | 11 unit | First | 72 | b | b | 3.2 | 1.6 | 2.1 | 4.8 | 9.9 |
| 5 | 24 | Smoke free | 11 unit | Second | 70 | b | b | 6.1 | 2.2 | 3.5 | 11.5 | 16.0 |
| 6 | 25 | Smoke free | Four unit | Second | 68 | b | b | 3.5 | 1.9 | 2.6 | 4.2 | 5.1 |
| 7 | 26 | Smoke free | Four unit | First | 72 | b | b | 14.1 | 4.2 | 6.1 | 27.8 | 49.9 |
| 8 | 27 | Smoke free | Four unit | First | 72 | b | b | 4.5 | 2.6 | 3.5 | 6.1 | 7.7 |
| 9 | 28 | Smoke free | Two unit | Second | 69 | b | b | 15.7 | 6.1 | 8.6 | 33.9 | 59.2 |
| 10 | 29 | Smoke free | Two unit | Second | 72 | b | b | 8.0 | 5.8 | 6.7 | 13.4 | 21.4 |
| 11 | 30 | Smoke free | Three unit | First | 72 | b | b | 15.7 | 9.0 | 12.2 | 20.8 | 28.2 |
| 1 | b | Hallway | 11 unit | First | 72 | b | b | 18.2 | 6.4 | 11.5 | 34.2 | 40.6 |
| 2 | b | Hallway | 11 unit | Second | 72 | b | b | 15.4 | 6.1 | 8.6 | 20.2 | 30.7 |
| 3 | b | Hallway | 11 unit | First | 69 | b | b | 17.6 | 10.9 | 13.4 | 31.4 | 51.2 |
| 4 | b | Hallway | 11 unit | Second | 72 | b | b | 20.2 | 12.5 | 14.2 | 27.8 | 45.1 |
| 5 | b | Hallway | 11 unit | Second | 50 | b | b | 14.8 | 10.6 | 11.5 | 19.8 | 21.8 |
| 6 | b | Hallway | Four unit | First/secondc | 68 | b | b | 4.5 | 1.6 | 2.2 | 7.7 | 13.8 |
| 9 | b | Hallway | Two unit | First/secondc | 10 | b | b | 12.2 | 8.3 | 9.3 | 23.4 | 49.0 |
| 11 | b | Hallway | Three unit | First/Secondc | 47 | b | b | 90.9 | 85.4 | 88.3 | 97.9 | 106.2 |
| 1 | b | Outdoor patio | 11 unit | First | 72 | b | b | 18.2 | 6.7 | 10.2 | 32.3 | 39.4 |
| 2 | b | Outdoor patio | 11 unit | First | 75 | b | b | 9.3 | 3.8 | 5.1 | 12.8 | 14.7 |
| 5 | b | Outdoor patio | 11 unit | Second | 70 | b | b | 2.6 | 1.0 | 1.3 | 4.5 | 9.3 |
Note. aCigarette density is the number of cigarettes smoked in the living unit per hour of sampling time per 100 m3 of living unit volume.
Not applicable.
Air monitors were placed in shared hallways between floors.
The activity logs completed by participants indicated that smoking occurred on a daily basis in each of the smoke-permitted units. A total of 413 cigarettes (median = 20, range = 10–93) were smoked within the smoke-permitted units during the monitoring periods, while no cigarettes were smoked within the smoke-free units. The amount of cigarettes smoked per day, as reported at baseline, was correlated with the quantity actually smoked during the assessment period (ρspearman = 0.596, p = .015). Cigarette density (median = 0.2 cigarettes/hr/100 m3, range = 0.1–1.6) trended positively with median PM2.5 (ρspearman = 0.766, p = .001), and cumulative vapor phase nicotine concentrations (smoke-permitted unit = 5.73 μg/m3 and smoke-free unit = 0.20 μg/m3) were comparable to expected nicotine concentrations (4.10 and 0.44 μg/m3) derived from mean PM2.5 levels observed during the same period (Repace and Lowrey, 1993). Similarly, the median PM2.5 level observed on the assessed patios (8.6 μg/m3) did not significantly differ from the outdoor level measured by the nearby Department of Environmental Conservation monitoring station during the same time period (9.9 μg/m3).
Figure 1 presents median PM2.5 levels in smoke-permitted units, hallways, smoke-free units, and outdoor patios both overall and stratified by time of day. Overall median PM2.5 levels were 20.2 μg/m3 in smoke-permitted units (individual unit range: 4.2–229.6 μg/m3), 16.6 μg/m3 in hallways (individual hallway range: 4.5–90.9 μg/m3), 8.3 μg/m3 in smoke-free units (individual unit range: 1.6–15.7 μg/m3), and 8.6 μg/m3 on outdoor patios (individual patio range: 2.6–18.2 μg/m3). Following stratification by time of day, median PM2.5 levels were greatest in all three indoor locations between 4:00 PM and 11:59 PM, the same time period in which the most cigarettes were smoked (n = 181; 43.8%). Regardless of the time of day, a significant trend (p < .001) in PM2.5 levels was observed across monitor locations (Figure 1).
Evidence of SHS transfer from smoke-permitted units was detected in 2 of the 14 smoke-free units (14%) and 6 of the 8 hallways (75%). Examples of specific instances of transfer between units are presented in Figure 2. Figure 2 shows PM2.5 levels over a 1-hr period on the second floor of a 11-unit MUH structure. Aside from an open patio door in the smoking unit, no other instances of appliance use, pyrolosis, or ventilation were reported on activity logs during the presented timeframe. The lag time resulting in the highest correlation between peak monitor readings was 2 min for the first smoking occurrence and 3 min for the second occurrence. The constant PM2.5 levels in the hallway implicate the shared wall between units as the primary mechanism of transfer. Similarly, Figure 2 shows PM2.5 levels over a 30-min period in a 11-unit MUH structure. The front door of the smoke-permitted unit was opened during the presented timeframe and the hallway monitor was located immediately outside the entrance to the smoke-permitted unit. Following the smoking events in the smoke-permitted unit, elevated PM2.5 levels were observed in the hallway. Immediately following the door's closure, levels diminished in the hallway. Shortly thereafter, elevated levels were observed in the smoke-free unit down the hall. No instances of appliance use or pyrolosis were reported in either of the units immediately before or during this time period. The lag time resulting in the highest correlation between peak levels was 10 min. The elevated PM2.5 levels observed in the smoke-permitted unit following the reported instances of smoking, coupled with the elevated levels observed in the hallway following the period during which the front door of the smoke-permitted unit was opened, implicate the open door of the smoke-permitted unit as the primary mechanism of transfer.
Figure 2.
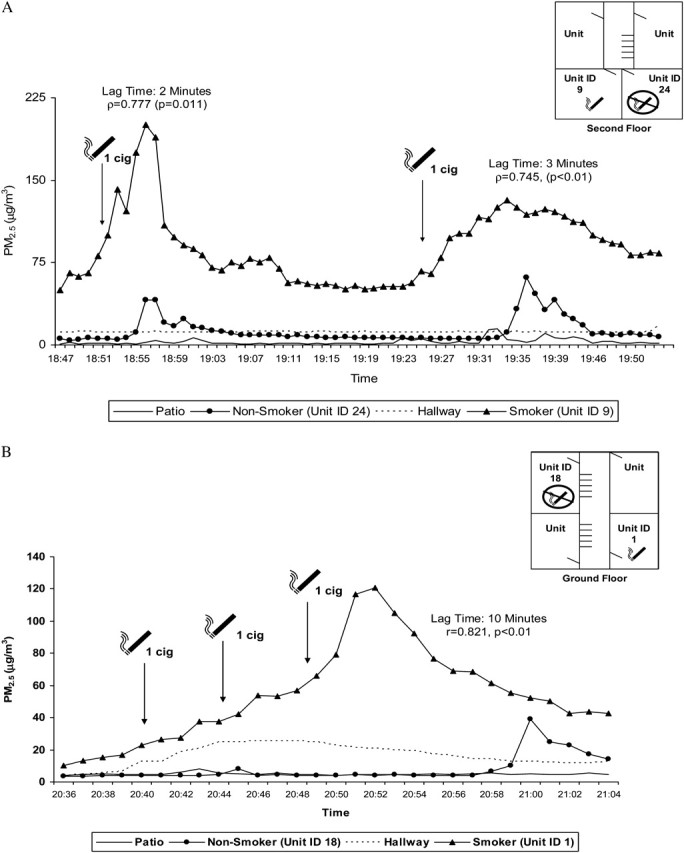
(a) Illustration of real-time changes in PM2.5 levels in a multiunit residential building (Building 5). Note: The patio door of the smoke-permitted unit was open during the timeframe presented. No other instances of appliance use, pyrolosis, or ventilation were reported during this timeframe. No air monitoring was conducted in unlabeled units. (b) Illustration of real-time changes in PM2.5 levels in a multiunit residential building (Building 1). Note: The front door of the smoke-permitted unit was opened during the timeframe presented. No other instances of appliance use, pyrolosis, or ventilation were reported during this timeframe. No air monitoring was conducted in unlabeled units.
Discussion
This study documents SHS incursions from smoke-permitted units to smoke-free units and shared hallways within the same MUH building. Therefore, the estimated 62.2 million individuals who reside in smoke-free units within smoke-permitted buildings across the United States (Giovino et al., 2009; U.S. Census Bureau, 2009) may be susceptible to involuntary SHS incursions and the health risks associated with such exposures.
The PM2.5 levels observed in this study were comparable in magnitude to those observed by Van Deusen et al. (2009) in their assessment of SHS transfer within homes, which included seven MUH units. These levels suggest that individuals who reside in close proximity to one another in MUH are especially vulnerable to compromised air quality from SHS incursions originating in units where smoking is permitted. The quantity of cigarettes smoked and median PM2.5 levels in the present study were greatest between 4:00 PM and 11:59 PM, which corresponds to the time period when persons are typically present in their home (Klepeis et al., 2001).
While our data provide evidence of SHS transfer from smoke-permitted units into smoke-free units and shared hallways, a thorough analysis of real-time data plots and participant activity logs indicates that the extent of transfer is dependent upon many determinants, including ventilation and distance between smoke-permitted and smoke-free units. Since ventilation systems and the physical separation of nonsmokers from smokers do not fully eliminate SHS (Cains, Sannata, Poulos, Ferson, and Stewart, 2005; Repace, 2004; Repace, Hyde, and Brugge, 2006; Repace and Lowrey, 1980, 1985), prohibiting smoking in MUH is the only effective means of completely protecting nonsmokers from exposure (USDHHS, 2006). There are currently no federal or state laws that prohibit MUH operators from prohibiting smoking on their properties (Schoenmarklin, 2005). Moreover, the legal permissibility of these policies extends to MUH subsidized through the U.S. Department of Housing and Urban Development (USDHUD), which strongly encourages Public Housing Authorities to restrict smoking in their buildings (USDHUD, 2009).
To our knowledge, this study is the first to assess real-time SHS transfer between smoke-permitted and smoke-free living units within the same MUH structure. Strengths of this study include the use of a scientifically validated monitoring instrument capable of real-time data acquisition, the inclusion of MUH structures with varying quantities of living units, and the utilization of daily activity logs to account for factors that can confound air quality levels. However, there are also some limitations that should be acknowledged. First, the study assessed particles less than 2.5 μm in diameter (PM2.5), which are emitted from many combustible materials and thus not specific to tobacco smoke; however, cigarette smoke has previously been shown to serve as a major source of PM2.5, especially when background levels are low (Travers et al., 2004). Moreover, vapor phase nicotine levels collected in one of the assessed buildings were comparable to expected concentrations derived from PM2.5 levels observed during the same time period. A second limitation is the inability to control for extraneous sources of PM2.5 from nonparticipating units. However, in order to reduce the potential for confounding from unmeasured units, a rigorous definition was used to establish SHS transfer from a participating smoke-permitted unit to a nearby participating smoke-free unit and/or hallway within the same building. This definition required that an instance of SHS transfer included a documented smoking event, followed by temporally elevated PM2.5 levels in both the smoke-permitted unit and the smoke-free unit, which could not be attributed to any other documented source. Finally, outdoor air quality was assessed for only 3 of the 11 buildings as a result of safety and logistical constraints. Nonetheless, outdoor PM2.5 levels measured by a nearby Department of Environmental Conservation monitoring station were comparable to those observed on the assessed patios during the same time period.
In conclusion, the results of this study indicate that SHS can transfer between living units within the same MUH building. However, further research is needed to substantiate causality. More specifically, there is a need for the development of technology that is capable of tracking transfer between units in real time using a marker specific to SHS. In the present absence of such technology, evaluations of airborne particulate should be conducted under controlled conditions in which the presence of active smoking and potential confounders is documented for every unit in the building. Nonetheless, the present findings suggest that the implementation of a 100% smoke-free building policy remains the most effective way to ensure that residents of MUH units are not exposed to SHS.
Funding
Flight Attendant Medical Research Institute; Cooperative Agreement Number 1R36 DP001848 from the U.S. Centers for Disease Control and Prevention (CDC).
Declaration of Interests
None declared.
Acknowledgments
Its contents are solely the responsibility of the authors and do not necessarily represent the official views of the funding agencies.
References
- Alpert H, Carpenter C, Travers MJ, Connolly G. Environmental and economic evaluation of the Massachusetts smoke-free workplace law. Journal of Community Health. 2007;32:269–281. doi: 10.1007/s10900-007-9048-6. doi:10.1007/s10900-007-9048-6. [DOI] [PubMed] [Google Scholar]
- Americans for Non-Smokers’ Rights. Summary of 100% state smoke-free laws and population protected by 100% U.S. smoke-free laws. 2010. Retrieved April 13, 2010, from http://www.no-smoke.org/pdf/SummaryUSPopList.pdf. [Google Scholar]
- Anderson KE, Carmella SG, Ye M, Bliss RL, Le C, Murphy L, et al. Metabolites of a tobacco-specific lung carcinogen in nonsmoking women exposed to environmental tobacco smoke. Journal of the National Cancer Institute. 2001;93:378–381. doi: 10.1093/jnci/93.5.378. doi:10.1093/jnci/93.5.378. [DOI] [PubMed] [Google Scholar]
- Cains T, Sannata S, Poulos R, Ferson MJ, Stewart BW. Designated “no smoking” areas provide from partial to no protection from environmental tobacco smoke. Tobacco Control. 2005;13:17–22. doi: 10.1136/tc.2003.005488. doi:10.1136/tc.2003.005488. [DOI] [PMC free article] [PubMed] [Google Scholar]
- California Environmental Protection Agency. Proposed identification of environmental tobacco smoke as a toxic air contaminant. Sacramento (CA): California EPA, Office of Environmental Hazard Assessment; 2005. [Google Scholar]
- Center for Social Gerontology. Housing authorities/commissions which have adopted smoke-free policies. Smoke-free environments law project. 2009. Retrieved September 04, 2009, from http://www.tcsg.org/sfelp/home.htm. [Google Scholar]
- Davis RM. Exposure to environmental tobacco smoke: Identifying and protecting those at risk. Journal of the American Medical Association. 1998;280:1947–1949. doi: 10.1001/jama.280.22.1947. doi:10.1001/jama.280.22.1947. [DOI] [PubMed] [Google Scholar]
- Eriksen MP, Cerak RL. The diffusion and impact of clean indoor air laws. Annual Review of Public Health. 2008;29:171–185. doi: 10.1146/annurev.publhealth.29.020907.090920. doi:10.1146/annurev.publhealth.29.020907.090920. [DOI] [PubMed] [Google Scholar]
- Giovino GA, Chaloupka FJ, Hartman AM, Gerlach Joyce K, Chriqui J, Orleans CT, et al. Cigarette smoking prevalence and policies in the 50 States: An era of change—The Robert Wood Johnson Foundation ImpacTeen Tobacco Chart Book. Buffalo, NY: University at Buffalo, SUNY; 2009. [Google Scholar]
- Heiss C, Amabile N, Lee AC, Real WM, Schick SF, Lao D, et al. Brief secondhand smoke exposure depresses endothelial progenitor cells activity and endothelial function: Sustained vascular injury and blunted nitric oxide production. Journal of the American College of Cardiology. 2008;51:1760–1771. doi: 10.1016/j.jacc.2008.01.040. doi:10.1016/j.jacc.2008.01.040. [DOI] [PubMed] [Google Scholar]
- Hewett MJ, Sandell SD, Anderson J, Niebuhr M. Secondhand smoke in apartment buildings: Renter and owner or manager perspectives. Nicotine & Tobacco Research. 2007;9:S39–S47. doi: 10.1080/14622200601083442. doi:10.1080/14622200601083442. [DOI] [PubMed] [Google Scholar]
- Hyland A, Higbee C, Travers MJ, Van Deusen A, Bansal-Travers M, King BA, et al. Smoke-free homes and smoking cessation and relapse in a longitudinal population of adults. Nicotine & Tobacco Research. 2009;11:614–618. doi: 10.1093/ntr/ntp022. doi:10.1093/ntr/ntp022. [DOI] [PMC free article] [PubMed] [Google Scholar]
- Institute of Medicine. Secondhand smoke exposure and cardiovascular effects: Making sense of the evidence. Washington, DC: The National Academies Press; 2009. [PubMed] [Google Scholar]
- International Agency for Research on Cancer. Tobacco smoke and involuntary smoking. Lyon, France: Author; 2004. (IARC Monograph No. 83) [Google Scholar]
- Jaakkola MS, Jaakola JJK. Assessment of exposure to environmental tobacco smoke. European Respiratory Journal. 1997;10:2384–2397. doi: 10.1183/09031936.97.10102384. doi:10.1183/09031936.97.10102384. [DOI] [PubMed] [Google Scholar]
- Jones S, Travers MJ, Hahn E, Robertson H, Lee K, Higbee C, et al. Secondhand smoke and indoor public spaces in Paducah, Kentucky. Journal of the Kentucky Medical Association. 2006;104:281–288. [PubMed] [Google Scholar]
- Junker MH, Danuser B, Monn C, Koller T. Acute sensory response of nonsmokers at very low environmental tobacco smoke concentrations in controlled laboratory settings. Environmental Health Perspectives. 2001;109:1045–1052. doi: 10.1289/ehp.011091045. doi:10.2307/3454960. [DOI] [PMC free article] [PubMed] [Google Scholar]
- Klepeis NE, Ott WR, Switzer P. Real-time measurement of outdoor tobacco smoke particles. Journal of Air and Waste Management Association. 2007;57:522–534. doi: 10.3155/1047-3289.57.5.522. doi:10.3155/1047-3289.57.5.522. [DOI] [PubMed] [Google Scholar]
- Klepeis NE, Apte MG, Gundel LA, Sextro RG, Nazaroff WW. Determining size-specific emission factors for environmental tobacco smoke particles. Aerosol Science & Technology. 2003;37:780–790. doi:10.1080/02786820300914. [Google Scholar]
- Klepeis N, Nelson W, Ott W, Robinson J, Tsang AM, Switzer P, et al. The National Human Activity Pattern Survey (NHAPS): A resource for assessing exposure to environmental pollutants. Journal of Exposure Analysis & Environmental Epidemiology. 2001;11:231–252. doi: 10.1038/sj.jea.7500165. doi:10.1038/sj.jea.7500165. [DOI] [PubMed] [Google Scholar]
- Kraev TA, Adamkiewicz G, Hammond SK, Spengler J. Indoor concentrations of nicotine in low-income, multi-family housing: Associations with smoking behaviors and housing characteristics. Tobacco Control. 2009;18:438–444. doi: 10.1136/tc.2009.029728. doi:10.1136/tc.2009.029728. [DOI] [PMC free article] [PubMed] [Google Scholar]
- Leaderer BP, Hammond SK. Evaluation of vapor-phase nicotine and respirable particle mass as markers for environmental tobacco smoke. Environmental Science & Technology. 1991;25:770–777. doi:10.1021/es00016a023. [Google Scholar]
- Liu DL, Nazaroff WW. Particle penetration through building cracks. Aerosol Science & Technology. 2003;37:565–573. doi:10.1080/02786820390126132. [Google Scholar]
- Mills A, Messer K, Gilpin E, Pierce J. The effect of smoke-free homes on adult smoking behavior; A review. Nicotine & Tobacco Research. 2009;11:1131–1141. doi: 10.1093/ntr/ntp122. doi:10.1093/ntr/ntp122. [DOI] [PubMed] [Google Scholar]
- National Toxicology Program. Report on carcinogens. 11th ed. Washington, DC: U.S. Government Printing Office.; 2005. U.S. Department of Health and Human Services, Public Health Service, National Toxicology Program. [Google Scholar]
- Repace J. Respirable particles and carcinogens in the air of Delaware hospitality venues before and after a smoking ban. Journal of Occupational & Environmental Medicine. 2004;46:887–905. doi: 10.1097/01.jom.0000141644.69355.52. doi:10.1186/1471-2458-6-266. [DOI] [PubMed] [Google Scholar]
- Repace J. Exposure to secondhand smoke. In: Ott W, Steinemann A, Wallace L, editors. Exposure analysis. Boca Raton, FL: CEC Press; 2007. pp. 201–232. [Google Scholar]
- Repace JL, Hyde JN, Brugge D. Air pollution in Boston bars before and after a smoking ban. BMC Public Health. 2006;6:266. doi: 10.1186/1471-2458-6-266. doi:10.1186/1471-2458-6-266. [DOI] [PMC free article] [PubMed] [Google Scholar]
- Repace JL, Lowrey AH. Indoor air pollution, tobacco smoke, and public health. Science. 1980;208:464–472. doi: 10.1126/science.7367873. doi:10.1126/science.7367873. [DOI] [PubMed] [Google Scholar]
- Repace JL, Lowrey AH. An indoor air quality standard for ambient tobacco smoke based on carcinogenic risk. New York State Journal of Medicine. 1985;85:381–383. [PubMed] [Google Scholar]
- Repace JL, Lowrey AH. An enforceable indoor air quality standard for environmental tobacco smoke in the workplace. Risk Analysis. 1993;13:463–475. doi: 10.1111/j.1539-6924.1993.tb00747.x. doi:0272-4332/93/OBOD-0663S07. [DOI] [PubMed] [Google Scholar]
- Schoenmarklin S. Analysis of the authority of housing authorities and section 8 multiunit housing owners to adopt smoke-free policies in their residential units. Smoke-free environments law project. 2005. Retrieved August 07, 2009, from http://www.tcsg.org/sfelp/public_housing24E577.pdf. [Google Scholar]
- Thatcher TL, Lunden MM, Revzan KL, Sextro RG, Brown NJ. A concentration rebound method for measuring particle penetration and deposition in the indoor environment. Aerosol Science & Technology. 2003;37:847–864. doi:10.1080/02786820390228508. [Google Scholar]
- Travers MJ, Cummings KM, Hyland AJ, Repace J, Babb S, Pachacek T, et al. Indoor air quality in hospitality venues before and after the implementation of a clean indoor air law-Western New York. Morbidity & Mortality Weekly Report. 2004;56:501–504. doi:10.1097/01.COT.0000291669.36813.6f. [PubMed] [Google Scholar]
- U.S. Census Bureau. 2005-2007 American community survey three year estimates. 2009. Retrieved August 06, 2009, from http://factfinder.census.gov/ [Google Scholar]
- U.S. Department of Health and Human Services. The health consequences of involuntary smoking: A report of the surgeon general. Rockville, MD: U.S. Department of Health and Human Services, Public Health Service, Centers for Disease Control and Prevention, Center for Health Promotion and Education, Office on Smoking and Health; 1986. [Google Scholar]
- U.S. Department of Health and Human Services. The health consequences of involuntary exposure to tobacco smoke: A report of the surgeon general. Atlanta, GA: U.S. Department of Health and Human Services, Centers for Disease Control and Prevention, Coordinating Center for Health Promotion, National Center for Chronic Disease Prevention and Health Promotion, Office on Smoking and Health; 2006. [Google Scholar]
- U.S. Department of Health and Human Services. The surgeon general's call to action to promote healthy homes. Atlanta, GA: U.S. Department of Health and Human Services, Office of the Surgeon General; 2009. [PubMed] [Google Scholar]
- U.S. Department of Housing and Urban Development. Memo to regional directors; state and area coordinators; public housing hub directors; program center coordinators; troubled agency recovery center directors; special applications center director; public housing agencies; resident management corporations; healthy homes representatives. 2009. 17 July, 2009. Notice: PIH-2009-21 (HA). Retrieved August 07, 2009, from http://www.hud.gov/offices/pih/publications/notices/09/pih2009-21.pdf. [Google Scholar]
- U.S. Environmental Protection Agency. Respiratory health effects of passive smoking (also known as exposure to secondhand smoke or environmental tobacco smoke-ETS) Washington, DC: U.S. Environmental Protection Agency, Office of Research and Development, Office of Health and Environmental Assessment; 1992. EPA/600/6–90/006F. [Google Scholar]
- Van Deusen A, Hyland AJ, Travers MJ, Wang C, Higbee C, King BA, et al. Secondhand smoke and particulate matter exposure in the home. Nicotine & Tobacco Research. 2009;11:635–641. doi: 10.1093/ntr/ntp018. doi:10.1093/ntr/ntp018. [DOI] [PubMed] [Google Scholar]
- Wallace L. Indoor particles: A review. Journal of the Air & Waste Management Association. 1996;46:98–126. doi: 10.1080/10473289.1996.10467451. [DOI] [PubMed] [Google Scholar]