

Background: The role of Snf1 in Adr1-dependent transcription is incompletely understood.
Results: Adr1 and RNA pol II remain at the promoter but are inactive, and mRNA decay is accelerated when Snf1as is inhibited after glucose depletion.
Conclusion: Snf1 is important for Adr1 binding, RNA pol II activity, and mRNA stability.
Significance: Snf1 has an unanticipated role in promoting mRNA stability.
Keywords: AMP-activated Kinase, Gene Regulation, RNA Turnover, Transcription, Transcription Factors, Transcription Regulation
Abstract
AMP-activated protein kinase, the “energy sensor of the cell,” responds to low cellular energy stores by regulating enzymes and transcription factors that allow the cell to adapt to limiting nutritional conditions. Snf1, the yeast ortholog of AMP-activated protein kinase, has an essential role in respiratory metabolism in Saccharomyces cerevisiae that includes activating the transcription factor Adr1. How Snf1 regulates Adr1 activity is poorly understood. We used an analog-sensitive allele, SNF1as(I132G), that is inhibited by 2-naphthylmethyl pyrazolopyrimidine 1 to study the role of Snf1 in transcriptional regulation of glucose-repressible genes. When Snf1as was inhibited at the time of glucose depletion, there was a promoter-specific response with some Snf1-dependent genes being activated by low levels of inhibitor, whereas all Snf1-dependent genes were inhibited at high levels. Transcript accumulation was more sensitive to Snf1as inhibition than Adr1 or RNA polymerase (pol) II binding or acetylation of promoter nucleosomes. When Snf1as was inhibited after gene activation, Adr1 and RNA pol II remained at promoters, and RNA pol II remained in the ORF with associated nascent transcripts. However, cytoplasmic mRNAs were lost at a rapid rate compared with their decay following chemical or genetic inactivation of RNA pol II. In conclusion, Snf1 appears to affect multiple steps in gene regulation, including transcription factor binding, RNA polymerase II activity, and cytoplasmic mRNA stability.
Introduction
Yeast cells respond to altered levels of glucose in their environment by dramatic changes in their transcriptional program. Glucose represses the expression of genes required for oxidative metabolism during the fermentative phase of yeast growth, a phenomenon called glucose catabolite repression or simply glucose repression. During the diauxic transition, a switch from fermentative to oxidative metabolism occurs and is accompanied by a major re-programming of gene expression at both the transcriptional (1) and post-transcriptional levels (2). Oxidative metabolism requires increased synthesis of mitochondrial respiratory chain and tricarboxylic acid cycle enzymes, as well as activation of gluconeogenesis and the glyoxylate cycle. In addition, genes are activated that encode enzymes required for breakdown of fatty acids and uptake and metabolism of amino acids, ethanol, acetate, lactate, and glycerol.
The AMP-activated protein kinase (known as Snf1 in yeast) is an important regulator of metabolism (3) and plays a major role in the release from glucose repression (4–7). SNF1 encodes the catalytic subunit of the trimeric kinase complex that responds to glucose starvation by phosphorylating key enzymes in metabolism and transcription. In the presence of glucose, Snf1 is maintained in a mostly nonphosphorylated inactive form by the Glc7 protein phosphatase in association with its regulatory subunit Reg1 (8). When glucose is exhausted, Snf1 is activated by phosphorylation of Thr-210 by three upstream kinases (9) and the down-regulation of Reg1-Glc7 protein phosphatase activity (10). Recent evidence suggests that Snf1 activation may also involve ADP (11–13).
Snf1 regulates transcription in numerous ways, including transcription factor activation and inactivation (14–19), modification of chromatin (20–22), and perhaps by acting directly on the transcription apparatus (23). Snf1 also has a role in post-transcriptional regulation of gene expression. Snf1 transcriptionally down-regulates expression of genes encoding amino acid biosynthetic enzymes (24) by inhibiting translation of the master regulator Gcn4 (14).
Adr1 and Cat8 are DNA binding transcription factors that are activated by Snf1 when glucose is exhausted (7). Snf1 activates Cat8 by direct phosphorylation but activates Adr1 by promoting its dephosphorylation (6, 18). Together they activate over 300 target genes involved in metabolic pathways that allow growth in the absence of a fermentable carbon source (25–27). Many of these genes are regulated directly by binding of Adr1 and/or Cat8 to their promoters (28).
ADR1 regulation is primarily post-translational. ADR1 is transcribed constitutively, and the Adr1 protein is present but inactive during growth in the presence of high levels of glucose or other fermentable sugars (29, 30). Relief from glucose repression (derepression) is accompanied by promoter binding of Adr1 in a Snf1-dependent fashion (31) and requires Snf1-dependent histone H3 hyperacetylation of promoter nucleosomes (20, 32). Chromatin remodeling precedes and is required for gene activation and requires Snf1, Adr1, and Cat8, which recruit the Swi/Snf chromatin remodeling complex as well as the SAGA (Spt-Ada-Gcn5 acetyltransferase), and NuA4 histone acetyltransferase complexes (33, 34). Impaired histone deacetylase activity or deletion of the histone H3 or histone H4 tail allows Adr1 binding and preinitiation complex (PIC) formation in the presence of glucose (32, 35, 36). However, transcription is defective in the hdacΔ mutant despite the presence of a PIC, suggesting that a step subsequent to PIC formation is inhibited by the presence of glucose. Activating Snf1 and the presence of a constitutive nonphosphorylatable allele of Adr1 (ADR1c, e.g. ADR1-Ser-230A) can activate the “poised” and inactive PIC in the presence of glucose (35). Activation by Adr1c is due to the inability of 14-3-3 (known as Bmh in yeast) proteins to inhibit the constitutive activators, presumably because Bmh binding requires phosphorylation of Ser-230 (37). Snf1 has a role in overcoming Bmh-mediated inhibition because it promotes dephosphorylation of Ser-230 (18). However, Snf1 has a second role in activating the poised complex because the two effects, constitutively active Adr1c and activated Snf1, are synergistic with regard to gene expression (38).
Activation of the glucose-inhibited PIC by Snf1 in an hdacΔ mutant suggests that Snf1 might also have a role in gene activation subsequent to promoter binding. However, because Adr1 does not bind target promoters in the absence of Snf1, whether Snf1 has a role in PIC formation or activation independent from activator binding or in post-transcriptional processes of gene regulation has not been investigated.
The development of conditional kinase alleles that are specifically and efficiently inhibited by ATP analogs has greatly facilitated the study of protein kinases in yeast (39). Analog-sensitive (as) alleles have mutations in the gatekeeper residue of the active site that allow binding of nonhydrolyzable ATP analogs and block the kinase activity. A SNF1as allele, I132G, has been used to identify an inhibitory role of Snf1 in Gcn4-dependent gene activation (24) and to study the interaction of Snf1 with other nutrient-regulated pathways in yeast (40). If there were multiple inter-dependent steps in a pathway, such as we envision for Snf1, chemical inhibition would allow the individual steps to be distinguished. Specifically, chemical inhibition can be used to investigate whether Snf1 has a role in gene expression subsequent to transcription factor binding.
We used an analog-sensitive allele of Snf1 to study the regulation of expression of glucose-repressible genes, particularly those that are targets of Adr1 and Cat8. Inhibiting Snf1 before derepression had an unexpected promoter-specific effect on gene expression. Derepression of weakly expressed genes was enhanced at low concentrations of the inhibitor, although the expression of highly expressed genes was inhibited at all concentrations. When Snf1 was inhibited during derepression, mRNA accumulation immediately ceased, and the level of Snf1-dependent mRNAs decreased at a rapid rate. In contrast, Adr1 and RNA pol2 II binding, as well as hyperacetylation of histone H3, persisted. Thus, Snf1 appears to have an epigenetic effect, due to Snf1-dependent histone hyperacetylation, that allows Adr1 and RNA pol II to remain associated with DNA at the promoter after Snf1as is inactivated. Even though RNA pol II persists in the ORF with associated nascent transcripts, transcription appears to be inhibited, and the loss of Snf1as activity is associated with rapid cytoplasmic decay of transcripts from glucose-repressible genes.
EXPERIMENTAL PROCEDURES
Yeast Strains and Growth of Cultures
Saccharomyces cerevisiae strains used in this study are listed in Table 1. S. cerevisiae cultures were grown with shaking at 30 °C in either yeast extract/peptone medium (YP) or in synthetic medium lacking the appropriate amino acid or nucleotide for plasmid selection (SM (41)). To maintain selection for plasmids containing TRP1, the synthetic selective medium contained 0.2% casamino acids rather than the standard dropout solution. Deletion and tagging of chromosomal genes used published methods and plasmids (42, 43). For growth in repressing conditions, with high glucose, the medium contained 3% glucose. Derepressing (DR) medium contained 0.05% glucose. In a typical experiment, the cells were grown in repressing medium to an A600 = 0.7–1.0, pelleted by centrifugation in a Sorvall RC3B-plus centrifuge at 3000 rpm at room temperature, resuspended at an A600 = 1.0 in derepressing medium containing 0.05% glucose, and aerated by vigorous swirling at 250 rpm.
TABLE 1.
Saccharomyces cerevisiae strains
| W303-1a also known as CKY19 | MATa ade2-1 can1-100 ura3-1 leu2-3,112 trp1-1 his3-11,15 | K. Dombek |
| CKY20 | MATα ade2-1 can1-100 ura3-1 leu2-3,112 trp1-1 his3-11,15 | K. Dombek |
| CKY18 | CKY20 snf1Δ::kanmx | K. Dombek |
| TYY923, TYY924, TYY925 | CKY18 ura3-1::pSH47:SNF1as (URA3) | This work |
| TYY1077, TYY1078 | TYY923 ADR1-Myc13 | This work |
| CKY10 | CKY19 snf1Δ::kanmx reg1Δ::natmx | This work |
| TYY1085 | CKY10 ura3-1::pSH47:SNF1as (URA3) | This work |
| KBY108 | MATa rpb1-1 ura3-1::pSH47:SNF1as (URA3) snf1Δ::kanmx ADR1-Myc13::natmx | This work |
Chromatin Immunoprecipitation (ChIP)
Protein extracts from yeast cells were prepared following the procedure described in Parua et al. (37). Chromatin immunoprecipitation was performed as described in Biddick et al. (34). In brief, cells from a 50-ml culture at an A600 ∼1 were pelleted at 3000 rpm at room temperature in a Sorvall RC3B-plus centrifuge and resuspended in 8.75 ml of phosphate-buffered saline (PBS). Ethylene glycol bis(succinimidylsuccinate) (Thermo Scientific, catalog no. 21565) cross-linker dissolved in DMSO was added to a final concentration of 3 mm, and the sample was swirled at room temperature for 45 min. The ethylene glycol bis(succinimidylsuccinate) cross-linked cells were pelleted at room temperature and resuspended in 25 ml of 1× PBS supplemented with 1% formaldehyde. After shaking gently for 15 min at room temperature, 2.5 ml of 2.5 m glycine was added, and the cells were pelleted. The cell pellet was washed once with 10 ml of tris-buffered saline (TBS) containing 125 mm glycine and resuspended in 1 ml of a cold TBS-containing protease inhibitor mixture (Sigma, catalog no. S8830) and a mixture of phosphatase inhibitors. The phosphatase inhibitors were prepared in two 100-fold concentrated solutions. Solution 1 contained 200 mm imidazole, 100 mm NaF, 400 mm sodium tartrate, 115 mm disodium molybdate, and 100 mm β-glycerol phosphate. Solution 2 contained sodium orthovanadate prepared as a separate solution because a basic pH (∼10) is required to maintain the active form of orthovanadate. After transfer to a microcentrifuge tube, the cells were pelleted by brief centrifugation, frozen on dry ice, and stored at −80 °C. For cell breakage, the pellet was thawed on ice; 0.40 ml of ChIP lysis buffer (50 mm Hepes-KOH, pH 7.5, 140 mm NaCl, 1% Triton X-100, 0.1% sodium deoxycholate) containing protease and phosphatase inhibitors was added, and the cells were broken with glass beads in a FastPrep machine with two disruption cycles of 45 s at a speed setting of 4.5. The unbroken cells and debris were pelleted by centrifugation at 4 °C in a microcentrifuge at 13,000 rpm for 10 min. The clarified extract was collected in a fresh microcentrifuge tube containing 1 mm PMSF. Immunoprecipitation (IP) was performed for 4–16 h in ChIP lysis buffer containing 0.5–2 mg of protein extract (35) with constant nutation at 4 °C. In some experiments, denatured salmon sperm DNA at a final concentration of 10 μg/ml was included. The antibodies used were anti-c-Myc (9E10; Santa Cruz Biotechnology, Sc40), anti-pol II (8WG16; ChIP grade, Abcam, Ab817), anti-pol II C-terminal domain (CTD) Ser(P)-2 (Abcam, Ab5095), anti-pol II CTD Ser(P)-5 (Abcam, Ab5195), and anti-histone H3-K9,14 (Millipore, 06599). After IP, 20–60 μl of protein A-coated MagSepharose beads from GE Healthcare (catalog no. 28-9670-62) were added, and nutation was continued for 2–4 h at 4 °C. After separating the beads, 10 μl of the supernatant was added to 150 μl of ChIP elution buffer (50 mm Tris-HCl, pH 8.0, 1% SDS, 10 mm EDTA) for measuring the amount of input DNA. The beads were processed by washing twice with ChIP lysis buffer containing 10 μg/ml denatured salmon sperm DNA, twice with high salt ChIP lysis buffer (ChIP lysis buffer with 0.5 m NaCl), twice with ChIP wash buffer (10 mm Tris-HCl, pH 8.0, 250 mm LiCl, 10 mm EDTA, 0.5% Nonidet P-40, 0.5% sodium deoxycholate), and twice with ChIP TE (0.01 m Tris-HCl, pH 7.5, 0.1 mm EDTA). The bound DNA was eluted at 65 °C for 10 min with 50 μl of elution buffer. The eluted and input DNAs were incubated for 12–16 h at 65 °C and then purified using a PCR purification kit according to the manufacturer's protocol (Qiagen). The eluted and input DNAs were diluted 10- and 100-fold, respectively, and quantification of specific sequences was performed by qPCR using Power SYBR Green master mix (Applied Biosystems) in a PTC-200 thermocycler coupled to a Chromo 4 continuous fluorescence detector (MJ Research). Opticon 3 software (MJ Research) was used for the data analysis. Occupancy of a protein is expressed as fold-increase of the IP to input ratio of the amount of the specific amplicon for the gene sequence over the IP to input ratio corresponding to the amplicon for the telomeric sequence TEL-VI-R. Primers used for ChIP analysis are available on request.
mRNA Isolation and Quantitative Real Time Reverse Transcriptase PCR (RT-qPCR)
mRNA was isolated from strains grown in either repressing or derepressing medium using the acid phenol method described by Collart and Oliviero (44) or using an RNeasy kit from Qiagen. Residual DNA in the RNA preparation was reduced by treatment with DNase I (Ambion) following the manufacturer's recommendations. cDNA synthesis was performed using 1 μg of total RNA with SuperScript III (Invitrogen) following the manufacturer's protocol. In most experiments, oligo(dT) alone was used as a primer; in later experiments, both oligo(dT) and random hexamer primers were used. RT-qPCR was performed using a 1:50–1:300 dilution of the cDNA, depending on the experiment. A standard curve was generated using ACT1 primers and was used to quantify all of the RNA levels. Specific mRNA levels are expressed as a ratio to the amount of ACT1 mRNA present. ACT1 mRNA levels are relatively insensitive to the carbon source in the medium and were unaffected by inhibiting Snf1as (supplemental Fig. 2). Samples were prepared from biological duplicate or triplicate cultures and analyzed by qPCR in duplicate or triplicate. Primers used for RNA expression analysis are available upon request.
Measurement of mRNA Half-lives
RNA synthesis was inhibited either with 1,10-o-phenanthroline (0.1 mg/ml final concentration) or by raising the temperature of a culture of a strain containing the rpb1-1 allele of the largest subunit of RNA pol II (45). 1,10-o-Phenanthroline was dissolved at 100× concentration in 95% ethanol and used the same day. The temperature of a rpb1-1 culture was raised rapidly from 25 to 36.5 °C by adding the desired volume of culture to a flask immersed in a beaker of 70 °C water and swirling vigorously until the temperature reached 37 °C as measured by a thermometer in the flask. Subsequently, the culture flask was agitated in a water bath at 36.5 °C. mRNA was quantitated by RT-qPCR as described above and plotted after normalization to the amount of an 18 S ribosomal RNA reference. The ribosomal RNA was converted to cDNA using random hexamers. The 50% intercept of the decay curve, log(%mRNA) versus time, was taken as the half-life. To determine the apparent half-lives of mRNAs after adding glucose or the Snf1as inhibitor 2NM-PP1 to a culture growing in derepressing conditions, the same procedure was followed except ACT1 was generally used as a reference.
β-Galactosidase Assays
β-Galactosidase assays were performed as described by Guarente (46) after growing the cells at 30 °C in selective medium containing 3% glucose for repressing cultures and 0.05% glucose for DR cultures. The values in Miller units are the averages of three transformants.
RESULTS
2NM-PP1 Is a Potent and Specific Inhibitor of Snf1as (SNF1-I132G)
To determine the concentration of 2NM-PP1 needed to inhibit expression of a highly transcribed Adr1- and Snf1-dependent gene, we measured derepression of an ADH2-lacZ reporter gene containing the ADH2 regulatory region and promoter with the first 23 amino acids of the ADH2 ORF fused to the Escherichia coli lacZ gene encoding β-galactosidase (pBGM23 (47)). Inhibition of β-galactosidase activity was detected at 0.1 μm 2NM-PP1, and greater than 97% inhibition occurred at 10 μm so this concentration range was used for subsequent experiments (supplemental Fig. 1). Shirra et al. (24) used a concentration of 25 μm 2NM-PP1 in their studies and found a strong reduction of SUC2 mRNA levels after 40 min of treatment of S. cerevisiae strain S288C.
To test for nonspecific effects in our strain, we assayed the expression of several Snf1-independent genes in a SNF1as strain (TYY1077) treated with 2NM-PP1 (ADH1, ACT1, and TAF1), and we also measured the expression of Snf1-dependent genes in a WT SNF1 strain treated with 2NM-PP1(ADH2, ADY2, and CTA1). We did not detect any off-target effects of the inhibitor on the expression of Snf1-dependent or Snf1-independent genes (supplemental Fig. 2).
Snf1as Inhibitor 2NM-PP1 Has a Differential Effect on Gene Expression
We analyzed the dose-response curve of 2NM-PP1 inhibition of Snf1as using quantitative RT-qPCR to analyze expression of Snf1-dependent genes. 2NM-PP1 was added to separate cultures at the time of glucose depletion to provide a 200-fold range of final concentrations, and mRNA levels were determined 4 h later. Expression of all the Snf1-dependent genes we assayed was strongly inhibited at 20 μm 2NM-PP1. At intermediate concentrations, we found a surprisingly large variation in the response to 2NM-PP1, ranging from strong inhibition to 10-fold activation of gene expression. Fig. 1A shows the data for ADH2, ICL1, and POX1 mRNAs, and supplemental Fig. 3 shows the mRNA levels of these and 17 additional Snf1-dependent genes.
FIGURE 1.

Inhibition of gene expression by the Snf1as inhibitor 2NM-PP1. Cultures of strains TYY923, TYY924, and TYY925 (all SNF1as) were grown in 200 ml of YPD medium to an A600 = 0.8 at 30 °C. Duplicate samples of 10 ml were removed for RNA isolation, and the cells in the remainder of the culture were pelleted and resuspended in 200 ml of YP medium containing 0.05% glucose and subsequently treated as described below. Each culture was divided into six equal portions after resuspension in low glucose and agitated vigorously at 30 °C. One portion received DMSO, the solvent for 2NM-PP1 as a control. The remaining five cultures received an amount of 2NM-PP1 to make the final concentration shown in the figure. Triplicate samples of 10 ml were collected for RNA isolation 4 h after resuspending the cells in low glucose medium (derepressing conditions). A, differential effects of Snf1as inhibition on gene expression. mRNA levels were measured by RT-qPCR and normalized against ACT1 mRNA, which was unaffected by the inhibitor (supplemental Fig. 2B), and are expressed as the percentage of the mRNA amount measured in the absence of inhibitor. The control culture is represented in the figure as having 0.01 μm 2NM-PP1 to display the data on a log scale. The error bars represent the standard deviation from three biological replicates. The experiment was repeated twice with similar results. B, Snf1as inhibition is correlated with promoter strength. The concentration of 2NM-PP1 that caused a 50% reduction in mRNA levels at 4 h was plotted against the relative level of mRNA (normalized to ACT1) at 4 h in the absence of inhibitor. The data are from supplemental Fig. 3 and similar data.
There was a positive correlation between sensitivity to the inhibitor and the level of a Snf1-dependent mRNA in its absence (Fig. 1B). The expression of the most active genes, such as ADH2 and ALD4, was inhibited at the lowest concentration of 2NM-PP1, whereas the least active genes such as FAA2, POX1, and FOX2 were the most resistant to inhibition and were activated up to 10-fold at low concentrations of inhibitor. Genes involved in gluconeogenesis and the glyoxylate cycle, such as FBP1, ICL1, and MLS1, had an intermediate sensitivity. The differential sensitivity to Snf1as inhibition might explain why Zaman et al. (40) found relatively few transcripts that were Snf1-dependent in their microarray analysis of nutrient-regulated genes compared with earlier work (25). The differential response to Snf1as inhibition was unexpected and suggests that different genes require different levels of Snf1 for optimal expression.
In summary, the response to Snf1as inhibition under DR conditions did not produce a simple dose-response relationship as expected. ADH2, ACS1, and POX1 represent Adr1-bound and-dependent genes spanning this spectrum of sensitivities. Therefore, we assayed expression and binding of these three genes in most of the subsequent studies.
Low Levels of Active Snf1as Suffice for Adr1 Binding
One possible explanation for the differential effect of inhibiting Snf1as on gene expression is that Adr1 binding at different promoters may require different levels of Snf1 activity. Adr1 was tagged with 13 Myc epitopes in a SNF1as strain (TYY1077), and binding was measured by ChIP followed by qPCR. Surprisingly, Adr1-Myc binding was relatively resistant to inhibition of Snf1as (Fig. 2A). The level of binding of ADR1 showed a poor correlation with the mRNA levels for ADH2, ACS1, and POX1. For example, at the ADH2 promoter (ADH2prm) Adr1 binding was reduced only 40% at 1 μm 2NM-PP1, but ADH2 mRNA levels had been reduced to 1% at the same concentration of inhibitor. This discrepancy was also observed for CTA1, ICL1, and POT1 (data not shown).
FIGURE 2.

Chromatin immunoprecipitation analysis of Adr1 and RNA pol II binding and histone H3-K9,14 acetylation. Triplicate cultures of Snf1as strain TYY1077 were grown in YPD containing 3% glucose. At A600 ∼1.0, the cells were pelleted and resuspended in YP plus 0.05% glucose with the indicated amounts of 2NM-PP1 or with DMSO (final concentration 0.05%) in the control culture lacking 2NM-PP1. After 4 h of derepression, samples were collected for ChIP and RNA analysis. A, Adr1-Myc binding. Adr1-Myc binding was measured by qPCR after ChIP was performed as described under “Experimental Procedures.” The binding value represents the ratio of (ChIP(geneX)/input(geneX))/(ChIP(tel)/input(tel)). The control sample lacking 2NM-PP1 was set to 100%. The error bars represent the standard deviation of three biological replicates. B, RNA pol II binding. ChIP was performed using the extracts described above. ChIP grade anti-pol II antisera 8WG16 was used, and binding was determined as described under “Experimental Procedures.” C, histone H3-K9,14 acetylation. Strain TYY1077 was grown in YPD and derepressed in the presence of the indicated concentrations (in μm) of the Snf1as inhibitor 2NM-PP1 or 0.05% DMSO (0 inhibitor) for 4 h. Another culture was derepressed for 3.5 h in the absence of inhibitor, and then inhibitor was added for 30 min before a sample was prepared for ChIP. Levels of histone H3-K9,14 acetylation were measured by ChIP as described under “Experimental Procedures.” H3-K9,14 acetylation at the indicated genes (transcription start sites) is expressed relative to acetylation at the ACT1 transcription start sites. D, comparison of Adr1 and RNA pol II binding, histone H3-K9,14 acetylation, and transcript levels of ADH2. The data are from A–C. The transcript levels for ADH2 were determined using aliquots from the same cultures that were sampled for ChIP analysis.
Adr1 was detected at ADH2prm, ACS1prm, and POX1prm at the highest concentration of Snf1as inhibitor used, but in a snf1Δ strain the binding cannot be detected (31). This result suggests either that a low level of active Snf1 in repressed cells allows Adr1 to bind during derepression in the presence of 2NM-PP1 or that inhibition is incomplete and that Snf1 is activated during derepression in the presence of 2NM-PP1. The latter explanation is probably correct. When Snf1as was inhibited before glucose depletion and the cells were derepressed in the presence of inhibitor for 4 h, there was a higher level of Adr1 binding than in repressed cells (supplemental Fig. 4). Thus, it appears that a small amount of Snf1as, activated after derepression despite the presence of the inhibitor, suffices for binding of Adr1 after glucose is depleted. In addition the amount of active Snf1as required for Adr1 binding was promoter-dependent, being higher for ADH2 than for POX1. Both experiments (Fig. 2A and supplemental Fig. 4) suggest that promoter-bound Adr1 is unable to efficiently activate transcription when Snf1as is inhibited, and there is a subsequent Snf1-dependent step(s) in gene expression that requires a higher level of Snf1 activity than Adr1 binding.
RNA pol II Recruitment Is More Sensitive to Snf1as Inhibition than Is Adr1 Binding
Although Adr1 is associated with promoter DNA after inhibiting Snf1as, it may be unable to recruit RNA pol II, and this may explain the low level of target mRNAs. To determine the importance of Snf1as activity for RNA pol II recruitment, we used ChIP to measure RNA pol II occupation of Snf1-dependent promoters at different inhibitor concentrations (Fig. 2B). RNA pol II binding was more sensitive to Snf1as inhibition than was Adr1 binding, but it was less sensitive than ADH2 mRNA accumulation. This can be seen by comparing the data in Figs. 1A and 2, A and B. For example, when an intermediate concentration of inhibitor was added (1.0 μm) at the time of glucose depletion, the amount of RNA pol II at the ADH2 promoter was reduced about 10-fold. At this concentration of inhibitor ADH2 mRNA levels and Adr1 binding were reduced about 30- and ∼2-fold, respectively.
Snf1-dependent Histone H3-K9,14 Hyperacetylation Is Partially Refractory to Snf1as Inhibition
Adr1 binding requires Snf1-dependent hyperacetylation of promoter nucleosomes. Therefore, we performed ChIP for histone H3 acetylated on Lys-9 and Lys-14 to assess the possible involvement of acetylation on Adr1 and RNA pol II binding at the ADH2, POX1, and ACS1 promoter regions when Snf1as was inhibited (Fig. 2C). All three promoters had a low level of H3-K9,14 acetylation in repressing growth conditions that increased dramatically after derepression in the absence of inhibitor. The response to 2NM-PP1 addition was complex. At 10 μm 2NM-PP1, acetylation was reduced nearly to the level observed in repressed cells at all three promoters. However, at 0.1 μm 2NM-PP1, acetylation increased at ADH2prm and ACS1prm. There was a reduced level of acetylation at 1 μm 2NM-PP1 at all three promoters. When the inhibitor was added 3.5 h after glucose depletion and H3-K9,14 levels were measured 30 min later, acetylation at several Adr1-dependent promoters was unchanged compared with the untreated culture (Fig. 2C). Therefore, continuous Snf1as activity is not needed to maintain a high level of H3-K9,14 acetylation at these promoters.
Fig. 2D compares the relative level of Adr1 and RNA pol II binding, gene expression, and H3-K9,14 acetylation for ADH2 (data from Figs. 1A and 2, A–C). Adr1 binding and H3-K9,14 acetylation had similar responses to Snf1as inhibition, suggesting that high acetylation levels are important for binding and that a low level of active Snf1as suffices for histone acetylation and for Adr1 binding. RNA pol II binding is more sensitive to Snf1as inhibition than is Adr1 binding or H3-K9,14 acetylation, and all three processes are more resistant to Snf1as inhibition than is target mRNA accumulation. Based on these observations, Snf1as appears to be important for a step or steps in mRNA accumulation that occurs after formation of a PIC. In addition the gene expression and histone H3 acetylation data suggest that the normal level of Snf1 may not be optimal for maximum activation and H3 acetylation of some promoters. However, the increased mRNA levels that were observed at intermediate levels of Snf1as inhibition for the peroxisomal and β-oxidation genes, such as CTA1, POT1, and POX1, was not associated with increased Adr1 or RNA pol II binding to those promoters. Instead, it seems likely that the increased mRNA levels are due to post-transcriptional processes, as described below.
Snf1 Activity Is Needed Continuously for mRNA Accumulation during Derepression
Because Snf1 is essential for promoter binding of Adr1 (31), whether it has a role subsequent to activator binding, has not been investigated. Chemical inhibition of Snf1as allowed us to assess the importance of Snf1 activity after transcription had commenced by depleting cells of glucose to allow derepression to occur and then by adding 2NM-PP1 to inhibit Snf1as activity. We first measured β-galactosidase activity derived from an ADH2-lacZ gene fusion 9 h after depleting the cells of glucose. Inhibitor was added at various times between glucose depletion (0 h) and 9 h. Accumulation of β-galactosidase activity ceased abruptly when 2NM-PP1 was added (supplemental Fig. 5) indicating that Snf1 activity is needed continuously for expression of ADH2-lacZ but does not distinguish which step(s) in gene expression is Snf1-dependent, continued activator binding, PIC formation, or mRNA stability.
To determine which step(s) in gene expression was inhibited, we first measured mRNA levels during derepressing growth conditions after adding 2NM-PP1 at 4 h. As shown in Fig. 3A, accumulation of ADH2 and POX1 mRNAs stopped abruptly, and the amount of mRNA began to decline rapidly after Snf1as was inhibited. The amount of FBP1 mRNA was already decreasing, and its decline was accelerated by inhibiting Snf1as. A similar effect was observed for 12 other SNF1-dependent transcripts (data not shown). These genes were transcribed by various transcription factors, including Adr1, Cat8, Hap1, Oaf1/Pip2, and Ino2/4, so the effect was not restricted to any one activator. As a control, the effect of inhibiting Snf1as on ADH1 expression was measured. Rather than being inhibited, ADH1 expression was stimulated by inhibiting Snf1as 4 h after glucose depletion (supplemental Fig. 2D), as occurs for many genes expressed in glucose-replete conditions (24, 25, 40). The positive effect on ADH1 expression confirms that inhibiting Snf1as does not cause a global inhibition of transcription in glucose-depleted conditions.
FIGURE 3.
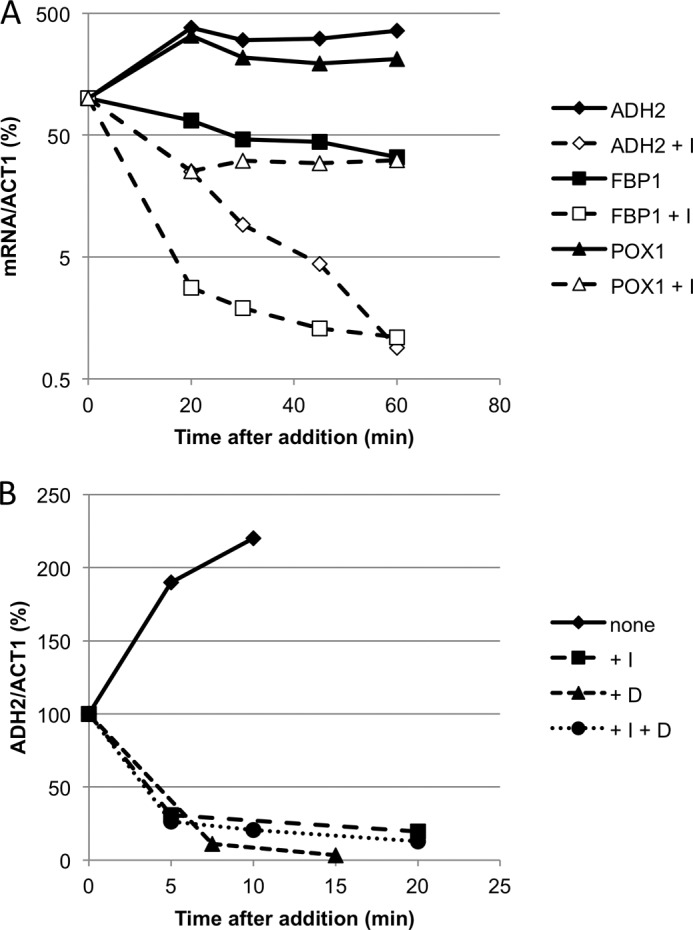
Snf1 activity is needed continuously during derepression to maintain high transcript levels for ADH2, FBP1, and POX1. A, mRNA accumulation stops abruptly when Snf1as is inhibited. Strain TYY925 (SNF1as) was grown in 200 ml of YPD with 3% glucose. After removing 2–10-ml aliquots for RNA isolation representing repressing growth conditions, the remaining cells were collected by centrifugation and resuspended in 200 ml of YP with 0.05% glucose. After a subsequent 4-h incubation in derepressing conditions with vigorous shaking, 2NM-PP1 was added to a final concentration of 10 μm to a 100-ml portion of the culture. Another 100-ml portion of the culture received DMSO, the 2NM-PP1 solvent, at a final concentration of 0.05% to serve as the “no inhibitor” control. Samples of 10 ml were pipetted into 50-ml Falcon centrifuge tubes containing 10 g of ice at 0, 20, 30, 45, and 60 min after inhibitor (or DMSO) addition, and the cells were collected for RNA isolation and analysis. Triplicate samples were collected at 4 h, and the average of these values was used to calculate the relative mRNA level for each gene (compared with ACT1), expressed as the percentage of the transcript level present at 4 h. B, glucose addition and Snf1as inhibition affects ADH2 mRNA levels similarly. Strain TYY1077 was grown and derepressed as described above. After 4 h of derepression, cultures received 2NM-PP1 (I, final 10 μm), glucose (D, final 3%), or 2NM-PP1 and glucose (10 μm and 3% final concentrations, respectively) or DMSO (0.05% final concentration). Samples of 10 ml were removed at the indicated times, and RNA was isolated and analyzed by RT-qPCR. Duplicate samples were prepared after 4 h of derepression, and the average of these values was used to calculate the relative mRNA level (compared with ACT1) after inhibitor addition, expressed as the percentage of the transcript level present at 4 h.
Re-establishing glucose repression had a similar effect as inhibiting Snf1as. As shown in Fig. 3B, when 2NM-PP1, glucose, or 2NM-PP1 plus glucose was added, a similar rapid decrease in ADH2 mRNA accumulation was observed in all three situations, suggesting that glucose addition and inhibiting Snf1as may affect the same process leading to rapid disappearance of ADH2 mRNA. Glucose-triggered mRNA decay has been reported for several glucose-repressible genes (2, 48, 49), but the involvement of Snf1 in the mechanism of glucose-induced decay has not been reported.
Snf1 Activity Is Not Needed to Maintain Promoter Occupancy of Adr1
The cessation of target mRNA accumulation and its subsequent decrease could be due to dissociation of Adr1 and RNA pol II from the promoter with attendant arrest of transcription and normal mRNA decay. To see if Adr1 requires continuous Snf1as activity to remain promoter-bound, 2NM-PP1 or glucose was added 2 h post-glucose depletion, and samples were taken for ChIP and mRNA analyses at the same time and 0.5, 1, and 2 h later. Surprisingly, Adr1 remained at ADH2prm for up to 2 h post-Snf1as inhibition (Fig. 4A). Similar Adr1 occupancy was observed four other Adr1-dependent promoters (POX1, ACS1, ADY2, and POT1; supplemental Fig. 6A and data not shown). In striking contrast, glucose addition caused a complete loss of Adr1 occupation at all of these promoters within 30 min (Fig. 4A, supplemental Fig. 6A, and data not shown). Analysis of mRNA levels in this experiment confirmed that accumulation was arrested by inhibiting Snf1as and by adding glucose (data not shown). Thus, mRNA accumulation but not Adr1 binding requires continuous Snf1 activity during glucose-depleted derepressing growth conditions, and glucose can rapidly reverse the function of Snf1 that is needed for Adr1 binding. These data demonstrate that glucose repression of gene expression is not equivalent to inhibiting Snf1as.
FIGURE 4.

Continuous Snf1 activity is not needed for Adr1 and RNA pol II binding, histone H3-K9,14 acetylation, or RNA pol II CTD phosphorylation. A, Adr1-Myc binding after inhibiting Snf1as and adding glucose. Adr1-Myc binding in strain TYY1077 was measured by ChIP after derepression as described in the legend to Fig. 2, but the cultures were derepressed for only 2 h in low glucose medium. The final concentration of 2NM-PP1 was 10 μm. Duplicate 60 samples were removed at the times indicated. A 10-ml portion of this sample was used for RNA preparation and analysis. The remaining 50 ml was used for ChIP analysis for Adr1-Myc13 as described under “Experimental Procedures.” ChIP-grade monoclonal antibody 9E10 from Santa Cruz Biotechnology (anti-Myc) was used. The data are expressed as binding (ChIP/input) for ADH2prm relative to ChIP/input at the TEL region used as a reference. B, histone H3-K9,14 acetylation after inhibiting Snf1as or adding glucose. Strain TYY1077 was grown and treated as described in the Fig. 2 legend. ChIP for K9,14-acetylated histone H3 was performed using anti-histone H3-K9,14 antisera from Santa Cruz Biotechnology as described under “Experimental Procedures.” The data are expressed as the ratio of ChIP/input without normalizing to the level of acetylation at the TEL region that changed less than 2-fold with any of the treatments. C and D, RNA pol II remains bound to the ADH2 transcription start sites (tss) and ORFs after inhibiting Snf1as. Growth and treatment of the cells is described in the Fig. 2 legend. RNA pol II binding was measured by ChIP as described under “Experimental Procedures” using ChIP-grade Abcam anti-pol II antibody 8WG16. The data are expressed as binding (ChIP/input) for ADH2tss and POX1tss relative to ChIP/input at the TEL region used as a reference. E and F, RNA pol II CTD associated with ADH2 is phosphorylated on Ser-2 and Ser-5 after Snf1as inhibition. The cultures for ChIP analysis were derepressed for 6 h (none), and 2NM-PP1 (+I) or glucose (+D) was added after 2 h of derepression. Abcam anti-pSer-5 and anti-pSer-2 polyclonal antisera were used as described under “Experimental Procedures.” The data are expressed as binding (ChIP/input) for ADH2tss and ORF relative to ChIP/input at the TEL region used as a reference.
Persistent Histone H3-K9,14 Hyperacetylation Is More Refractory to Snf1as Inhibition than to Glucose Addition
A possible explanation for the loss of promoter-bound Adr1 after addition of glucose to derepressed cultures is that histone H3-K9,14 hyperacetylation has been reversed. ChIP analysis for acetylated histone H3-K9,14 at ADH2prm confirmed this explanation (Fig. 4B). Similar results were observed for four other Adr1-dependent promoters (POX1, ACS1, ADY2, and POT1) (supplemental Fig. 6B and data not shown). After glucose depletion, H3-K9,14 acetylation increased 8- and 25-fold at the ADH2 and POX1 promoters, respectively, and within 30 min after adding glucose back it had decreased nearly to the level observed in the repressed cells. H3-K9,14 acetylation in DR cultures decreased more slowly in the culture treated with 2NM-PP1 than in the glucose-treated culture and more slowly still in the untreated (no glucose, no inhibitor) control culture. Thus, the epigenetic mark on the nucleosomes that is Snf1-dependent can be erased in 30 min of glucose repression but is more stable when Snf1as is inhibited.
In conclusion, although Snf1 is required for the initial binding of Adr1, its activity is dispensable once Adr1 has bound to the promoter, apparently because H3-K9,14 acetylation is relatively stable in the absence of active Snf1. In contrast, glucose leads to rapid H3-K9,14 de-acetylation and Adr1 eviction, showing that nutrient conditions, specifically low glucose, can lead to rapid loss of an epigenetic mark. Moreover, rapid deacetylation in the presence of glucose does not appear to act through inactivation of Snf1.
RNA pol II Remains at the Promoter and in the ORF after Inhibiting Snf1as
Although Adr1 remains bound to the promoter after inhibiting Snf1as, its ability to retain or recruit RNA pol II might be lost, resulting in an arrest of transcription. The ChIP data, however, appear to refute this interpretation. RNA pol II remained bound at ADH2prm and POX1prm and in their ORFs for at least 2 h post-2NM-PP1 addition, whereas it was reduced to a very low level 1 h post-glucose addition (Fig. 4, C–F; supplemental Fig. 6, C–F).
Analysis of ADH2 mRNA levels after Snf1as was inhibited following 2 h of derepression indicated that transcription had been inhibited before a significant amount of mRNA had accumulated (data not shown). Thus, RNA pol II was more abundant than would be predicted by the level of ADH2 mRNA, suggesting that the polymerase was either inactive or that inhibiting Snf1as had enhanced mRNA decay, or both.
Ser-5 and Ser-2 phosphorylations of the CTD of RNA pol II are associated with promoter escape and elongation, respectively. To see if these modifications were still present after inhibiting Snf1as, promoter occupancy by CTD-Ser-5- and CTD-Ser-2-phosphorylated RNA pol II was investigated by ChIP. A strong signal at ADH2prm and POX1prm and in their ORFs was observed in DR cells 4 h after inhibiting Snf1as (Fig. 4, E and F; supplemental Fig. 6, E and F). After inhibiting Snf1as, there was a 2-fold depletion of Ser-5- and Ser-2-modified RNA pol II in the 3′ region of the ORF compared with the transcription start site, but the decrease was no greater than when total RNA pol II was assayed by ChIP in the same samples (data not shown), indicating that RNA pol II that is present in the ORF has the same relative level of CTD modification as in the uninhibited control. As a negative control, extracts were prepared from cells that had been derepressed for 2 h and then shifted to high glucose medium. The ChIP signal was near the background level using these extracts (Fig. 4, E and F; supplemental Fig. 6, E and F). In summary CTD-phosphorylated RNA pol II was still present at ADH2prm and POX1prm and in their ORFs after Snf1as was inhibited, indicating that an apparent absence of mRNA synthesis was not due to lack of CTD phosphorylation.
RNA pol II Has Nascent Transcripts Associated with It after Inhibiting Snf1as
If the RNA pol II that is associated with Snf1-dependent genes is transcriptionally active after Snf1as inhibition, it should have nascent transcripts associated with it. To detect such transcripts, ChIP for RNA pol II was performed followed by extensive DNase treatment of the purified DNA, removal of the DNase, and cDNA synthesis using reverse transcriptase and random primers. Specific cDNAs were assayed by qPCR using gene-specific primers. Nascent ADH2 and ACS1 transcripts were detected using this approach (data not shown). The signal was reduced about 5-fold when reverse transcriptase was not included during cDNA synthesis, showing that 80% of the templates were derived from ADH2 mRNA, not from genomic ADH2 DNA. These results demonstrate that RNA pol II in the ADH2 and ACS1 ORFs have nascent transcripts associated with them after inhibiting Snf1as and suggest that they are, or were, transcriptionally active. However, whether the transcripts were initiated and elongated before or after Snf1as inhibition is not distinguished by this experiment.
Inhibiting Snf1as Enhances the Rate of mRNA Decay Uniquely from Glucose-repressible Genes
The abrupt cessation of mRNA accumulation and its rapid decline after inhibiting Snf1as could involve enhanced mRNA decay, analogous to the glucose-induced mRNA decay that has been documented for SDH2 (50), JEN1 (48), GAL (2), and PCK1 (49) mRNAs. The apparent half-life of an mRNA can be estimated by the time required to reach a new steady state level (51). Based on this calculation and previous studies of ADH2 derepression (30), the half-life for ADH2 mRNA is 1–2 h. Its apparent half-life after adding glucose or inhibiting Snf1as, assuming that transcription had been arrested, was about 5 min (Fig. 3, A and B). If transcription continues after inhibiting Snf1as, the actual half-life would be even shorter. Thus, it appears that ADH2 is also subject to glucose-induced mRNA decay and that inhibiting Snf1as causes a similar effect.
To serve as a base line for subsequent analysis of mRNA stability in the absence of active Snf1, we measured the mRNA half-lives of 30 glucose-repressible mRNAs after inhibiting transcription with 1,10-o-phenanthroline or by shifting a temperature-sensitive RNA pol II mutant, rpb1-1, to the restrictive temperature. The cultures were derepressed for 4 h before adding 1,10-o-phenanthroline (strain TYY1077) or before shifting the rpb1-1 strain (KBY108) to the restrictive temperature. Samples were removed, and RNA was prepared 20, 40, and 60 min after inhibitor addition or inactivation of RNA pol II at 36.5 °C. No inhibitor of Snf1as was added to these cultures, so the values represent the half-lives of mRNAs that were synthesized and degraded in the presence of active Snf1. These results showed an average half-life of 12 and 16 min after RNA pol II inhibition by 1,10-o-phenanthroline or inactivation by shifting the rpb1-1 strain to the restrictive temperature, respectively (supplemental Table 1).
We also attempted to measure half-lives of Snf1-dependent transcripts by inhibiting transcription with 1,10-o-phenanthroline or by inactivating RNA pol II in the ts mutant in the presence of the Snf1as inhibitor. For reasons that are not understood when both Snf1as and RNA pol II were inhibited, ADH2 mRNA levels failed to show the rapid decline associated with inhibition of Snf1as alone (data not shown). In other words, mRNA instability in the absence of active Snf1 appeared to depend on transcription. Therefore, other less invasive methods for measuring mRNA half-lives, such as labeling with 4-thiouracil (2, 52), will be used to pursue this question in future studies.
Adding glucose to a derepressed culture resulted in a dramatic reduction of RNA pol II from glucose-repressible genes (Fig. 4, C–F; supplemental Fig. 6, E and F). Thus, these conditions should be equivalent to inhibiting transcription in the absence of active Snf1as because glucose rapidly inactivates Snf1 (51). Adding glucose or inhibiting Snf1as during derepressing growth conditions caused a decrease of mRNA levels at a more rapid rate than inhibiting transcription with 1,10-o-phenanthroline or by inactivating RNA pol II in the rpb1-1 ts mutant, yielding half-lives averaging 4–6 and 6–8 min after glucose addition or Snf1as inhibition, respectively, assuming that transcription had been completely inhibited (supplemental Table 1). Importantly, the average half-lives of Snf1-dependent mRNAs in transcription-inhibited DR cultures in the presence of active Snf1as was significantly longer than the apparent half-lives measured after inhibiting Snf1as or adding glucose to DR cultures.
Inhibiting Snf1as enhanced the average rate of decay of 30 glucose-repressible gene transcripts 2–4-fold, but the effect was more dramatic for some mRNAs. Fig. 5 compares the mRNA levels of YIL057C, FDH, PCK1, and FBP1 in DR cultures after RNA pol II inactivation (in the rpb1-1 ts strain) with their levels after Snf1as inhibition or glucose addition without inhibiting RNA pol II. FDH mRNA, for example, had a half-life of greater than 60 min when measured by RNA pol II inactivation but an apparent half-life of only 5 min after Snf1as inhibition or addition of glucose. However, for some glucose-repressible genes, such as FBP1, the rate of decay after RNA pol II inactivation was similar to the rate of decay after glucose or Snf1as inhibition. Several Snf1-independent, non-glucose-repressible mRNAs were analyzed as well, including ACT1, ADH1, TAF1, and BAP2. Their stability was unaffected by inhibiting Snf1as (supplemental Table 1).
FIGURE 5.

Stability of selected glucose-repressible mRNAs in derepressing growth conditions after inhibiting Snf1as, addition of glucose, or inactivating RNA pol II (rpb1-1) at 36. 5 °C. Strain TYY1077 (SNF1as) was grown in YPD medium and derepressed in YP containing 0.05% glucose as described under “Experimental Procedures.” Either glucose (D, final concentration 3%) and 2NM-PP1 (I, final concentration 10 μm) was added 4 h after initial glucose depletion, and samples were removed 5 and 15 min after glucose addition or 7.5 and 22 min after 2NM-PP1 addition. For inactivation of RNA pol II, strain KBY108 (rpb1-1 SNF1as) was grown a 25 °C, and the temperature was rapidly raised to 36.5 °C as described under “Experimental Procedures.” Aliquots were removed for mRNA analysis 20, 40, and 60 min later. RT-qPCR was performed as described under “Experimental Procedures.” The RNA was converted to cDNA using random hexamers and quantified by qPCR. The mRNA values were normalized to the amount of 18 S ribosomal RNA (measured as cDNA) and are expressed relative to the amount of mRNA present in the absence of 2NM-PP1 or glucose for TYY1077 or relative to the amount of mRNA present immediately before heat inactivation of RNA pol II for strain KBY108 (rpb1-1 ts).
Active Snf1 Increases ADH2 and POX1 mRNA Levels after Addition of Glucose to a Derepressed Culture
If the absence of active Snf1 enhances mRNA decay when glucose is added to a derepressed culture, providing active Snf1 in these conditions might ameliorate the effect. We tested this hypothesis using a reg1Δ SNF1as strain. Reg1 is part of the Glc7 protein phosphatase complex that dephosphorylates Snf1-pT210 and inactivates Snf1 in the presence of glucose. Thus, in the absence of Reg1, dephosphorylation of Snf1 is incomplete, and it retains partial activity (53).
The results were consistent with our expectation. When glucose repression was re-established, there was a slower loss of mRNAs from three SNF1-dependent genes, ADH2, POX1, and ACS1, in the reg1Δ SNF1as strain compared with the REG1 SNF1as strain (Fig. 6 and supplemental Fig. 7). This effect is likely due to the presence of active Snf1as in the reg1Δ SNF1as strain because adding 2NM-PP1 in addition to glucose enhanced the apparent rate of decay. The apparent rate of mRNA decay when only 2NM-PP1 was added was similar to that observed when glucose was present, although for ADH2 and ACS1 mRNAs there was a lag before rapid decay occurred, for unknown reasons.
FIGURE 6.
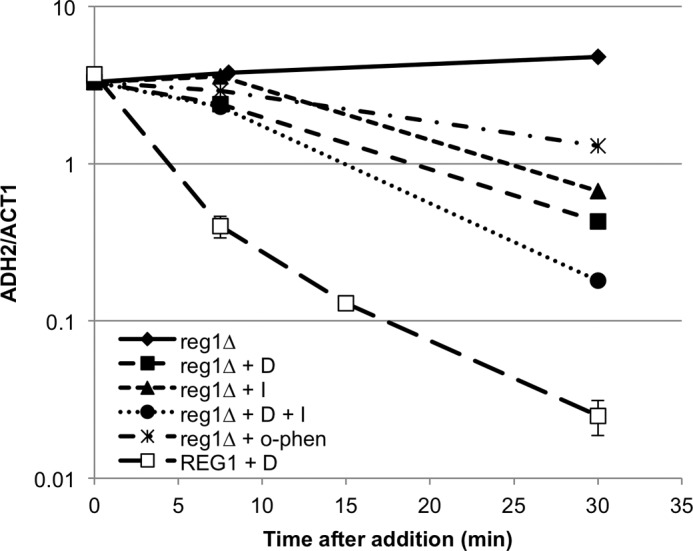
Active Snf1as protects glucose-repressible mRNAs from glucose-induced rapid decay. Strain TYY1085 (reg1Δ SNF1as) was grown in YPD medium and derepressed in YP containing 0.05% glucose as described under “Experimental Procedures.” Additions were made 4 h after initial glucose depletion, and samples were removed for RNA preparation 7.5, 30, and 60 min later. The additions were 2NM-PP1 (I, 10 μm final concentration), glucose (D, 3% final concentration), 2NM-PP1 plus glucose (10 μm and 3%, final concentrations, respectively), 1,10-o-phenanthroline (100 μg/ml final concentration), or DMSO (0.05% final concentration). Messenger RNAs were quantified by RT-qPCR as described under “Experimental Procedures.” Triplicate 0-min samples were prepared, and their average was used as the initial time point. The decay of ADH2 mRNA in a REG1 SNF1as strain after depletion and subsequent re-addition of glucose at 4 h in a separate experiment is shown for reference. The error bars represent the standard deviation from five separate experiments for the REG1 SNF1as strain. The data are expressed relative to ACT1 mRNA levels.
One contributing factor to the slower decline in mRNA levels after glucose addition in the reg1Δ SNF1as strain could be continued transcription. However, when transcription was inhibited by adding 1,10-o-phenanthroline to the reg1Δ SNF1as culture, there was a slower loss of mRNA than when Snf1as was inhibited by adding 2NM-PP1, glucose, or both (Fig. 6 and supplemental Fig. 7), suggesting that transcription plays a minor role in regulating the level of these mRNAs after inhibiting Snf1as.
In the REG1 SNF1as strain in DR conditions, the apparent half-lives of ADH2, ACS1, and POX1 mRNAs were 16, 10, and 10 min, respectively, when transcription was inhibited with 1,10-o-phenanthroline (supplemental Table 1). In the reg1Δ SNF1as strain, their apparent half-lives were 30, 20, and 60 min, respectively, when transcription was inhibited in the same way. Slower mRNA turnover in the reg1Δ SNF1as strain provides additional evidence that increased levels of active Snf1as can decrease mRNA turnover.
The analysis of mRNA stability suggests that post-transcriptional regulation of glucose-repressible genes is a common occurrence and implicates Snf1 in the process. In addition, the data suggest that Snf1as inhibition blocks transcription as completely as adding glucose to a derepressed culture without evicting Adr1 and RNA pol II, as occurs when glucose repression is imposed.
DISCUSSION
Snf1 Is Essential for the Initial but Not for the Persistent Binding of Adr1
Our results indicate that Snf1 regulates the expression of glucose-repressed genes at both transcriptional and post-transcriptional levels. A model depicting our interpretation of these studies is presented in Fig. 7. At the transcriptional level, promoter binding of Adr1 is regulated by Snf1-dependent histone hyperacetylation that occurs when glucose is depleted (20, 32). Adr1 binding is also regulated by inhibitory phosphorylation of Ser-98 within its DNA binding domain, the reversal of which is Snf1-dependent (18). Together, these Snf1-dependent modifications allow Adr1 to bind the promoter and recruit RNA pol II when glucose is depleted.
FIGURE 7.

Model of Snf1 regulation of Adr1-dependent gene expression. Activation of and by Snf1 is indicated by green arrows; red arrows indicate pathways or functions that inactivate Snf1 and Snf1-dependent functions. In brief, activation of Snf1 occurs through phosphorylation of Snf1 on Thr-210, a process that is reversed in the presence of glucose through the action of two protein phosphatases, Glc7 and Sit4. The model depicts active Snf1 stimulating acetylation of nucleosomal histones, a process that could occur by directly stimulating a histone acetyltransferase (as shown), by inactivating a histone deacetylase, or by phosphorylation-dependent acetylation of histones. Once bound, Adr1 and Cat8 stimulate promoter nucleosome remodeling and PIC recruitment. A subsequent step in PIC activation is Snf1-dependent as is stabilization of cytoplasmic mRNA stability. The latter process could occur through protection of the 5′ end of glucose-repressed mRNAs, by altering cytoplasmic mRNA decay processes, or through some other unknown mechanism. The protection is represented by a phosphorylated diamond protecting the 5′ cap of a mRNA. Snf1 may also affect transcription elongation because RNA pol II is engaged in the ORF, but transcript accumulation is not observed after Snf1 is inhibited. The green arrow showing Snf1 affecting this process has a question mark (?) because we have not directly demonstrated an effect on transcript elongation.
After a PIC has been formed, histone acetylation may be less important because histone H3-K9,14 acetylation decreased when Snf1as was inhibited without a concomitant loss of Adr1 or RNA pol II from the promoter. In contrast, glucose-induced deacetylation was more rapid and was associated with loss of Adr1 from the promoter and loss of RNA pol II from the promoter and the ORF. Because inactivating Snf1as did not lead to as rapid a loss of acetylation as was observed when glucose was added, and Adr1 and RNA pol II remained bound, glucose must act through a Snf1-independent pathway to stimulate histone H3 deacetylation, as well as Adr1 and RNA pol II eviction.
The addition of glucose to a yeast culture growing in its absence activates the GLC7- and SIT4-encoded protein phosphatases (54). The effect of glucose on their activation is rapid, occurring in less than 1 min and acts through a G-protein-coupled receptor. An equally rapid inactivation of Snf1 occurs (54). However, inactivating Snf1 does not explain the loss of Adr1 binding when glucose was added because inhibiting Snf1as does not result in rapid Adr1 eviction. Our hypothesis is that a protein phosphatase, activated by glucose addition, rapidly dephosphorylates a Snf1 substrate that is required for Adr1 binding. The phosphatase could be Glc7, Sit4, both, or another unidentified enzyme. When that substrate was dephosphorylated, Adr1 was evicted from the promoter, resulting in loss of RNA pol II and cessation of transcription. Our data predict that inactivation of Snf1as leads to a slower loss of phosphorylation of the putative substrate(s) than glucose addition, and thus it leads to a slower loss of Adr1 from the promoter. A histone acetyltransferase is shown in the model as the activity activated by Snf1. Alternatively, a histone deacetylase could be inactivated by Snf1-dependent phosphorylation, or the histones themselves could be the putative Snf1-regulated substrate (22, 55).
Snf1 May Inhibit Transcription at a Step Subsequent to PIC Recruitment
Snf1 appears to influence the activity of RNA pol II at a step after its recruitment by Adr1. The evidence for this is the observation that RNA pol II is found at Adr1-dependent promoters and at the 3′ end of the ORFs after inhibiting Snf1as, and it has nascent transcripts associated with it, yet transcript accumulation is not observed. It is possible that accelerated mRNA decay alone accounts for the rapid decline in transcript levels and that transcription is continuing after inhibiting Snf1as. We think that this is unlikely, however, because mRNA levels decline at about the same rate as after glucose addition, which causes RNA pol II loss from the promoter and ORF. In particular, in Fig. 3B the absolute value of the rate of accumulation of ADH2 mRNA in the absence of inhibition is about the same as the absolute value of the rate of ADH2 mRNA loss in the presence of either glucose or 2NM-PP1. Therefore, the rate of synthesis in the presence of glucose or 2NM-PP1 must be much smaller than it is in the absence of inhibition. However, we have been unable to resolve this issue experimentally, and further work is needed to confirm the level of transcription after inhibiting Snf1as. Thus, in our model a question mark depicts a hypothetical activating phosphorylation of the PIC by Snf1.
Snf1 Promotes mRNA Stability
Another level of Snf1 regulation of gene expression is post-transcriptional and appears to stabilize Snf1-dependent mRNAs against cytoplasmic decay. Addition of a fermentable carbon source to cells growing oxidatively leads to the rapid decay of transcripts derived from the glucose-repressible genes CYC1 (56), SUC2, SDH1, SDH2 (50, 57–60), FBP1, PCK1 (49, 61), and JEN1 (48). In addition GAL mRNAs respond to a shift from galactose-to-glucose metabolism by a dramatic shortening of their half-lives (2, 62). GAL7 mRNA made in the presence of glucose (using a constitutive promoter) was as stable as that made in the presence of the inducer galactose, suggesting that mRNA stability is influenced by an acute change in carbon source rather than by the growth medium itself. The authors suggested that this result implied “ … the existence of a coupling mechanism between transcription inhibition in the nucleus and enhanced decay in the cytoplasm” (2). Our experiments demonstrate that inhibiting Snf1as induces a rapid and specific enhanced decay of mRNAs representing 30 glucose-repressible SNF1-dependent genes. Snf1 was previously indirectly implicated in regulating gluconeogenic and SDH1 mRNA levels post-transcriptionally because they were stabilized when REG1 was deleted (57). However, SDH1 gene expression was reported to be Snf1-independent, implying that REG1 was acting in a Snf1-independent pathway to stabilize its mRNA (57).
How might Snf1 enhance mRNA stability in a transcript-specific manner? Because constitutive mRNAs such as those derived from ACT1, TAF1, and ADH1 were not affected, Snf1 must exert its protective effect in a sequence-specific manner. The 5′-UTRs of the affected mRNAs are possible targets. However, a search of the 5′-UTRs of SDH1, SDH2, and SUC2 mRNAs did not identify a common sequence that might be responsible for their enhanced decay after glucose addition (59). Our identification of a large number of Snf1-dependent transcripts whose degradation was enhanced by imposing glucose repression might aid in identifying common features of the 5′-UTRs.
Recent studies have identified antisense noncoding regulatory RNA expressed throughout the yeast genome (63). Interestingly, a coding-strand transcript was implicated in regulating the stability of the glucose-repressible JEN1 mRNA (48). Thus, both sense and antisense transcripts have been implicated in control of mRNA stability. However, the promoters of many glucose-repressible genes have been extensively characterized and shown to be necessary and sufficient for glucose-regulated expression. In particular, as illustrated in supplemental Figs. 1 and 5, an ADH2-lacZ gene fusion, which lacks the ADH2 ORF, is regulated appropriately. This observation suggests that if antisense noncoding regulatory RNA plays a role in glucose repression of ADH2 expression it must be subsidiary to or in addition to the regulation that is promoter-dependent.
An alternative possibility is promoter-mediated mRNA decay. Recent studies have suggested that transcription in the nucleus can be coupled with mRNA decay in the cytoplasm. Rap1-binding sites in a promoter were shown to be sufficient to enhance mRNA decay in the cytoplasm (64). The same group reported that cytoplasmic mRNA decay is accelerated by association with a subcomplex of RNA pol II. This subcomplex, Rpb4/7, shuttles with mRNAs between the nucleus and cytoplasm, thus apparently linking transcription with mRNA stability (65–68). Another study reported that glucose sensing involves coordinated transcriptional repression and mRNA decay (69). A recent report found that cell cycle regulation of SWI5 and CLB2 involves transcription-coupled mRNA decay in the cytoplasm (70). In this case, it appears that the mRNAs are bound by a protein kinase, Dbf2, during transcription, and this association marks the mRNAs for cell cycle-regulated degradation in the cytoplasm.
Transcription-coupled mRNA degradation might explain the rapid decay of Snf1-dependent transcripts. We hypothesize that Snf1-dependent transcription factors such as Adr1 and Cat8 recruit a protein complex to promoters of glucose-repressible genes. The putative complex could either remain associated with the transcript or modify it in an unknown manner, and thus allow the cytoplasmic mRNA to be recognized as Snf1-dependent and confer protection from decay. In our model this activity is represented by a phosphorylated diamond protecting the 5′ cap on the mRNA, although we have no evidence that this occurs. Alternatively, Snf1-dependent phosphorylation could inactivate a component of the cytoplasmic mRNA decay pathway that specifically recognizes and degrades glucose-repressed mRNAs in an unknown manner. The model further assumes that the putative Snf1-dependent alteration is unstable because inactivating Snf1as leads to rapid decay of the mRNA. The recent finding that glucose addition to a derepressed culture very rapidly activates the PP1 and PP2A protein phosphatases suggests that the latter assumption is plausible (54).
We have identified a new mechanism of Snf1-dependent gene regulation that acts at the post-transcriptional level to specifically stabilize transcripts made from glucose-repressible genes. This mechanism is superimposed on Snf1-dependent transcriptional processes that include regulation of Adr1 binding and activation of RNA pol II activity. Snf1 enhances histone H3 acetylation, allowing Adr1 binding and recruitment of RNA pol II. The histone modification is more stable than the post-transcriptional alteration that stabilizes mRNAs. Thus, Adr1 and RNA pol II remain at the promoter after inactivation of Snf1, but mRNA stability is immediately compromised. Together, these mechanisms ensure that expression of glucose-repressible genes will be rapidly shut off when the activity of Snf1 is reduced but allows the promoter to be held in a state of readiness for the next round of nutrient starvation. Important future goals are to identify Snf1 substrates that influence these activities and to determine the molecular mechanisms underlying Snf1-dependent mRNA stabilization and its reversal by glucose.
Supplementary Material
Acknowledgments
We thank J. Broach for pSH47 (SNF1as), K. Dombek for strain construction and advice, S. Palmisano for technical assistance, and V. L. Price for editorial comments.
This work was supported, in whole or in part, by National Institutes of Health Grant GM26079 (to E. T. Y.).

This article contains supplemental Figs. 1–7 and Table 1.
- pol
- polymerase
- qPCR
- quantitative PCR
- 2NM-PP1
- 2-naphthylmethyl pyrazolopyrimidine 1
- CTD
- C-terminal domain
- PIC
- preinitiation complex
- as
- analog-sensitive
- DR
- derepressing
- IP
- immunoprecipitation
- ChIP
- chromatin immunoprecipitation.
REFERENCES
- 1. DeRisi J. L., Iyer V. R., Brown P. O. (1997) Exploring the metabolic and genetic control of gene expression on a genomic scale. Science 278, 680–686 [DOI] [PubMed] [Google Scholar]
- 2. Munchel S. E., Shultzaberger R. K., Takizawa N., Weis K. (2011) Dynamic profiling of mRNA turnover reveals gene-specific and system-wide regulation of mRNA decay. Mol. Biol. Cell 22, 2787–2795 [DOI] [PMC free article] [PubMed] [Google Scholar]
- 3. Hardie D. G. (2011) Energy sensing by the AMP-activated protein kinase and its effects on muscle metabolism. Proc. Nutr. Soc. 70, 92–99 [DOI] [PubMed] [Google Scholar]
- 4. Carlson M. (1999) Glucose repression in yeast. Curr. Opin. Microbiol. 2, 202–207 [DOI] [PubMed] [Google Scholar]
- 5. Gancedo J. M. (2008) The early steps of glucose signaling in yeast. FEMS Microbiol. Rev. 32, 673–704 [DOI] [PubMed] [Google Scholar]
- 6. Santangelo G. M. (2006) Glucose signaling in Saccharomyces cerevisiae. Microbiol. Mol. Biol. Rev. 70, 253–282 [DOI] [PMC free article] [PubMed] [Google Scholar]
- 7. Schüller H. J. (2003) Transcriptional control of nonfermentative metabolism in the yeast Saccharomyces cerevisiae. Curr. Genet. 43, 139–160 [DOI] [PubMed] [Google Scholar]
- 8. Sanz P., Alms G. R., Haystead T. A., Carlson M. (2000) Regulatory interactions between the Reg1-Glc7 protein phosphatase and the Snf1 protein kinase. Mol. Cell. Biol. 20, 1321–1328 [DOI] [PMC free article] [PubMed] [Google Scholar]
- 9. Hong S. P., Leiper F. C., Woods A., Carling D., Carlson M. (2003) Activation of yeast Snf1 and mammalian AMP-activated protein kinase by upstream kinases. Proc. Natl. Acad. Sci. U.S.A. 100, 8839–8843 [DOI] [PMC free article] [PubMed] [Google Scholar]
- 10. Rubenstein E. M., McCartney R. R., Zhang C., Shokat K. M., Shirra M. K., Arndt K. M., Schmidt M. C. (2008) Access denied. Snf1 activation loop phosphorylation is controlled by availability of the phosphorylated threonine 210 to the PP1 phosphatase. J. Biol. Chem. 283, 222–230 [DOI] [PMC free article] [PubMed] [Google Scholar]
- 11. Mayer F. V., Heath R., Underwood E., Sanders M. J., Carmena D., McCartney R. R., Leiper F. C., Xiao B., Jing C., Walker P. A., Haire L. F., Ogrodowicz R., Martin S. R., Schmidt M. C., Gamblin S. J., Carling D. (2011) ADP regulates SNF1, the Saccharomyces cerevisiae homolog of AMP-activated protein kinase. Cell Metab. 14, 707–714 [DOI] [PMC free article] [PubMed] [Google Scholar]
- 12. Hardie D. G., Carling D., Gamblin S. J. (2011) AMP-activated protein kinase. Also regulated by ADP? Trends Biochem. Sci. 36, 470–477 [DOI] [PubMed] [Google Scholar]
- 13. Xiao B., Sanders M. J., Underwood E., Heath R., Mayer F. V., Carmena D., Jing C., Walker P. A., Eccleston J. F., Haire L. F., Saiu P., Howell S. A., Aasland R., Martin S. R., Carling D., Gamblin S. J. (2011) Structure of mammalian AMPK and its regulation by ADP. Nature 472, 230–233 [DOI] [PMC free article] [PubMed] [Google Scholar]
- 14. Cherkasova V., Qiu H., Hinnebusch A. G. (2010) Snf1 promotes phosphorylation of the α subunit of eukaryotic translation initiation factor 2 by activating Gcn2 and inhibiting phosphatases Glc7 and Sit4. Mol. Cell. Biol. 30, 2862–2873 [DOI] [PMC free article] [PubMed] [Google Scholar]
- 15. Hahn J. S., Thiele D. J. (2004) Activation of the Saccharomyces cerevisiae heat shock transcription factor under glucose starvation conditions by Snf1 protein kinase. J. Biol. Chem. 279, 5169–5176 [DOI] [PubMed] [Google Scholar]
- 16. Mayordomo I., Estruch F., Sanz P. (2002) Convergence of the target of rapamycin and the Snf1 protein kinase pathways in the regulation of the subcellular localization of Msn2, a transcriptional activator of STRE (Stress Response Element)-regulated genes. J. Biol. Chem. 277, 35650–35656 [DOI] [PubMed] [Google Scholar]
- 17. Vyas V. K., Kuchin S., Carlson M. (2001) Interaction of the repressors Nrg1 and Nrg2 with the Snf1 protein kinase in Saccharomyces cerevisiae. Genetics 158, 563–572 [DOI] [PMC free article] [PubMed] [Google Scholar]
- 18. Ratnakumar S., Kacherovsky N., Arms E., Young E. T. (2009) Snf1 controls the activity of adr1 through dephosphorylation of Ser-230. Genetics 182, 735–745 [DOI] [PMC free article] [PubMed] [Google Scholar]
- 19. Ratnakumar S., Young E. T. (2010) Snf1 dependence of peroxisomal gene expression is mediated by Adr1. J. Biol. Chem. 285, 10703–10714 [DOI] [PMC free article] [PubMed] [Google Scholar]
- 20. Abate G., Bastonini E., Braun K. A., Verdone L., Young E. T., Caserta M. (2012) Snf1/AMPK regulates Gcn5 occupancy, H3 acetylation and chromatin remodeling at S. cerevisiae ADY2 promoter. Biochim. Biophys. Acta 1819, 419–427 [DOI] [PMC free article] [PubMed] [Google Scholar]
- 21. Liu Y., Xu X., Kuo M. H. (2010) Snf1p regulates Gcn5p transcriptional activity by antagonizing Spt3p. Genetics 184, 91–105 [DOI] [PMC free article] [PubMed] [Google Scholar]
- 22. Lo W. S., Duggan L., Emre N. C., Belotserkovskya R., Lane W. S., Shiekhattar R., Berger S. L. (2001) Snf1. A histone kinase that works in concert with the histone acetyltransferase Gcn5 to regulate transcription. Science 293, 1142–1146 [DOI] [PubMed] [Google Scholar]
- 23. Kuchin S., Treich I., Carlson M. (2000) A regulatory shortcut between the Snf1 protein kinase and RNA polymerase II holoenzyme. Proc. Natl. Acad. Sci. U.S.A. 97, 7916–7920 [DOI] [PMC free article] [PubMed] [Google Scholar]
- 24. Shirra M. K., McCartney R. R., Zhang C., Shokat K. M., Schmidt M. C., Arndt K. M. (2008) A chemical genomics study identifies Snf1 as a repressor of GCN4 translation. J. Biol. Chem. 283, 35889–35898 [DOI] [PMC free article] [PubMed] [Google Scholar]
- 25. Young E. T., Dombek K. M., Tachibana C., Ideker T. (2003) Multiple pathways are co-regulated by the protein kinase Snf1 and the transcription factors Adr1 and Cat8. J. Biol. Chem. 278, 26146–26158 [DOI] [PubMed] [Google Scholar]
- 26. Haurie V., Perrot M., Mini T., Jenö P., Sagliocco F., Boucherie H. (2001) The transcriptional activator Cat8p provides a major contribution to the reprogramming of carbon metabolism during the diauxic shift in Saccharomyces cerevisiae. J. Biol. Chem. 276, 76–85 [DOI] [PubMed] [Google Scholar]
- 27. Haurie V., Sagliocco F., Boucherie H. (2004) Dissecting regulatory networks by means of two-dimensional gel electrophoresis. Application to the study of the diauxic shift in the yeast Saccharomyces cerevisiae. Proteomics 4, 364–373 [DOI] [PubMed] [Google Scholar]
- 28. Tachibana C., Yoo J. Y., Tagne J. B., Kacherovsky N., Lee T. I., Young E. T. (2005) Combined global localization analysis and transcriptome data identify genes that are directly coregulated by Adr1 and Cat8. Mol. Cell. Biol. 25, 2138–2146 [DOI] [PMC free article] [PubMed] [Google Scholar]
- 29. Blumberg H., Hartshorne T. A., Young E. T. (1988) Regulation of expression and activity of the yeast transcription factor ADR1. Mol. Cell. Biol. 8, 1868–1876 [DOI] [PMC free article] [PubMed] [Google Scholar]
- 30. Sloan J. S., Dombek K. M., Young E. T. (1999) Post-translational regulation of Adr1 activity is mediated by its DNA binding domain. J. Biol. Chem. 274, 37575–37582 [DOI] [PubMed] [Google Scholar]
- 31. Young E. T., Kacherovsky N., Van Riper K. (2002) Snf1 protein kinase regulates Adr1 binding to chromatin but not transcription activation. J. Biol. Chem. 277, 38095–38103 [DOI] [PubMed] [Google Scholar]
- 32. Verdone L., Wu J., van Riper K., Kacherovsky N., Vogelauer M., Young E. T., Grunstein M., Di Mauro E., Caserta M. (2002) Hyperacetylation of chromatin at the ADH2 promoter allows Adr1 to bind in repressed conditions. EMBO J. 21, 1101–1111 [DOI] [PMC free article] [PubMed] [Google Scholar]
- 33. Biddick R. K., Law G. L., Chin K. K., Young E. T. (2008) The transcriptional coactivators SAGA, SWI/SNF, and mediator make distinct contributions to activation of glucose-repressed genes. J. Biol. Chem. 283, 33101–33109 [DOI] [PMC free article] [PubMed] [Google Scholar]
- 34. Biddick R. K., Law G. L., Young E. T. (2008) Adr1 and Cat8 mediate coactivator recruitment and chromatin remodeling at glucose-regulated genes. PloS one 3, e1436. [DOI] [PMC free article] [PubMed] [Google Scholar]
- 35. Tachibana C., Biddick R., Law G. L., Young E. T. (2007) A poised initiation complex is activated by SNF1. J. Biol. Chem. 282, 37308–37315 [DOI] [PubMed] [Google Scholar]
- 36. Infante J. J., Law G. L., Wang I. T., Chang H. W., Young E. T. (2011) Activator-independent transcription of Snf1-dependent genes in mutants lacking histone tails. Mol. Microbiol. 80, 407–422 [DOI] [PMC free article] [PubMed] [Google Scholar]
- 37. Parua P. K., Ratnakumar S., Braun K. A., Dombek K. M., Arms E., Ryan P. M., Young E. T. (2010) 14-3-3 (Bmh) proteins inhibit transcription activation by Adr1 through direct binding to its regulatory domain. Mol. Cell. Biol. 30, 5273–5283 [DOI] [PMC free article] [PubMed] [Google Scholar]
- 38. Dombek K. M., Kacherovsky N., Young E. T. (2004) The Reg1-interacting proteins, Bmh1, Bmh2, Ssb1, and Ssb2, have roles in maintaining glucose repression in Saccharomyces cerevisiae. J. Biol. Chem. 279, 39165–39174 [DOI] [PubMed] [Google Scholar]
- 39. Bishop A. C., Buzko O., Shokat K. M. (2001) Magic bullets for protein kinases. Trends Cell Biol. 11, 167–172 [DOI] [PubMed] [Google Scholar]
- 40. Zaman S., Lippman S. I., Schneper L., Slonim N., Broach J. R. (2009) Glucose regulates transcription in yeast through a network of signaling pathways. Mol. Syst. Biol. 5, 245. [DOI] [PMC free article] [PubMed] [Google Scholar]
- 41. Sherman F. (2002) Getting started with yeast. Methods Enzymol. 350, 3–41 [DOI] [PubMed] [Google Scholar]
- 42. Knop M., Siegers K., Pereira G., Zachariae W., Winsor B., Nasmyth K., Schiebel E. (1999) Epitope tagging of yeast genes using a PCR-based strategy. More tags and improved practical routines. Yeast 15, 963–972 [DOI] [PubMed] [Google Scholar]
- 43. Güldener U., Heck S., Fielder T., Beinhauer J., Hegemann J. H. (1996) A new efficient gene disruption cassette for repeated use in budding yeast. Nucleic Acids Res. 24, 2519–2524 [DOI] [PMC free article] [PubMed] [Google Scholar]
- 44. Collart M. A., Oliviero S. (2001) Preparation of yeast RNA. Curr Protoc. Mol. Biol. Chapter 13, Unit 13.12 [DOI] [PubMed] [Google Scholar]
- 45. Passos D. O., Parker R. (2008) Analysis of cytoplasmic mRNA decay in Saccharomyces cerevisiae. Methods Enzymol. 448, 409–427 [DOI] [PMC free article] [PubMed] [Google Scholar]
- 46. Guarente L. (1983) Yeast promoters and lacZ fusions designed to study expression of cloned genes in yeast. Methods Enzymol. 101, 181–191 [DOI] [PubMed] [Google Scholar]
- 47. Young E. T., Sloan J., Miller B., Li N., van Riper K., Dombek K. M. (2000) Evolution of a glucose-regulated ADH gene in the genus Saccharomyces. Gene 245, 299–309 [DOI] [PubMed] [Google Scholar]
- 48. Andrade R. P., Kötter P., Entian K. D., Casal M. (2005) Multiple transcripts regulate glucose-triggered mRNA decay of the lactate transporter JEN1 from Saccharomyces cerevisiae. Biochem. Biophys. Res. Commun. 332, 254–262 [DOI] [PubMed] [Google Scholar]
- 49. Yin Z., Smith R. J., Brown A. J. (1996) Multiple signaling pathways trigger the exquisite sensitivity of yeast gluconeogenic mRNAs to glucose. Mol. Microbiol. 20, 751–764 [DOI] [PubMed] [Google Scholar]
- 50. Cereghino G. P., Atencio D. P., Saghbini M., Beiner J., Scheffler I. E. (1995) Glucose-dependent turnover of the mRNAs encoding succinate dehydrogenase peptides in Saccharomyces cerevisiae. Sequence elements in the 5′-untranslated region of the Ip mRNA play a dominant role. Mol. Biol. Cell 6, 1125–1143 [DOI] [PMC free article] [PubMed] [Google Scholar]
- 51. Palmiter R. D. (1973) Rate of ovalbumin messenger ribonucleic acid synthesis in the oviduct of estrogen-primed chicks. J. Biol. Chem. 248, 8260–8270 [PubMed] [Google Scholar]
- 52. Miller C., Schwalb B., Maier K., Schulz D., Dümcke S., Zacher B., Mayer A., Sydow J., Marcinowski L., Dölken L., Martin D. E., Tresch A., Cramer P. (2011) Dynamic transcriptome analysis measures rates of mRNA synthesis and decay in yeast. Mol. Syst. Biol. 7, 458. [DOI] [PMC free article] [PubMed] [Google Scholar]
- 53. Orlova M., Barrett L., Kuchin S. (2008) Detection of endogenous Snf1 and its activation state. Application to Saccharomyces and Candida species. Yeast 25, 745–754 [DOI] [PubMed] [Google Scholar]
- 54. Castermans D., Somers I., Kriel J., Louwet W., Wera S., Versele M., Janssens V., Thevelein J. M. (2012) Glucose-induced post-translational activation of protein phosphatases PP2A and PP1 in yeast. Cell Res. 22, 1058–1077 [DOI] [PMC free article] [PubMed] [Google Scholar]
- 55. Bungard D., Fuerth B. J., Zeng P. Y., Faubert B., Maas N. L., Viollet B., Carling D., Thompson C. B., Jones R. G., Berger S. L. (2010) Signaling kinase AMPK activates stress-promoted transcription via histone H2B phosphorylation. Science 329, 1201–1205 [DOI] [PMC free article] [PubMed] [Google Scholar]
- 56. Boss J. M., Darrow M. D., Zitomer R. S. (1980) Characterization of yeast iso-1-cytochrome c mRNA. J. Biol. Chem. 255, 8623–8628 [PubMed] [Google Scholar]
- 57. Cereghino G. P., Scheffler I. E. (1996) Genetic analysis of glucose regulation in Saccharomyces cerevisiae. Control of transcription versus mRNA turnover. EMBO J. 15, 363–374 [PMC free article] [PubMed] [Google Scholar]
- 58. Scheffler I. E., de la Cruz B. J., Prieto S. (1998) Control of mRNA turnover as a mechanism of glucose repression in Saccharomyces cerevisiae. Int. J. Biochem. Cell Biol. 30, 1175–1193 [DOI] [PubMed] [Google Scholar]
- 59. de la Cruz B. J., Prieto S., Scheffler I. E. (2002) The role of the 5′-untranslated region (UTR) in glucose-dependent mRNA decay. Yeast 19, 887–902 [DOI] [PubMed] [Google Scholar]
- 60. Prieto S., de la Cruz B. J., Scheffler I. E. (2000) Glucose-regulated turnover of mRNA and the influence of poly(A) tail length on half-life. J. Biol. Chem. 275, 14155–14166 [DOI] [PubMed] [Google Scholar]
- 61. Mercado J. J., Smith R., Sagliocco F. A., Brown A. J., Gancedo J. M. (1994) The levels of yeast gluconeogenic mRNAs respond to environmental factors. Eur. J. Biochem. 224, 473–481 [DOI] [PubMed] [Google Scholar]
- 62. Bennett M. R., Pang W. L., Ostroff N. A., Baumgartner B. L., Nayak S., Tsimring L. S., Hasty J. (2008) Metabolic gene regulation in a dynamically changing environment. Nature 454, 1119–1122 [DOI] [PMC free article] [PubMed] [Google Scholar]
- 63. van Dijk E. L., Chen C. L., d'Aubenton-Carafa Y., Gourvennec S., Kwapisz M., Roche V., Bertrand C., Silvain M., Legoix-Né P., Loeillet S., Nicolas A., Thermes C., Morillon A. (2011) XUTs are a class of Xrn1-sensitive antisense regulatory noncoding RNA in yeast. Nature 475, 114–117 [DOI] [PubMed] [Google Scholar]
- 64. Bregman A., Avraham-Kelbert M., Barkai O., Duek L., Guterman A., Choder M. (2011) Promoter elements regulate cytoplasmic mRNA decay. Cell 147, 1473–1483 [DOI] [PubMed] [Google Scholar]
- 65. Harel-Sharvit L., Eldad N., Haimovich G., Barkai O., Duek L., Choder M. (2010) RNA polymerase II subunits link transcription and mRNA decay to translation. Cell 143, 552–563 [DOI] [PubMed] [Google Scholar]
- 66. Lotan R., Bar-On V. G., Harel-Sharvit L., Duek L., Melamed D., Choder M. (2005) The RNA polymerase II subunit Rpb4p mediates decay of a specific class of mRNAs. Genes Dev. 19, 3004–3016 [DOI] [PMC free article] [PubMed] [Google Scholar]
- 67. Lotan R., Goler-Baron V., Duek L., Haimovich G., Choder M. (2007) The Rpb7p subunit of yeast RNA polymerase II plays roles in the two major cytoplasmic mRNA decay mechanisms. J. Cell Biol. 178, 1133–1143 [DOI] [PMC free article] [PubMed] [Google Scholar]
- 68. Shalem O., Groisman B., Choder M., Dahan O., Pilpel Y. (2011) Transcriptome kinetics is governed by a genome-wide coupling of mRNA production and degradation. A role for RNA pol II. PLoS Genet. 7, e1002273. [DOI] [PMC free article] [PubMed] [Google Scholar]
- 69. Lavoie M., Ge D., Abou Elela S. (2012) Regulation of conditional gene expression by coupled transcription repression and RNA degradation. Nucleic Acids Res. 40, 871–883 [DOI] [PMC free article] [PubMed] [Google Scholar]
- 70. Trcek T., Larson D. R., Moldón A., Query C. C., Singer R. H. (2011) Single-molecule mRNA decay measurements reveal promoter-regulated mRNA stability in yeast. Cell 147, 1484–1497 [DOI] [PMC free article] [PubMed] [Google Scholar]
Associated Data
This section collects any data citations, data availability statements, or supplementary materials included in this article.