

Background: Synergism between enzymes is a prerequisite for the efficient degradation of cellulose, but its molecular mechanisms are not fully understood.
Results: Endoglucanase increased the rate constant of cellobiohydrolase-catalyzed cellulose hydrolysis.
Conclusion: A mechanism whereby endoglucanase avoids the stalling of processive cellobiohydrolase is proposed.
Significance: Understanding the mechanisms of synergism helps to design more efficient enzyme mixtures for cellulose degradation.
Keywords: Biofuel, Carbohydrate-binding Protein, Cellulase, Enzyme Kinetics, Enzyme Mechanisms, Cellobiohydrolase, Cellulose, Endoglucanase, Processivity, Synergism, Single-turnover Kinetics, Inhibition
Abstract
Synergistic cooperation of different enzymes is a prerequisite for efficient degradation of cellulose. The conventional mechanistic interpretation of the synergism between randomly acting endoglucanases (EGs) and chain end-specific processive cellobiohydrolases (CBHs) is that EG-generated new chain ends on cellulose surface serve as starting points for CBHs. Here we studied the hydrolysis of bacterial cellulose (BC) by CBH TrCel7A and EG TrCel5A from Trichoderma reesei under both single-turnover and “steady state” conditions. Unaccountable by conventional interpretation, the presence of EG increased the rate constant of TrCel7A-catalyzed hydrolysis of BC in steady state. At optimal enzyme/substrate ratios, the “steady state” rate of synergistic hydrolysis became limited by the velocity of processive movement of TrCel7A on BC. A processivity value of 66 ± 7 cellobiose units measured for TrCel7A on 14C-labeled BC was close to the leveling off degree of polymerization of BC, suggesting that TrCel7A cannot pass through the amorphous regions on BC and stalls. We propose a mechanism of endo-exo synergism whereby the degradation of amorphous regions by EG avoids the stalling of TrCel7A and leads to its accelerated recruitment. Hydrolysis of pretreated wheat straw suggested that this mechanism of synergism is operative also in the degradation of lignocellulose. Although both mechanisms of synergism are used in parallel, the contribution of conventional mechanism is significant only at high enzyme/substrate ratios.
Introduction
Cellulose is the most abundant biopolymer on Earth and has great potential as a renewable energy source (1). Cellulose is the main component of plant cell walls, but it is also produced by some animals and microorganisms like bacteria and algae. Cellulose consists of linear chains of anhydroglucose units linked through β-1-4 glycosidic bonds. Degree of polymerization (DP)2 in native celluloses ranges from a few thousand to tens of thousands of glucose units. Linear chains interact with each other, forming tightly packed crystalline structures like microfibrils and fibers. In plant cell walls, cellulose is associated with other polysaccharides like hemicelluloses and heterogeneous polymer of phenolic units, lignin. All of this makes cellulose recalcitrant for enzymatic as well as chemical breakdown (2, 3). In nature, cellulose is degraded mainly by fungi and bacteria, which secrete a set of cellulolytic enzymes (4). These include cellulases and hemicellulases but also enzymes involved in lignin breakdown. The simplest classification groups cellulases into cellobiohydrolases (CBHs), endoglucanases (EGs) and β-glucosidases. CBHs are processive enzymes that start the hydrolysis from cellulose chain ends, whereas EGs non-processively attack cellulose chains at random positions. β-Glucosidases hydrolyze cellobiose, the product of the action of CBHs, to glucose, thus relieving the product inhibition of CBHs. To date, the best characterized cellulolytic system is that of soft rot fungus Tricoderma reesei. The major component of the T. reesei cellulolytic system is glycoside hydrolase family 7 (CAZy database, available on the World Wide Web) (6) CBH, TrCel7A. TrCel7A has a modular structure consisting of a catalytic domain that is connected through the linker peptide (7) to a carbohydrate binding module (CBM) (8). The tunnel-shaped active site resides in the catalytic domain and contains 10 anhydroglucose unit binding sites (9). It is well documented that CBM is required for efficient binding of TrCel7A to the crystalline cellulose (10). CBMs have also targeting function (11–14), and it has been demonstrated that TrCel7A is targeted to the hydrophobic phases of cellulose crystal (14). Although molecular dynamics simulations have predicted more intimate roles for CBM in catalysis like disengagement of cellulose chains from the crystal lattice (15) or aiding processive movement (16), the biochemical evidence of such roles is elusive (17). Besides TrCel7A, T. reesei also secretes a less abundant CBH, TrCel6A, and a number of EGs that include TrCel7B, TrCel5A, and TrCel12A. The active site of EGs is more opened and groove-shaped. It is well recognized that CBHs are more efficient in degradation of crystalline cellulose, whereas EGs preferentially target less ordered amorphous regions.
Synergistic cooperation between cellulases is a prerequisite for efficient degradation of cellulose (18, 19). The first mechanistic explanation of synergism was put forward by Reese et al. (20) more than 50 years ago. The first, unknown component (C1) was supposed to carry out so-called amorphogenesis of crystalline cellulose, exposing single cellulose chains and cellooligosaccharides that were then degraded by the Cx component, identified as EG (20). Although numerous non-hydrolytic proteins that can induce amorphogenesis and act synergistically with cellulases have been identified (21), their contribution to lignocellulose degradation remains elusive. After discovery of CBHs (referred to as C1 for some time) (22, 23), the mechanistic explanation of endo-exo synergy was put forward, whereby randomly acting EG generates new chain ends on cellulose that serve as starting points for processive CBHs (24). Although alternative explanations like removal of obstacles by EG (surface “cleaning”) to aid the processive movement of CBH have also been proposed (25, 26), the conventional “starting point generation” mechanism is still the most widely accepted one. Synergistic action has been shown to be reciprocal, meaning that not only does CBH benefit from the action of EG, but also the action of CBH renders the substrate more accessible to EG (25, 27). Synergism between two CBHs (exo-exo synergism) has also been reported (28–32). Because one of the CBH components has been proposed to employ also the endo-mode of initiation (endo-processive CBH), the mechanistic interpretation of the conventional endo-exo synergism was adopted (30–32). Recently, a new type of synergism between enzymes that employ oxidative chemistry to break glycosidic bonds and hydrolytic enzymes was reported in chitin degradation (33). The enigmatic synergism between non-hydrolytic glycoside hydrolase family 61 proteins and cellulases has since found a mechanistic interpretation (34–37). This has lead to the resurgence of C1-Cx theory with the oxidative enzyme identified as C1 (19, 35, 38). To make it all more complex and challenging, Gao et al. (39) demonstrated that synergism was dependent on the glycosylation pattern of CBH.
For the quantitative description of synergism, the degree of synergistic effect (DSE) is often used. DSE is the ratio of the activity of synergistic mixture to the sum of the activities of individual components. Besides the nature of synergistic components, DSE has also been shown to depend on the molar ratio of the components (31, 40); surface density of bound cellulases (30, 41, 42); and properties of cellulose like DP (25, 43), crystallinity (44), and allomorph composition (45). Because cellulose properties can change with hydrolysis, the dependence of DSE on hydrolysis time has also been reported (25, 31, 46). Usually, a small molar fraction (a few percent) of EG results in the highest DSE (31, 40), but the optimal fraction of EG depends on the nature of the EG as well as the substrate used (25, 31). Data on the effect of the surface density of bound enzymes on DSE are controversial. Some studies have shown that DSE is highest in the case of low surface coverage (41), whereas others support the importance of proximity (i.e. high surface density) of synergistic components (30, 42, 47, 48). Among cellulose substrates, the highest DSE is observed on substrates with high DP and intermediate crystallinity (45) like filter paper or bacterial cellulose (BC), whereas low or moderate DSE is observed on highly crystalline substrates (25, 46, 49). All of these findings indicate that endo-exo synergism is far more complex than appears from the conventional, “starting point generation” mechanism.
Here we studied the hydrolysis of BC by CBH TrCel7A and EG TrCel5A under both single-turnover and “steady state” conditions. EG was found to increase the rate constant of CBH-catalyzed cellulose hydrolysis in “steady state.” A mechanism of endo-exo synergism is proposed, whereby the degradation of amorphous regions of BC by EG avoids the stalling of processive CBH and leads to its accelerated recruitment.
EXPERIMENTAL PROCEDURES
Materials
Glucose, cellobiose, 4-methylumbelliferyl-β-lactoside (MUL), para-nitrophenyl-β-lactoside (pNPL), bovine serum albumin (BSA), and papain were purchased from Sigma-Aldrich. d-U-14C-Labeled glucose with a specific activity of 262 mCi/mmol was from Hartmann Analytic GmbH. Scintillation mixture was from Merck. All chemicals were used as purchased.
Enzymes
TrCel7A and TrCel5A were purified from the culture filtrate of T. reesei QM 9414 as described previously (50, 51). Catalytic domain of TrCel7A (CDTrCel7A) was prepared by limited proteolysis of intact TrCel7A with papain according to Ref. 10. Aspergillus β-glucosidase was purified from Novozyme® 188 (C6105, Sigma) as described before (52). Enzyme concentration was determined from absorbance at 280 nm using molar extinction coefficients of 84,400, 78,000, 78,250, and 180,000 M−1 cm−1 for TrCel7A, TrCel5A, CDTrCel7A, and β-glucosidase, respectively.
Celluloses
BC was prepared by laboratory fermentation of the Gluconobacter xylinum strain ATCC 53582 as described (53). 14C-Labeled bacterial cellulose (14C-BC) was prepared as BC, but the glucose carbon source was supplemented with 14C-glucose. In the case of 14C-BC, the cultivation flasks were also provided with a CO2 trap, and O2 was supplied by slowly pumping the air through the culture medium. 14C-BC had a specific activity of 450,000 dpm/mg. Amorphous cellulose (AC) was prepared from Avicel according to Ref. 53. The total concentration of cellulose was determined by the anthrone sulfuric acid method. Pretreated wheat straw (hereafter referred to as lignocellulose) was from Inbicon (Skærbæk, Denmark). Hydrothermal pretreatment of wheat straw was performed in the Inbicon IBUS pilot plant (54). Glucan, Klason lignin, xylan, and ash content of lignocellulose on a dry weight basis was 58.5, 26.4, 5.3, and 2.6%, respectively. For purification and handling of lignocellulose, see Ref. 55.
Hydrolysis of Cellulose under Single-turnover Conditions
Experiments were performed in 50 mm sodium acetate buffer, pH 5.0, containing BSA (0.1 mg ml−1) at 25 °C. Cellulases (supplemented with 0.12 μm β-glucosidase) were mixed with uniformly 14C-labeled bacterial cellulose (14C-BC, 0.5 mg ml−1) to start the hydrolysis. At the selected time, an equal volume of non-labeled AC (10 mg ml−1) was added to trap all unbound cellulases. Under these conditions, each bound cellulase was allowed to perform only a single processive run on 14C-BC. For time points, 0.2-ml aliquots were withdrawn and added to 20 μl of 1 m NaOH to stop the reaction. After separation of cellulose by centrifugation, the radioactivity in the supernatant was quantified using a liquid scintillation counter. For the background measurements (“leakage” of trap), separate experiments were performed where AC was added to 14C-BC before cellulases. Because of the dynamic exchange between cellulases bound to 14C-BC and the AC trap, there will always be a small number of attacks on 14C-BC after the addition of an AC trap. This is represented by the leakage of trap, and all hydrolysis data were corrected for the corresponding leakage (56). The magnitude of leakage was dependent on the concentration and composition of the enzyme mixture, but in most cases it remained within 10% of the radioactivity reading of the corresponding hydrolysis experiments. In the experiments performed in the presence of EG, the radioactivity released by EG for the moment of the trap addition (no detectable release of radioactivity by EG was observed after the AC trap addition) was also subtracted. Thus, the data represent the radioactivity released by CBH.
Determination of [ES]trap
The concentration of cellulase-cellulose complex at the moment of the trap addition ([ES]trap) was measured by quantification of the inhibition of the hydrolysis of MUL by BC (56). For that, BC (0.5 mg ml−1) was incubated with cellulases in the presence of 5 μm MUL in 50 mm sodium acetate buffer, pH 5.0, containing BSA (0.1 mg ml) at 25 °C. Reactions were supplemented with 0.85 μm β-glucosidase to avoid the inhibition of MUL hydrolysis by cellobiose released from BC. Hydrolysis was stopped by the addition of an equal volume of 0.2 m ammonium hydroxide. After separation of cellulose by centrifugation, the released 4-methylumbelliferone (MU) was quantified from the fluorescence of the supernatant. Excitation and emission wavelengths were set to 360 and 450 nm, respectively. The concentration of the population of TrCel7A with the free active site (i.e. free to hydrolyze MUL; [TrCel7A]FA) was found from the calibration curves of MUL hydrolysis made in the absence of cellulose. [ES]trap was found as the difference of total concentration of TrCel7A ([TrCel7A]Total) and [TrCel7A]FA (56).
Hydrolysis of Cellulose under “Steady State” Conditions
All experiments were performed in 50 mm sodium acetate buffer, pH 5.0, containing BSA (0.1 mg ml−1) and β-glucosidase (0.85 μm) at 25 °C. BC (0.1–2.5 mg ml−1) was incubated with 0.5 μm TrCel7A or CDTrCel7A. If present, the concentration of EG (TrCel5A) was 0.1 μm. At selected times (between 1 and 30 min), 0.45-ml aliquots were withdrawn and added to 5 μl of 10 mm MUL. After 30 s, 0.45 ml of 0.2 m ammonium hydroxide was added to stop the reaction. Cellulose was separated by centrifugation, and the concentration of MU was found from the fluorescence of the supernatant. After fluorescence measurements, 0.105 ml of 1 m acetic acid was added to 0.8 ml of supernatant, and the concentration of glucose was measured using a glucose oxidase peroxidase assay as described (55). Zero data points were treated identically, but the enzymes were added after ammonium hydroxide. [TrCel7A]FA was found from the released [MU] using calibration curves of MUL hydrolysis made in the absence of cellulose. The concentration of TrCel7A with the active site occupied by the cellulose chain ([TrCel7A]OA) was found from the difference [TrCel7A]OA = [TrCel7A]Total - [TrCel7A]FA.
In the case of lignocellulose, lignocellulose (1.0–10 mg ml−1 dry matter) was incubated (shaking at 500 rpm) with 2.5 μm TrCel7A or CDTrCel7A in the presence of 0.5 mm pNPL. If present, the concentration of EG (TrCel5A) was 0.25 μm. After 30 min of hydrolysis, the reaction mixtures were rapidly pressed through a glass fiber filter (GF/D from Whatman) mounted to a 1-ml syringe. The filtrate was centrifuged (1 min, 10,000 × g), and 0.4 ml of supernatant was added to 0.4 ml of 0.2 m ammonium hydroxide. Released para-nitrophenol (pNP) was quantified from the absorbance at 414 nm. [TrCel7A]FA ([TrCel7A]OA = [TrCel7A]Total − [TrCel7A]FA) was found from [pNP] using the calibration curves of pNPL hydrolysis made in the absence of cellulose. After absorbance measurements, 0.105 ml of 1 m acetic acid was added to 0.8 ml of supernatant, and the concentration of glucose was measured using the hexokinase assay as described (55). Control experiments without pNPL were run in parallel to account for the background absorbance from lignocellulose. Zero data points were treated identically, but the enzymes were added after ammonium hydroxide.
Determination of the Values of the Observed Rate Constant (kobs)
This was performed essentially as described (55). The time courses of glucose formation in hydrolysis of BC under “steady state” conditions were first converted to the rates of glucose formation. For that, the hydrolysis data were fitted to an empirical function that explicitly and without systematic deviation described the data. Rates of glucose formation were calculated using the values of parameters obtained from the above mentioned fitting of the data and the first order derivative of the empirical function (55). The values of kobs were found from the rates of cellobiose formation (taken as a half of the corresponding rate of glucose formation) and [TrCel7A]OA according to Equation 6. Values of [TrCel7A]OA were found from the inhibition of the hydrolysis of MUL by BC.
In the case of lignocellulose substrate, average velocities after 30 min of hydrolysis were used to calculate kobs values. Here the [TrCel7A]OA values were found from the inhibition of the hydrolysis of pNPL by lignocellulose.
Determination of the DSE in Hydrolysis of Cellulose
The values of DSE were found at three different levels. (i) DSE at the level of glucose formation (DSEGlc) represents the ratio of glucose produced by the mixture of TrCel7A and TrCel5A to glucose produced by individual TrCel7A. Low levels of glucose produced by individual TrCel5A were not accounted for in calculating DSEGlc. (ii) DSE at the level of [TrCel7A]OA (DSEOA) represents the ratio of [TrCel7A]OA measured for the mixture of TrCel7A and TrCel5A to [TrCel7A]OA measured for individual TrCel7A. (iii) DSE at the level of kobs (DSEk) represents the ratio of kobs measured for the mixture of TrCel7A and TrCel5A to kobs measured for individual TrCel7A.
Inhibition of TrCel7A by Cellobiose
All experiments were performed in 50 mm sodium acetate buffer, pH 5.0, containing BSA (0.1 mg ml−1) at 25 °C. In the case of the single-turnover approach 14C-BC (0.5 mg ml−1) was incubated with 1.0 μm TrCel7A in the presence of added cellobiose (0–20 mm). If present, the concentration of TrCel5A was 0.1 μm. Series made without added cellobiose were provided with 0.125 μm β-glucosidase. The AC trap was added after 10 or 30 s from the initiation of the hydrolysis of 14C-BC for the series made with or without the presence of TrCel5A, respectively. Suspensions of AC were also supplemented with cellobiose at appropriate concentrations.
To study the cellobiose inhibition of TrCel7A in “steady state,” the hydrolysis of 14C-BC (0.25 mg ml−1) by TrCel7A (0.25 μm) in the presence of added cellobiose was followed. If present, the concentration of TrCel5A was 0.025 μm. Series without added cellobiose were provided with 0.125 μm β-glucosidase. Hydrolysis was started with the addition of enzymes, and at selected times, 0.2-ml aliquots were withdrawn and added to 20 μl of 1 m NaOH to stop the reaction. After separation of cellulose by centrifugation, the radioactivity in the supernatant was quantified using a liquid scintillation counter. In making zero time points, NaOH was added to 14C-BC before enzymes.
RESULTS
Hydrolysis of Cellulose under Single-turnover Conditions
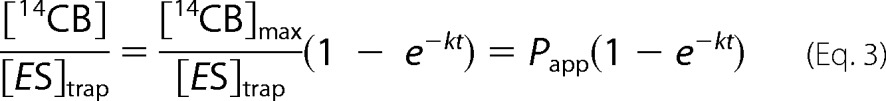
Recently, we described a method for the measurement of the apparent processivity (Papp) of CBHs under single-turnover conditions (56). The method relies on the hydrolysis of uniformly 14C-labeled bacterial cellulose (14C-BC). Cellulases are mixed with 14C-BC to start the hydrolysis, and after a short interval, an excess of non-labeled AC is added to trap all unbound cellulases. Under these conditions, each bound cellulase is allowed to perform only a single processive run on 14C-BC. The time course of the formation of 14C-cellobiose (14CB) should follow the exponent in the form,
where [14CB]max is the leveling off value of [14CB], and k is the pseudo first order rate constant for passing through one processive run. The value of [14CB]max depends on (i) the concentration of productive cellulase-cellulose complexes at the moment of the trap addition ([ES]trap) and (ii) an average number of cellobiose units released during a single run (i.e. the Papp of cellulase) (56). To meet single-turnover conditions, the trap must be added before the enzyme has dissociated after completion of a processive run. Fig. 1A shows the release of 14C-cellobiose in hydrolysis of 14C-BC by TrCel7A with different times of the addition of trap. Hydrolysis data were fitted to Equation 1 to obtain [14CB]max and k values. Higher [14CB]max values were observed with increasing the time of the trap addition, whereas the values of k were unaffected (supplemental Table S1). The increase in [14CB]max values with increasing time of the trap addition can be a result of repeated initiations and/or an increased number of first initiations (higher [ES]trap). In the latter case, Papp should be independent of the time of the trap addition, whereas in the former case, Papp is expected to increase with increasing time of the trap addition. To find Papp from the value of [14CB]max, the value of [ES]trap must be available. For TrCel7A, a recently developed method for the quantification of the TrCel7A population with the active site occupied by the cellulose chain ([TrCel7A]OA) can be applied to find the values of [ES]trap (55, 56). Assuming that initial binding through the active site is productive, we can use [TrCel7A]OA to account for [ES]trap. Although this seems a plausible assumption for TrCel7A in the early stage of the reaction (first 30 s) (55), it cannot be generalized. This is the reason for the mixed use of the terms [ES]trap and [TrCel7A]OA here. Whereas [ES]trap is the correct term to appear in the equations, the use of [TrCel7A]OA to account for [ES]trap assumes that all complexes that prevent the hydrolysis of MUL are productive cellulase cellulose complexes. Fig. 1B shows the build-up of [TrCel7A]OA in time measured using the hydrolysis of MUL as a reporter reaction. Binding kinetics was consistent with a simple exponential function (solid lines in Figs. 1B and 2B),
where [TrCel7A]OA-max is the plateau value of TrCel7A bound to BC via the active site, and kon(obs) is the pseudo first order rate constant for binding that depends on cellulose concentration. Transit times for binding (1/kon(obs)) measured at a BC concentration of 0.5 mg ml−1 were between 5 and 10 s. For the values of [TrCel7A]OA-max and kon(obs) at different TrCel7A concentrations, see supplemental Table S2. Provided with [ES]trap, Equation 1 can now be expressed in the following form.
 |
After dividing the released [14CB] with corresponding [ES]trap, all curves made with different times of the trap addition merge (Fig. 1C) and result in the same Papp value within the error limits (supplemental Table S1). This confirms that the number of repeated initiations was not significant within the studied conditions. Increasing the concentration of TrCel7A resulted in increased [14CB]max, but the Papp was independent of [TrCel7A] (supplemental Fig. S1 and Table S1). However, obvious systematic deviation was observed in fitting the data (up to 1800 s) to Equation 3 (Fig. 1D), and an equation consisting of a sum of two exponents was necessary to fit the data (Equation 4),
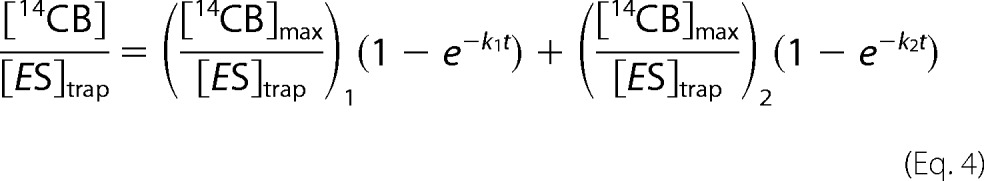 |
where subscripts 1 and 2 denote the parameters for the first and the second exponent, respectively. The second exponent had an about 10-fold longer transit time and smaller amplitude than the first exponent (Fig. 1D). We propose that the second exponent represents the small population of enzymes that progress with higher Papp. Another possibility is that the two populations have the same Papp but different velocity of the processive movement. Because [TrCel7A]OA accounts only for total [ES]trap, it is not possible to discriminate between these two possibilities experimentally. Therefore, we further focused on the first 180 s of the time course where the systematic deviation from Equation 3 was negligible. Combining the data obtained using different times of the trap addition and different TrCel7A concentrations (supplemental Table S1) resulted in an average Papp value of 66 ± 7 (Table 1).
FIGURE 1.

Hydrolysis of 14C-BC by TrCel7A under single-turnover conditions. A, 14C-BC (0.5 mg ml−1) was incubated with 1.0 μm TrCel7A. An AC trap was added after 10 s (□), 30 s (♢), or 60 s (△) of hydrolysis, and the release of 14CB in time was followed. B, [TrCel7A]OA was measured from the inhibition of the hydrolysis of MUL by BC (0.5 mg ml−1). [TrCel7A] was 0.1 μm (○), 0.25 μm (△), 0.5 μm (♢), or 1.0 μm (□). Solid lines are from the non-linear regression according to Equation 2. C, data from A divided by the corresponding concentration of TrCel7A at the moment of the AC trap addition ([ES]trap). Values of [ES]trap were taken from B using an assumption that [ES]trap = [TrCel7A]OA. D, average [14CB]/[ES]trap ratios over experiments with different TrCel7A concentrations and different times of trap addition. Shown is non-linear regression according to the single exponent (Equation 3; dotted line) or to the sum of two exponents (Equation 4; solid line). The dashed line and the dashed and dotted line represent the fast and slow components of Equation 4, respectively. Error bars show S.D. and are from at least three independent measurements.
FIGURE 2.

Synergism in hydrolysis of 14C-BC by TrCel7A and EG TrCel5A under single-turnover conditions. ♢, TrCel7A; ♦, TrCel7A + EG; △, CDTrCel7A; ▴, CDTrCel7A + EG. Concentration of TrCel7A or CDTrCel7A was 1.0 μm. If present, the concentration of EG (TrCel5A) was 0.1 μm. A, release of 14CB in hydrolysis of 14C-BC (0.5 mg ml−1). AC trap was added after 10 s of hydrolysis. B, concentration of TrCel7A with the active site occupied by the cellulose chain ([TrCel7A]OA) was measured from the inhibition of the hydrolysis of MUL by BC (0.5 mg ml−1). Solid lines are from the non-linear regression according to Equation 2. Error bars show S.D. and are from at least three independent measurements.
TABLE 1.
Values of kinetic parameters for TrCel7A from single-turnover experiments
| Enzyme(s)a | [14CB]maxb | [ES]trapc | Pappd | kb | kcate |
|---|---|---|---|---|---|
| μm | μm | CB units | s−1 | s−1 | |
| TrCel7A | 15 ± 2 | 0.22 ± 0.10 | 66 ± 7f | 0.033 ± 0.006f | 2.2 ± 0.5f |
| TrCel7A + EG | 34 ± 2 | 0.67 ± 0.01 | 50 ± 3 | 0.030 ± 0.005 | 1.5 ± 0.2 |
| CDTrCel7A | 4.9 ± 0.5 | 0.089 ± 0.05 | |||
| CDTrCel7A + EG | 11 ± 2 | 0.28 ± 0.02 | 40 ± 6 | 0.031 ± 0.025 | 1.2 ± 0.4 |
a Experimental conditions were as follows: [14C-BC] = 0.5 mg ml−1, [TrCel7A] or [CDTrCel7A] = 1.0 μm, [β-glucosidase] = 0.125 μm, 25 °C, pH 5.0. If present, the concentration of EG (TrCel5A) was 0.1 μm. An AC trap was added after 10 s of hydrolysis.
b Values of [14CB]max and k were found by non-linear regression of [14C-cellobiose] released under single-turnover conditions according to Equation 1.
c Concentration of TrCel7A at the moment of trap addition ([ES]trap) represents the population of TrCel7A with the active site occupied by the cellulose chain ([TrCel7A]OA) after 10 s of hydrolysis.
d Apparent processivity of TrCel7A (Papp, in cellobiose units) was found from the values of [14CB]max and [ES]trap according to Equation 3.
e The value of kcat was found from the values of k and Papp according to Equation 5.
f These values are averages over values obtained at different TrCel7A concentrations and at different times of trap addition (supplemental Table S1).
The rate constant k in Equations 1 and 3 is related to the catalytic constant (kcat) that represents the rate constant leading from one productive complex through catalytic events to another productive complex 1 cellobiose unit further on the cellulose chain according to Equation 5,
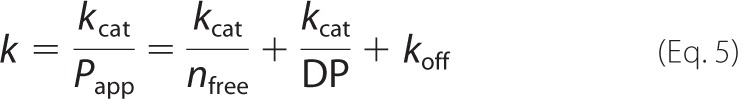 |
where nfree is the average length of the obstacle-free path (in cellobiose units) on cellulose (55), DP is the degree of polymerization of cellulose (in cellobiose units), and koff is the dissociation rate constant of TrCel7A from cellulose (s−1). koff is related to kcat and intrinsic processivity (PIntr) according to koff = kcat/(PIntr − 1) (57). Depending of the values of nfree, DP, and PIntr, the value of Papp may be governed by the properties of the substrate (low nfree or DP) or the properties of the enzyme (low PIntr, i.e. high koff). An average DP of 14C-BC is around 1000 cellobiose units. In our previous study, we have estimated a PIntr value of 4000 ± 570 cellobiose units (koff value of 0.0007 ± 0.0001 s−1) for TrCel7A on reduced BC and proposed that Papp was limited by nfree (57). The results presented here are in accord with this. Combining the values of k (0.033 ± 0.006 s−1) and Papp (66 ± 7) resulted in a kcat value of 2.2 ± 0.5 s−1 for TrCel7A on 14C-BC (Table 1). This value is well in line with earlier estimates of kcat derived either from the rate measurements (57–60) or direct observations of the processive movement of TrCel7A along the cellulose chain (32, 61). Using the rate measurements over the period of 1–3 h, Fox et al. (62) concluded that the steady state rate of the hydrolysis is limited by the slow complex formation between BC and Cel7A from Trichoderma longibrachiatum. However, cellulose hydrolysis is more complicated because it displays burst kinetics where the steady state is preceded by the transient burst of activity (59, 60, 63, 64). As a result of the burst kinetics, the values of observed rate constants are primarily dependent on the measurement period (60, 64). Recent pre-steady state measurements of the activity of TrCel7A on cellulose demonstrated that the rates must be measured within first few s of hydrolysis to reveal the kcat value (60). Because of the specific reaction conditions, a single-turnover approach employed here allows us to measure kcat values without the need of a special apparatus for transient kinetics.
The performance of CDTrCel7A, the truncated form of TrCel7A that lacks CBM, was also tested under single-turnover conditions. CDTrCel7A displayed an about 3-fold lower [14CB]max than intact TrCel7A (Fig. 2 and Table 1). The low [14CB]max value resulted in a large uncertainty in the estimate of k for CDTrCel7A (Table 1). Because of the low level of binding, we were not able to measure the [ES]trap value and, therefore, also Papp and kcat values for CDTrCel7A.
Synergism between Endoglucanase and Cellobiohydrolase
First we studied the effect of EG on the performance of TrCel7A under single-turnover conditions. Supplementation of 1.0 μm TrCel7A with 0.1 μm EG TrCel5A resulted in an about 2-fold increase in [14CB]max, whereas the value of k remained unaffected (Fig. 2 and Table 1). Because TrCel5A has no MUL hydrolyzing activity, [TrCel7A]OA and hence [ES]trap can be measured also in the presence of TrCel5A. EG resulted in an about 3-fold increase in [ES]trap. Because the increase in [ES]trap exceeded the increase in [14CB]max, somewhat lower Papp and kcat values were observed in the presence of EG (Table 1). The addition of EG promoted the binding of CDTrCel7A to the level that allowed the quantification of [ES]trap, Papp, and kcat also for CDTrCel7A (Fig. 2 and Table 1).
If the AC trap is omitted, “steady state” is established in hydrolysis of BC by TrCel7A (Fig. 3A). Note that in most parts of this study, we use the term “steady state” merely to distinguish between experimental conditions (i.e. “steady state” versus single-turnover conditions). The term is enclosed in quotation marks to indicate this use. The addition of 0.1 μm TrCel5A to 0.5 μm TrCel7A resulted in an about 8-fold increase in the “steady state” rate of hydrolysis. A synergistic effect between TrCel5A and CDTrCel7A was also evident, but the activity of the CDTrCel7A-containing mixture was far lower (Fig. 3A). In the case of individual enzymes, about 70 and 20% of TrCel7A and CDTrCel7A, respectively, were bound via the active site, and these values were fairly constant in time (Fig. 3B). Somewhat higher [TrCel7A]OA values were observed in the presence of EG. The situation was more complicated with synergistic mixture containing CDTrCel7A. In this case, an initial increase in [CDTrCel7A]OA was followed by its rapid decrease, and after 30 min of hydrolysis, the amount of CDTrCel7A bound through the active site was negligible (Fig. 3B). Provided with the rate of cellobiose formation (vCB) and [TrCel7A]OA, one can calculate the value of the observed rate constant for cellulose hydrolysis (kobs) using Equation 6 (55).
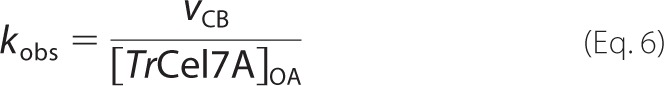 |
Note that although the experiments were performed in the presence of excess β-glucosidase activity and the formation of glucose was measured, it is more appropriate to express the rates and kobs values on the basis of cellobiose formation, which is the main product of the TrCel7A-catalyzed hydrolysis of cellulose. As seen in Fig. 3C, the presence of EG caused a significant increase in kobs values in the case of both TrCel7A and CDTrCel7A.
FIGURE 3.

Synergism in hydrolysis of BC by TrCel7A and EG TrCel5A. TrCel7A (♢), TrCel7A + EG (♦), CDTrCel7A (△), CDTrCel7A + EG (▴). Concentration of TrCel7A or CDTrCel7A was 0.5 μm, and that of β-glucosidase was 0.85 μm. If present, the concentration of EG was 0.1 μm. Error bars show S.D. and are from three independent measurements. In A–C, concentration of BC was 0.5 mg ml−1. A, glucose formation. B, concentration of TrCel7A with the active site occupied by the cellulose chain ([TrCel7A]OA) was measured from the inhibition of the hydrolysis of MUL by BC (0.5 mg ml−1). C, values of the observed rate constant (kobs) were found from the rates of cellobiose formation (recalculated from the rates of glucose formation) and values of [TrCel7A]OA according to Equation 6. D–F, data points were taken after 2, 5, and 10 min of hydrolysis. D, glucose formation after 10 min of hydrolysis. E, average values over all time points are plotted. Because of systematic variation in time, only 10 min data point values are plotted for the series with CDTrCel7A + EG. F, average kobs values over all time points are plotted. DSE values at different BC concentrations are listed in Table 2.
All of the measurements described above (Fig. 3, A–C) were performed at a BC concentration of 0.5 mg ml−1. Because the synergistic hydrolysis of BC is inhibited by the substrate (42), we next measured [TrCel7A]OA and kobs values at different BC concentrations. At the level of glucose formation, the substrate inhibition was revealed only in the case of a synergistic mixture containing intact TrCel7A (Fig. 3D). Although TrCel7A clearly outperformed CDTrCel7A at low [BC] values, their activities were the same at the highest [BC] tested (Fig. 3D). Plotting [TrCel7A]OA as a function of [BC] demonstrates higher binding affinity of intact TrCel7A compared with CDTrCel7A. The addition of EG resulted in an increase in [TrCel7A]OA, whereas the opposite was observed in the case of CDTrCel7A (Fig. 3E). The dependence of kobs on [BC] reveals different patterns for individual enzymes and synergistic mixtures (Fig. 3F). Synergistic mixtures displayed a significant decrease in kobs values with increasing [BC], whereas for individual enzymes, kobs values were virtually independent of [BC]. About the same kobs values were found for intact TrCel7A and CDTrCel7A in the case of both individual enzymes and synergistic mixtures (Fig. 3F). For the quantitative description of synergism, the DSE values were calculated. Table 2 lists the DSE values at three different levels: glucose formation (DSEGlc), [TrCel7A]OA (DSEOA), and kobs (DSEk). For intact TrCel7A, the highest DSE values were observed at the level of glucose formation, whereas for CDTrCel7A, the highest DSE was observed at the level of kobs. Because the rate of glucose (or cellobiose) formation is the product of [TrCel7A]OA and kobs (Equation 6), the DSEGlc should also be the product of DSEOA and DSEk. The highest DSE values on the level of kobs found for CDTrCel7A are due to the negative effect of EG on [CDTrCel7A]OA (DSEOA values less than 1; Table 2). With the DSEOA for CDTrCel7A as an exception, the DSE values at all levels decreased with increasing [BC] (Table 2).
TABLE 2.
DSE between CBH TrCel7A and EG TrCel5A in hydrolysis of BC
| BC |
TrCel7A and TrCel5Aa |
CDTrCel7A and TrCel5Aa |
||||
|---|---|---|---|---|---|---|
| DSEGlcb | DSEOAc | DSEkd | DSEGlcb | DSEOAc | DSEkd | |
| mg ml−1 | ||||||
| 0.1 | 23 ± 7.9 | 1.7 ± 0.70 | 14.5 ± 5.3 | |||
| 0.25 | 12 ± 1.6 | 1.5 ± 0.32 | 7.8 ± 2.4 | 5.3 ± 1.9 | 0.25 ± 1.30 | 12.5 ± 2.4 |
| 0.5 | 7.7 ± 0.8 | 1.3 ± 0.15 | 5.6 ± 1.2 | 4.8 ± 1.3 | 0.64 ± 0.33 | 5.9 ± 1.3 |
| 1.0 | 4.5 ± 0.5 | 1.1 ± 0.04 | 4.0 ± 1.3 | 4.4 ± 0.9 | 0.63 ± 0.03 | 5.2 ± 2.4 |
| 2.5 | 3.0 ± 0.7 | 1.1 ± 0.03 | 2.7 ± 1.0 | 2.6 ± 0.4 | 0.81 ± 0.14 | 2.6 ± 0.8 |
a Experimental conditions were as follows: [TrCel7A] or [CDTrCel7A] = 0.5 μm, [β-glucosidase] = 0.85 μm, 25 °C, pH 5.0. If present, the concentration of EG (TrCel5A) was 0.1 μm. Samples were withdrawn after 2, 5, and 10 min of hydrolysis and analyzed for glucose formation and [TrCel7A]OA.
b DSE on the level of glucose formation (DSEGlc) represents the ratio of glucose produced by the mixture of TrCel7A and TrCel5A to glucose produced by individual TrCel7A. Glucose formation after 10 min of hydrolysis was used in calculations of DSEGlc. Low levels of glucose produced by individual 0.1 μm TrCel5A were not accounted for in calculating DSEGlc.
c DSE on the level of [TrCel7A]OA (DSEOA) represents the ratio of [TrCel7A]OA measured for the mixture of TrCel7A and TrCel5A to [TrCel7A]OA measured for individual TrCel7A. For series with intact TrCel7A, an average value of [TrCel7A]OA taken over all time points was used in calculations of DSEOA, whereas for CDTrCel7A, a [CDTrCel7A]OA measured after 10 min of hydrolysis was used.
d DSE on the level of observed rate constant (kobs) (DSEk) represents the ratio of kobs measured for the mixture of TrCel7A and TrCel5A to kobs measured for individual TrCel7A. An average value of kobs taken over all time points was used in calculations of DSEk.
Synergism was also assessed on lignocellulose as substrate. As in the case of BC, the affinity of intact TrCel7A toward lignocellulose was higher than that of CDTrCel7A, but no substrate inhibition was observed within the concentration range of lignocellulose studied (Fig. 4A). The addition of EG (10% on a molar basis) resulted in a significant synergistic effect (Fig. 4A), with average DSEGlc values of 3.2 ± 0.3 and 2.5 ± 0.2 for TrCel7A and CDTrCel7A, respectively. EG did not increase the amount of TrCel7AOA (Fig. 4B), suggesting that the availability of chain ends on lignocellulose was not limiting under the study conditions, and the synergistic effect was caused by the increase in kobs values. It must be noted, however, that we observed the binding of pNP (the product of the hydrolysis of pNPL used as a reporter molecule for [TrCel7AOA]) to lignocellulose. Binding of MU to lignocellulose was even stronger, and this was the reason why pNPL was used instead of MUL here. Because of the binding of pNP to lignocellulose, the measured [TrCel7AOA] and kobs values are somewhat over- and underestimated, respectively. For this reason, the DSEOA and DSEk values on lignocellulose must also be treated with caution. For the DSEGlc, DSEOA, and DSEk values at different lignocellulose concentrations, see supplemental Table S3.
FIGURE 4.
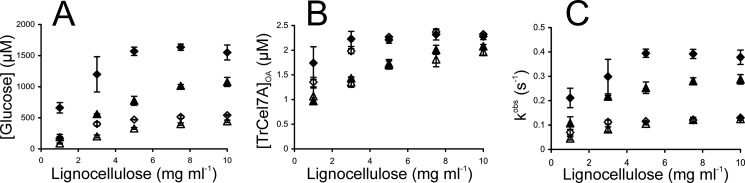
Synergism in hydrolysis of lignocellulose by TrCel7A and EG TrCel5A. ♢, TrCel7A; ♦, TrCel7A + EG; △, CDTrCel7A; ▴, CDTrCel7A + EG. Concentration of TrCel7A or CDTrCel7A was 2.5 μm, and that of β-glucosidase was 0.85 μm. If present, the concentration of EG was 0.25 μm. Hydrolysis time was 30 min. Error bars show S.D. and are from three independent measurements. A, glucose formation. B, concentration of TrCel7A with the active site occupied by the cellulose chain ([TrCel7A]OA) was measured from the inhibition of the hydrolysis of pNPL by lignocellulose. C, values of observed rate constant (kobs) were found from the rates of cellobiose formation (recalculated from the rates of glucose formation) and values of [TrCel7A]OA according to Equation 6. DSE values at different lignocellulose concentrations are listed in supplemental Table S3.
Inhibition of TrCel7A by Cellobiose
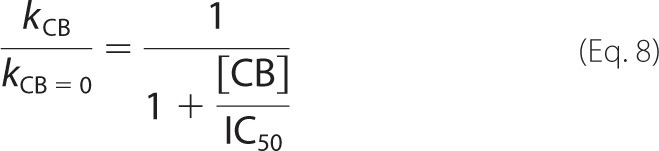
Inhibition of TrCel7A by cellobiose was studied using both single-turnover and “steady state” conditions. The addition of cellobiose clearly reduced the amount of 14C-cellobiose released under single-turnover conditions (Fig. 5A). Fitting of the data to Equation 1 revealed that the values of both [14CB]max and k decreased with increasing concentration of added cellobiose (Fig. 5, B and C). Because the method for quantification of [TrCel7A]OA is not applicable in the presence of cellobiose (55), it is not possible to address the effect of cellobiose on Papp and kcat experimentally. However, strong limitation of Papp of TrCel7A by nfree on BC (57) suggests that the decrease in [14CB]max is caused by the decrease in [ES]trap rather than in Papp. The inhibition of TrCel7A by cellobiose was also studied in the presence of EG (supplemental Fig. S2). The effect of cellobiose on [14CB]max and k observed in the presence of EG was similar to that for individual TrCel7A (Fig. 5, B and C). IC50 values for cellobiose inhibition were found by fitting the data to the hyperbolic functions,
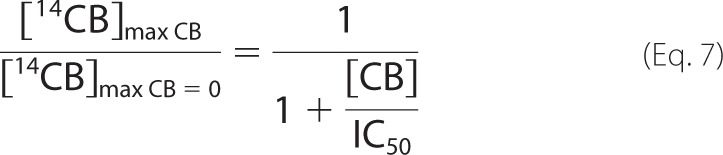 |
and
 |
where [CB] is the concentration of added cellobiose (mm), and subscripts CB and CB = 0 refer to the parameters measured in the presence and the absence of added cellobiose, respectively. Because of the scattering of data points, the data obtained for the individual TrCel7A and for the mixture of TrCel7A and TrCel5A were combined and analyzed together to estimate IC50 values. In this way, the IC50 values of 3.2 ± 0.8 mm and 2.2 ± 0.7 mm were found for cellobiose inhibition of [14CB]max and k, respectively. For the numerical values of [14CB]max and k measured in the presence of cellobiose, see supplemental Table S4.
FIGURE 5.
Cellobiose inhibition of TrCel7A on 14C-BC under single-turnover conditions. Error bars show S.D. and are from three independent measurements. A, release of 14CB in the presence of added cellobiose at 0 mm (♢), 0.5 mm (△), 2.0 mm (○), 5.0 mm (×), or 20 mm (□). Concentration of 14C-BC and TrCel7A was 0.5 mg ml−1 and 1.0 μm, respectively. Series without added cellobiose were provided with 0.125 μm β-glucosidase. An AC trap was added after 30 s of hydrolysis. B and C, effect of added cellobiose on parameters of single-turnover kinetics, [14CB]max and k. Values of parameters (listed in supplemental Table S4) were found by non-linear regression of the hydrolysis data in A (for TrCel7A) or supplemental Fig. S2 (for TrCel7A + EG) according to Equation 1. Subscripts CB and CB = 0 refer to the parameters measured in the presence and absence of cellobiose, respectively. ♢, TrCel7A; ♦, TrCel7A + EG.
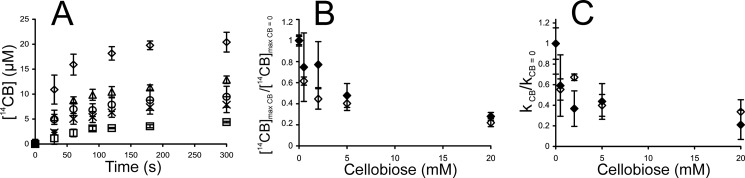
To study cellobiose inhibition of TrCel7A in “steady state,” the hydrolysis of 14C-BC (0.25 mg ml−1) was followed over a longer time (2 min to 3 h). The final degree of degradation of 14C-BC ranged from 10 to 80%, depending on the experimental conditions. Fig. 6, A and B, shows the time courses of degradation of 14C-BC by individual TrCel7A and by the mixture of TrCel7A and TrCel5A in the presence of cellobiose at different concentrations. In the case of series without added cellobiose, the experiments were provided with β-glucosidase to prevent the inhibition of TrCel7A by cellobiose released during hydrolysis. The strength of cellobiose inhibition was analyzed using the plots in coordinates ([14CB]CB/[14CB]CB = 0) versus [cellobiose], where [14CB]CB and [14CB]CB = 0 are the concentrations of released 14C-cellobiose in the experiments with and without added cellobiose, respectively (Fig. 6C). The ratio of [14CB]CB/[14CB]CB = 0 at a certain concentration of added cellobiose was first found for each time point in Fig. 6, A and B, and Fig. 6C plots the average values taken over all time points. No or little systematic variation of [14CB]CB/[14CB]CB = 0 with hydrolysis time was observed (e.g. see supplemental Table S5). In the case of a synergistic mixture of TrCel7A and TrCel5A, the amount of cellobiose released during hydrolysis was significant (the curve with no added cellobiose and β-glucosidase in Fig. 6B) and was accounted for in generating the plot in Fig. 6C.
FIGURE 6.

Cellobiose inhibition of TrCel7A on 14C-BC in “steady state.” A and B, release of 14CB in hydrolysis of 14C-BC by individual TrCel7A (A) or TrCel7A + EG (B). The concentration of 14C-BC and TrCel7A was 0.25 mg ml−1 and 0.25 μm, respectively. If present, the concentration of EG (TrCel5A) was 0.025 μm. Series without added cellobiose were provided with 0.125 μm β-glucosidase (♢). Concentration of added cellobiose was 0 mm (♢), 0 mm without β-glucosidase (♦), 0.2 mm (*), 0.5 mm (△), 1.0 mm (+), 2.0 mm (○), 5.0 mm (×), or 10 mm (□). C and D, hydrolysis data were rearranged to obtain the ratio of ([14CB]CB/[14CB]CB = 0) for each time point. Subscripts CB and CB = 0 refer to the measurements in the presence and absence of cellobiose, respectively. Plotted are average values over all time points (except TrCel7A + EG) with corresponding error bars (S.D.). Solid lines are from the non-linear regression according to supplemental Equation S1 (individual enzymes) or Equation 9 (synergistic mixtures). C, TrCel7A (♢) and TrCel7A + EG (♦). D, CDTrCel7A (△) and CDTrCel7A + EG (▴).
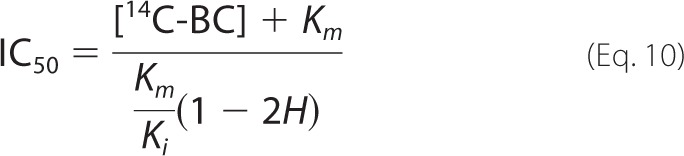
For calculation of IC50 values (listed in Table 3), the data for synergistic hydrolysis were first fitted to simple hyperbolae for competitive inhibition,
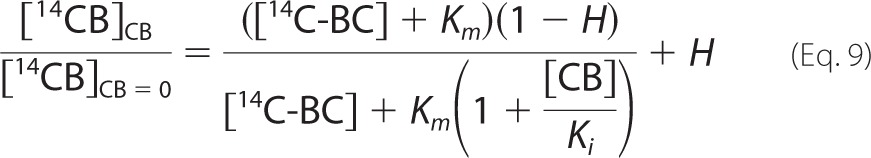 |
where [CB] is the concentration of added cellobiose, [14C-BC] is cellulose concentration (mg ml−1), Km is the Michaelis constant for cellulose (mg ml−1), Ki is the inhibition constant for cellobiose (mm), and H is a parameter that accounts for the background radioactivity (i.e. the radioactivity reading that is independent of TrCel7A). In the non-linear regression analysis, the value of [14C-BC] was fixed to a value used in the experiments. The values of Km, Ki, and H obtained from the fitting of the data to Equation 9 were further used to calculate the values of IC50 using Equation 10.
 |
It must be noted that, although we used equations for competitive inhibition (Equations 9 and 10), the assumption about the type of inhibition is not important in the context of deriving IC50 values. The equations for other types of reversible inhibition like non-competitive, uncompetitive, or mixed type of inhibition are equally well suited for this purpose. Likewise, the values of individual parameters, Km, Ki, and H, are not important. Important is their combination (Equation 10) that defines the value of IC50. Although this simplified approach does not permit one to distinguish between different types of inhibition, slightly higher IC50 values obtained at higher TrCel7A concentrations (supplemental Table S6) suggest non-competitive or mixed type inhibition. Unlike with the inhibition of synergistic mixture, a simple hyperbola (Equation 9) was not sufficient to describe the inhibition of individual TrCel7A. In the latter case, an equation accounting for two different modes of action was necessary to fit the data (supplemental Equation S1). The cellobiose inhibition of individual TrCel7A was somewhat weaker than the inhibition of the synergistic mixture (Table 3). Because the cellobiose inhibition of TrCel5A is more than an order of magnitude weaker than that of TrCel7A (58), the cellobiose inhibition of the synergistic mixture apparently represents the inhibition of the CBH component. The strength (Table 3) and pattern (Fig. 6D and supplemental Fig. S3) of cellobiose inhibition of CDTrCel7A and intact TrCel7A was similar in the case of both individual enzymes and synergistic mixtures.
TABLE 3.
CB inhibition of TrCel7A in “steady state”
| Enzyme(s)a | IC50 for CBb |
|---|---|
| mm | |
| TrCel7A | 0.65 ± 0.15 |
| TrCel7A + EG | 0.38 ± 0.03 |
| CDTrCel7A | 0.72 ± 0.28 |
| CDTrCel7A + EG | 0.46 ± 0.07 |
a Experiment conditions were as follows: [14C-BC] = 0.25 mg ml−1, [TrCel7A] or [CDTrCel7A] = 0.25 μm, 25 °C, pH 5.0. If present, the concentration of EG (TrCel5A) was 0.025 μm.
b IC50 for cellobiose was found from the data in Fig. 6, C and D, using non-linear regression according to supplemental Equation S1 (for individual TrCel7A or its CD) or Equation 9 (for synergistic mixture).
DISCUSSION
Processive CBHs are the key components of the efficient fungal cellulase systems. However, the molecular mechanisms of their mode of action are still not fully understood. The major obstacle in advancing our knowledge has been the lack of biochemical methods for assessing different molecular steps of the hydrolysis of the insoluble and heterogeneous substrate. Here we attempted to fill this gap by introducing a single-turnover approach that was used in parallel with “steady state” measurements of TrCel7A-catalyzed hydrolysis of cellulose. A processive cycle of TrCel7A consists of at least six putative steps (Fig. 7A) (65). Measurement of the formation of [TrCel7A]OA in time (Figs. 1B and 2B) revealed that the binding through the active site was fast, with the transit times for steps a–c in Fig. 7A around 10 s. A recent study of transient kinetics also supports the fast complex formation between TrCel7A and cellulose (60). The kcat value 2.2 ± 0.5 s−1 (Table 1) predicts a transit time of about 0.45 s for passing through steps d–f in Fig. 7A. Transit times for single processive runs (Papp times steps d–f in Fig. 7A) found from the values of rate constants k (Table 1) were in the range of 30 s, and during this time, an average of 66 ± 7 cellobiose units were released (Table 1). Although different scenarios for CBM-assisted catalysis have been proposed (15, 16), the supporting biochemical evidence has remained elusive (17). Here we measured somewhat lower Papp and kcat values for CDTrCel7A compared with the intact enzyme, but the differences may not be significant, considering the error limits (Table 1). Thus, our data rather support the observations that CDTrCel7A moves along cellulose chain with the same velocity as intact TrCel7A (61).
FIGURE 7.

Hydrolysis of cellulose by processive CBH (A and B) and possible mechanism of synergism with EG (C). A, processive cycle of CBH consists of at least six putative steps as follows (65). a, CBM-mediated binding to the cellulose surface; b, finding and recognition of cellulose chain end; c, threading of cellulose chain into active site tunnel and formation of productive enzyme-substrate complex; d, hydrolysis of glycosidic bond; e, expulsion of product CB; f, threading another cellobiose unit to reform productive complex. Steps d–f are repeated until enzyme happens to dissociate or stops behind an obstacle (55). Transit times were found from the values of rate constants for the corresponding step(s). B, hydrolysis of cellulose by individual CBH. CBH cannot pass through the amorphous regions (wavy lines) and stalls. The length of the crystalline regions between amorphous parts defines the length of obstacle-free path (nfree), which also limits the apparent processivity (Papp) of CBH. The steady state rate of cellobiose formation is governed by the slow dissociation (koff value was taken from Ref. 57) of stalled CBH. C, synergistic hydrolysis of cellulose. EG accelerates the recruitment of CBH by degrading amorphous regions. Papp of CBH is determined by the DP of EG-fragmented cellulose surface (DPsurface), and the steady state rate of cellobiose formation approaches the limit set by the velocity of processive movement of CBH. Transit times correspond to the steps taken by the CBH depicted to the left of the cellulose. Conventional mechanism of endo-exo synergism is depicted to the right of the cellulose.
Our understanding of the mechanisms of synergism between EG and CBH cannot be in advance of our understanding of the rate limitations in CBH-catalyzed cellulose hydrolysis. Considering the crystalline nature of the substrate, the number of reducing chain ends available for CBH is expected to be low. The conventional explanation of endo-exo synergism assumes that the chain end availability is rate-limiting for CBH so that generation of new chain ends by EG will increase the population of productive CBH cellulose complexes (24). Consistent with that, we also found an increase in [TrCel7A]OA in the presence of EG under both single-turnover (Fig. 2B and Table 1) and “steady state” (Fig. 3 and Table 2) conditions. However, the increase in [TrCel7A]OA was far from being sufficient to account for the EG-caused increase in “steady state” rates. The majority of the synergistic effect came from the EG-caused increase in the rate constant (kobs) of the hydrolysis of BC by TrCel7A instead (Fig. 3 and Table 2). The increase in kobs points to the presence of an additional mechanism of synergy between TrCel7A and EG that is used in parallel with the conventional mechanism. At optimal enzyme/substrate ratios, the synergistic “steady state” kobs values (Fig. 3) approached the kcat value measured using single-turnover conditions (Table 1), meaning that in the presence of EG, the steady state rate becomes limited by the velocity of processive movement of TrCel7A. Recently, we proposed an obstacle model to describe the rate retardation in CBH-catalyzed cellulose hydrolysis (55). According to this, the retardation in hydrolysis rate is caused by the accumulation of stalled, non-productive CBH cellulose complexes (Fig. 7B). The comparison of transit times measured here for binding (10 s) and processive movement (30 s) and for the recruitment of TrCel7A (∼25 min) measured before (57) supports this model. Although the exact nature of obstacles remains elusive, our data suggest that they are related to the amorphous parts of BC. It is worth mentioning that the Papp value for TrCel7A was close to the leveling off DP value of BC, the DP value that cellulose preparation approaches during heterogeneous acid hydrolysis (25). Heterogeneous acid hydrolysis, like HCl-catalyzed hydrolysis, is limited with the degradation of easily accessible amorphous regions, whereas crystalline regions remain intact. Although difficult to address experimentally, the regularity of amorphous parts that disrupt the crystalline structure has been demonstrated in ramie cellulose (66, 67). We propose that TrCel7A cannot pass through and stalls after encountering amorphous parts on BC (Fig. 7B). The Papp of TrCel7A is thus limited by the length of crystalline regions between amorphous parts on BC, and this distance also defines the length of the obstacle-free path (nfree) for TrCel7A on this substrate (Fig. 7B). Because dissociation is much slower than association and processive run, the kobs of cellobiose formation in steady state becomes limited by nfreekoff. On the other hand, by preferentially targeting and degrading amorphous regions, EG removes the obstacles, and TrCel7A does not stall (Fig. 7C). In this way, EG accelerates the recruitment of TrCel7A, and the steady state kobs value of cellobiose formation approaches the value of true kcat. In the presence of EG, the Papp of TrCel7A will be apparently limited by the DP of cellulose chains on EG-fragmented cellulose surface (Fig. 7C). Similar kobs values found for synergistic hydrolysis with the mixtures containing intact TrCel7A or CDTrCel7A confirmed that the mechanism of synergy depicted in Fig. 7C is operative also in the case of CDTrCel7A. However, in synergistic hydrolysis, CDTrCel7A appeared to be inefficient in binding to cellulose through the active site (low levels of [CDTrCel7A]OA in Fig. 3B). This suggests that in the case of CDTrCel7A passing through steps ab and/or c in Fig. 7A are impaired on EG-generated chain ends.
The relative contribution of the conventional (characterized by DSEOA) and the novel (characterized by DSEk) mechanism of synergism was dependent on the enzyme/substrate ratio (Table 2). The relative contribution of the conventional mechanism was higher at high enzyme/substrate ratios. At low enzyme/substrate ratios, most of the TrCel7A molecules were bound through the active site even in the absence of EG and synergism revealed only at the level of kobs. Hydrolysis of BC is interesting in that it displays a phenomenon of substrate inhibition (42). However, substrate inhibition is revealed only in synergistic hydrolysis by the EG/CBH mixtures containing intact CBH (42). In our early study, we proposed that at a constant concentration of enzymes, an increase in BC concentration will result in lower surface density of EG-generated chain ends and therefore longer distances of lateral diffusion used by intact TrCel7A to catch the chain ends (step b in Fig. 7A) (42). However, we did not observe a decrease in the [TrCel7A]OA with increasing concentration of BC, and it was kobs of synergistic hydrolysis instead that decreased with increasing [BC] (Fig. 3). Decrease in kobs can still be described by the lower surface density of EG-generated chain ends at high BC concentrations. To avoid the stalling of TrCel7A, it is necessary that the EG-degraded amorphous region would be on the same cellulose chain and in front of the processively moving TrCel7A (Fig. 7C). The probability of the latter is expected to decrease with decreasing surface density of EG-degraded amorphous regions on BC. Because of the lower affinity of CDTrCel7A toward cellulose, in the case of synergistic mixtures containing CDTrCel7A, the decrease in kobs is apparently compensated for by the increase in population of bound CDTrCel7A with increasing BC concentration, and substrate inhibition at the level of glucose formation is not revealed (Fig. 3).
Cellobiose inhibition also reflects the mode of action and rate limitation of TrCel7A. Under single-turnover conditions, cellobiose reduced the number of initiations by competing with cellulose chain for binding to TrCel7A (reduced [14CB]max values) and also slowed the processive movement of TrCel7A (reduced k values). The strongest binding of cellobiose, with the Kd value of 20 μm, takes place in the product sites (glucose unit binding sites +1/+2 in Fig. 7A) of the active site tunnel of TrCel7A (68, 69). However, binding of cellobiose to the sites +1/+2 permits the formation of non-productive complex with cellulose chain bound to the sites −7/−1. Such a complex is expected because it also forms after the cleavage of the glycosidic bond in cellulose (step d in Fig. 7A). The IC50 value of 3.2 ± 0.8 mm found for cellobiose inhibition of [14CB]max apparently reflects the binding of cellobiose somewhere into minus sites of the active site tunnel, and this competes with the binding of the cellulose chain. Because the product sites must be empty before TrCel7A can step further on the cellulose chain (step f in Fig. 7A), the binding of cellobiose to the sites +1/+2 is expected to restrict the processive movement. This non-competitive component of inhibition is apparently responsible for the slower movement of TrCel7A in the presence of cellobiose. A recent computational study suggested that the product expulsion may be a rate-limiting factor in the processive cycle of TrCel7A (5). The about 100-fold higher IC50 value of cellobiose for k compared with the Kd value for its binding to the sites +1/+2, however, suggests that the product expulsion (step e in Fig. 7A) is not limiting for kcat (steps d–f in Fig. 7A). Cellobiose inhibition of TrCel7A in “steady state” (Table 3) was stronger than that observed for [14CB]max and k in single-turnover experiments. The competitive component of inhibition should decrease the number of initiations by the same factor in the case of both “steady state” and single-turnover conditions. Thus, our data indicate that both competitive and non-competitive components of inhibition are involved in cellobiose inhibition of the cellulose hydrolysis in the “steady state” resulting in an overall mixed type of inhibition. Somewhat stronger cellobiose inhibition observed in the case of synergistic mixture can now be explained by the increased contribution of the processive movement in controlling the “steady state” rate of the synergistic hydrolysis and therefore also increased contribution of the non-competitive component of inhibition compared with individual TrCel7A.
Our data suggest that the novel mechanism of synergy depicted in Fig. 7C is also operative in lignocellulose hydrolysis. Besides amorphous parts, lignocellulose also contains lignin and residual hemicellulose, which may serve as obstacles for processive TrCel7A (55). Removal of these apparently requires more accessory enzymes like hemicellulases and oxidative enzymes and explains the complex nature of the synergism in lignocellulose degradation.
Supplementary Material
Acknowledgments
We thank Jan Larsen (Inbicon, Skærbæk, Denmark) for lignocellulose and Dr. Silja Kuusk (University of Tartu) for critical reading.
This work was supported by the European Union Commission (FP7/2007–2013, Grant 213139) and Estonian Science Foundation (Grant 9227).

This article contains supplemental Tables S1–S6, Figs. S1–S3, and Equation S1.
- DP
- degree of polymerization
- AC
- amorphous cellulose
- BC
- bacterial cellulose
- CB
- cellobiose
- 14CB
- 14C-labeled cellobiose
- 14C-BC
- 14C-labeled bacterial cellulose
- CBH
- cellobiohydrolase
- CBM
- carbohydrate binding module
- TrCel7A
- CBH Cel7A from T. reesei
- TrCel5A
- EG Cel5A from T. reesei
- CDTrCel7A
- catalytic domain of TrCel7A
- DSE
- degree of synergistic effect
- EG
- endoglucanase
- MU
- 4-methylumbelliferone
- MUL
- 4-methylumbelliferyl-β-lactoside
- pNP
- para-nitrophenol
- pNPL
- para-nitrophenol-β-lactoside.
REFERENCES
- 1. Ragauskas A. J., Williams C. K., Davison B. H., Britovsek G., Cairney J., Eckert C. A., Frederick W. J., Jr., Hallett J. P., Leak D. J., Liotta C. L., Mielenz J. R., Murphy R., Templer R., Tschaplinski T. (2006) The path forward for biofuels and biomaterials. Science 311, 484–489 [DOI] [PubMed] [Google Scholar]
- 2. Himmel M. E., Ding S. Y., Johnson D. K., Adney W. S., Nimlos M. R., Brady J. W., Foust T. D. (2007) Biomass recalcitrance: engineering plants and enzymes for biofuels production. Science 315, 804–807 [DOI] [PubMed] [Google Scholar]
- 3. Chundawat S. P., Beckham G. T., Himmel M. E., Dale B. E. (2011) Deconstruction of lignocellulosic biomass to fuels and chemicals. Annu. Rev. Chem. Biomol. Eng. 2, 121–145 [DOI] [PubMed] [Google Scholar]
- 4. Lynd L. R., Weimer P. J., van Zyl W. H., Pretorius I. S. (2002) Microbial cellulose utilization. Fundamentals and biotechnology. Microbiol. Mol. Biol. Rev. 66, 506–577 [DOI] [PMC free article] [PubMed] [Google Scholar]
- 5. Bu L., Nimlos M. R., Shirts M. R., Ståhlberg J., Himmel M. E., Crowley M. F., Beckham G. T. (2012) Product binding varies dramatically between processive and nonprocessive cellulase enzymes. J. Biol. Chem. 287, 24807–24813 [DOI] [PMC free article] [PubMed] [Google Scholar]
- 6. Cantarel B. L., Coutinho P. M., Rancurel C., Bernard T., Lombard V., Henrissat B. (2009) The carbohydrate-active enzymes database (CAZy). An expert resource for glycogenomics. Nucleic Acids Res. 37, D233–D238 [DOI] [PMC free article] [PubMed] [Google Scholar]
- 7. Srisodsuk M., Reinikainen T., Penttilä M., Teeri T. T. (1993) Role of the interdomain linker peptide of Trichoderma reesei cellobiohydrolase I in its interaction with crystalline cellulose. J. Biol. Chem. 268, 20756–20761 [PubMed] [Google Scholar]
- 8. Boraston A. B., Bolam D. N., Gilbert H. J., Davies G. J. (2004) Carbohydrate-binding modules. Fine tuning polysaccharide recognition. Biochem. J. 382, 769–781 [DOI] [PMC free article] [PubMed] [Google Scholar]
- 9. Divne C., Ståhlberg J., Teeri T. T., Jones T. A. (1998) High resolution crystal structures reveal how a cellulose chain is bound in the 50-Å-long tunnel of cellobiohydrolase I from Trichoderma reesei. J. Mol. Biol. 275, 309–325 [DOI] [PubMed] [Google Scholar]
- 10. Tomme P., Van Tilbeurgh H., Pettersson G., Van Damme J., Vandekerckhove J., Knowles J., Teeri T., Claeyssens M. (1988) Studies of the cellulolytic system of Trichoderma reesei QM 9414. Analysis of domain function in two cellobiohydrolases by limited proteolysis. Eur. J. Biochem. 170, 575–581 [DOI] [PubMed] [Google Scholar]
- 11. Carrard G., Koivula A., Söderlund H., Béguin P. (2000) Cellulose-binding domains promote hydrolysis of different sites on crystalline cellulose. Proc. Natl. Acad. Sci. U.S.A. 97, 10342–10347 [DOI] [PMC free article] [PubMed] [Google Scholar]
- 12. McLean B. W., Boraston A. B., Brouwer D., Sanaie N., Fyfe C. A., Warren R. A., Kilburn D. G., Haynes C. A. (2002) Carbohydrate-binding modules recognize fine substructures of cellulose. J. Biol. Chem. 277, 50245–50254 [DOI] [PubMed] [Google Scholar]
- 13. Hervé C., Rogowski A., Blake A. W., Marcus S. E., Gilbert H. J., Knox J. P. (2010) Carbohydrate-binding modules promote the enzymatic deconstruction of intact plant cell walls by targeting and proximity effects. Proc. Natl. Acad. Sci. U.S.A. 107, 15293–15298 [DOI] [PMC free article] [PubMed] [Google Scholar]
- 14. Liu Y. S., Baker J. O., Zeng Y., Himmel M. E., Haas T., Ding S. Y. (2011) Cellobiohydrolase hydrolyzes crystalline cellulose on hydrophobic faces. J. Biol. Chem. 286, 11195–11201 [DOI] [PMC free article] [PubMed] [Google Scholar]
- 15. Mulakala C., Reilly P. J. (2005) Hypocrea jecorina (Trichoderma reesei) Cel7A as a molecular machine. A docking study. Proteins 60, 598–605 [DOI] [PubMed] [Google Scholar]
- 16. Beckham G. T., Matthews J. F., Bomble Y. J., Bu L., Adney W. S., Himmel M. E., Nimlos M. R., Crowley M. F. (2010) Identification of amino acids responsible for processivity in a family 1 carbohydrate-binding module from fungal cellulase. J. Phys. Chem. B 114, 1447–1453 [DOI] [PubMed] [Google Scholar]
- 17. Guillén D., Sánchez S., Rodrígues-Sanoja R. (2010) Carbohydrate-binding domains. Multiplicity of biological roles. Appl. Microbiol. Biotechnol. 85, 1241–1249 [DOI] [PubMed] [Google Scholar]
- 18. Woodward J. (1991) Synergism in cellulase systems. Bioresour. Technol. 36, 67–75 [Google Scholar]
- 19. Kostylev M., Wilson D. (2012) Synergistic interactions in cellulose hydrolysis. Biofuels 3, 61–70 [Google Scholar]
- 20. Reese E. T., Siu R. G., Levinson H. S. (1950) The biological degradation of soluble cellulose derivatives and its relationship to the mechanism of cellulose hydrolysis. J. Bacteriol. 59, 485–497 [DOI] [PMC free article] [PubMed] [Google Scholar]
- 21. Arantes V., Saddler J. N. (2010) Access to cellulose limits the efficiency of enzymatic hydrolysis. The role of amorphogenesis. Biotechnol. Biofuels 3, 4. [DOI] [PMC free article] [PubMed] [Google Scholar]
- 22. Storvick W. O., King K. W. (1960) The complexity and mode of action of the cellulase system of Cellvibrio gilvus. J. Biol. Chem. 235, 303–307 [PubMed] [Google Scholar]
- 23. Selby K., Maitland C. C. (1967) The cellulase of Trichoderma viride. Separation of the components involved in the solubilization of cotton. Biochem. J. 104, 716–724 [DOI] [PMC free article] [PubMed] [Google Scholar]
- 24. Wood T. M., McCrae S. I. (1972) The purification and properties of the C1 component of Trichoderma koningii cellulase. Biochem. J. 128, 1183–1192 [DOI] [PMC free article] [PubMed] [Google Scholar]
- 25. Väljamäe P., Sild V., Nutt A., Pettersson G., Johansson G. (1999) Acid hydrolysis of bacterial cellulose reveals different modes of synergistic action between cellobiohydrolase I and endoglucanase I. Eur. J. Biochem. 266, 327–334 [DOI] [PubMed] [Google Scholar]
- 26. Eriksson T., Karlsson J., Tjerneld F. (2002) A model explaining declining rate in hydrolysis of lignocellulose substrates with cellobiohydrolase I (Cel7A) and endoglucanase I (Cel7B) of Trichoderma reesei. Appl. Biochem. Biotechnol. 101, 41–60 [DOI] [PubMed] [Google Scholar]
- 27. Irwin D. C., Spezio M., Walker L. P., Wilson D. B. (1993) Activity studies of eight purified cellulases. Specificity, synergism, and binding domain effects. Biotechnol. Bioeng. 42, 1002–1013 [DOI] [PubMed] [Google Scholar]
- 28. Fägerstam L. G., Pettersson L. G. (1980) The 1,4-β-glucan cellobiohydrolases of Trichoderma reesei QM 9414. A new type of cellulolytic synergism. FEBS Lett. 119, 97–100 [Google Scholar]
- 29. Nidetzky B., Steiner W., Hayn M., Claeyssens M. (1994) Cellulose hydrolysis by the cellulases from Trichoderma reesei. A new model for synergistic interaction. Biochem. J. 298, 705–710 [DOI] [PMC free article] [PubMed] [Google Scholar]
- 30. Medve J., Ståhlberg J., Tjerneld F. (1994) Adsorption and synergism of cellobiohydrolase I and II of Trichoderma reesei during hydrolysis of microcrystalline cellulose. Biotechnol. Bioeng. 44, 1064–1073 [DOI] [PubMed] [Google Scholar]
- 31. Boisset C., Pétrequin C., Chanzy H., Henrissat B., Schülein M. (2001) Optimized mixtures of recombinant Humicola insolens cellulases for the biodegradation of crystalline cellulose. Biotechnol. Bioeng. 72, 339–345 [DOI] [PubMed] [Google Scholar]
- 32. Igarashi K., Uchihashi T., Koivula A., Wada M., Kimura S., Okamoto T., Penttilä M., Ando T., Samejima M. (2011) Traffic jams reduce hydrolytic efficiency of cellulase on cellulose surface. Science 333, 1279–1282 [DOI] [PubMed] [Google Scholar]
- 33. Vaaje-Kolstad G., Westereng B., Horn S. J., Liu Z., Zhai H., Sørlie M., Eijsink V. G. (2010) An oxidative enzyme boosting the enzymatic conversion of recalcitrant polysaccharides. Science 330, 219–222 [DOI] [PubMed] [Google Scholar]
- 34. Harris P. V., Welner D., McFarland K. C., Re E., Navarro Poulsen J. C., Brown K., Salbo R., Ding H., Vlasenko E., Merino S., Xu F., Cherry J., Larsen S., Lo Leggio L. (2010) Stimulation of lignocellulosic biomass hydrolysis by proteins of glycoside hydrolase family 61. Structure and function of a large, enigmatic family. Biochemistry 49, 3305–3316 [DOI] [PubMed] [Google Scholar]
- 35. Quinlan R. J., Sweeney M. D., Lo Leggio L., Otten H., Poulsen J. C., Johansen K. S., Krogh K. B., Jørgensen C. I., Tovborg M., Anthonsen A., Tryfona T., Walter C. P., Dupree P., Xu F., Davies G. J., Walton P. H. (2011) Insights into the oxidative degradation of cellulose by a copper metalloenzyme that exploits biomass components. Proc. Natl. Acad. Sci. U.S.A. 108, 15079–15084 [DOI] [PMC free article] [PubMed] [Google Scholar]
- 36. Phillips C. M., Beeson W. T., Cate J. H., Marletta M. A. (2011) Cellobiose dehydrogenase and copper-dependent polysaccharide monooxygenase potentiate cellulose degradation by Neurospora crassa. ACS Chem. Biol. 6, 1399–1406 [DOI] [PubMed] [Google Scholar]
- 37. Westereng B., Ishida T., Vaaje-Kolstad G., Wu M., Eijsink V. G., Igarashi K., Samejima M., Ståhlberg J., Horn S. J., Sandgren M. (2011) The putative endoglucanase PcGH61D from Phanerochaete chrysosporium is a metal-dependent oxidative enzyme that cleaves cellulose. PloS One 6, e27807. [DOI] [PMC free article] [PubMed] [Google Scholar]
- 38. Wilson D. B. (2012) Processive and nonprocessive cellulases for biofuel production. Lessons from bacterial genomes and structural analysis. Appl. Microbiol. Biotechnol. 93, 497–502 [DOI] [PubMed] [Google Scholar]
- 39. Gao L., Gao F., Wang L., Geng C., Chi L., Zhao J., Qu Y. (2012) N-Glycoform diversity of cellobiohydrolase I from Penicillium decumbens and the synergism of a nonhydrolytic glycoform in cellulose degradation. J. Biol. Chem. 287, 15906–15915 [DOI] [PMC free article] [PubMed] [Google Scholar]
- 40. Henrissat B., Driguez H., Viet C., Schülein M. (1985) Synergism of cellulases from Trichoderma reesei in the degradation of cellulose. Nat. Biotechnol. 3, 722–726 [Google Scholar]
- 41. Woodward J., Hayes M. K., Lee N. E. (1988) Hydrolysis of cellulose by saturating and non-saturating concentrations of cellulase. Implications for synergism. Nat. Biotechnol. 6, 301–304 [Google Scholar]
- 42. Väljamäe P., Pettersson G., Johansson G. (2001) Mechanism of substrate inhibition in cellulose synergistic degradation. Eur. J. Biochem. 268, 4520–4526 [DOI] [PubMed] [Google Scholar]
- 43. Zhang Y. H., Lynd L. R. (2004) Toward an aggregated understanding of enzymatic hydrolysis of cellulose. Noncomplexed cellulase systems. Biotechnol. Bioeng. 88, 797–824 [DOI] [PubMed] [Google Scholar]
- 44. Hoshino E., Shiroishi M., Amano Y., Nomura M., Kanda T. (1997) Synergistic actions of exo-type cellulases in the hydrolysis of cellulose with different crystallinities. J. Ferment. Bioeng. 84, 300–306 [Google Scholar]
- 45. Chundawat S. P., Bellesia G., Uppugundla N., da Costa Sousa L., Gao D., Cheh A. M., Agarwal U. P., Bianchetti C. M., Phillips G. N., Jr., Langan P., Balan V., Gnanakaran S., Dale B. E. (2011) Restructuring the crystalline cellulose hydrogen bond network enhances its depolymerization rate. J. Am. Chem. Soc. 133, 11163–11174 [DOI] [PubMed] [Google Scholar]
- 46. Medve J., Karlsson J., Lee D., Tjerneld F. (1998) Hydrolysis of microcrystalline cellulose by cellobiohydrolase I and endoglucanase II from Trichoderma reesei. Adsorption, sugar production pattern, and synergism of enzymes. Biotechnol. Bioeng. 59, 621–634 [PubMed] [Google Scholar]
- 47. Fenske J. J., Penner M. H., Bolte J. P. (1999) A simple individual-based model of insoluble polysaccharide hydrolysis. The potential for autosynergism with dual-activity glycosidases. J. Theor. Biol. 199, 113–118 [DOI] [PubMed] [Google Scholar]
- 48. Riedel K., Bronnenmeier K. (1998) Intramolecular synergism in an engineered exo-endo-1,4-β-glucanase fusion protein. Mol. Microbiol. 28, 767–775 [DOI] [PubMed] [Google Scholar]
- 49. Samejima M., Sugiyama J., Igarashi K., Eriksson K-E. L. (1998) Enzymatic hydrolysis of bacterial cellulose. Carbohydr. Res. 305, 281–288 [Google Scholar]
- 50. Bhikhabhai R., Johansson G., Pettersson G. (1984) Isolation of cellulolytic enzymes from Trichoderma reesei QM 9414. J. Appl. Biochem. 6, 336–345 [PubMed] [Google Scholar]
- 51. Saloheimo M., Lehtovaara P., Penttilä M., Teeri T. T., Ståhlberg J., Johansson G., Pettersson G., Claeyssens M., Tomme P., Knowles J. K. (1988) EG III, a new endoglucanase from Trichoderma reesei. The characterization of both gene and enzyme. Gene 63, 11–22 [DOI] [PubMed] [Google Scholar]
- 52. Sipos B., Benko Z., Dienes D., Réczey K., Viikari L., Siika-aho M. (2010) Characterization of specific activities and hydrolytic properties of cell wall-degrading enzymes produced by Trichoderma reesei Rut C30 on different carbon sources. Appl. Biochem. Biotechnol. 161, 347–364 [DOI] [PubMed] [Google Scholar]
- 53. Velleste R., Teugjas H., Väljamäe P. (2010) Reducing end-specific fluorescence labeled celluloses for cellulase mode of action. Cellulose 17, 125–138 [Google Scholar]
- 54. Thomsen M. H., Thygesen A., Jørgensen H., Larsen J., Christensen B. H., Thomsen A. B. (2006) Preliminary results on optimizing of pilot scale pretreatment of wheat straw used in coproduction of bioethanol and electricity. Appl. Biochem. Biotechnol. 129, 448–460 [DOI] [PubMed] [Google Scholar]
- 55. Jalak J., Väljamäe P. (2010) Mechanism of initial rapid rate retardation in cellobiohydrolase catalyzed cellulose hydrolysis. Biotechnol. Bioeng. 106, 871–883 [DOI] [PubMed] [Google Scholar]
- 56. Horn S. J., Sørlie M., Vårum K. M., Väljamäe P., Eijsink V. G. (2012) Measuring processivity. Methods Enzymol. 510, 69–95 [DOI] [PubMed] [Google Scholar]
- 57. Kurasin M., Väljamäe P. (2011) Processivity of cellobiohydrolases is limited by the substrate. J. Biol. Chem. 286, 169–177 [DOI] [PMC free article] [PubMed] [Google Scholar]
- 58. Gruno M., Väljamäe P., Pettersson G., Johansson G. (2004) Inhibition of the Trichoderma reesei cellulases by cellobiose is strongly dependent on the nature of the substrate. Biotechnol. Bioeng. 86, 503–511 [DOI] [PubMed] [Google Scholar]
- 59. Praestgaard E., Elmerdahl J., Murphy L., Nymand S., McFarland K. C., Borch K., Westh P. (2011) A kinetic model for the burst phase of processive cellulases. FEBS J. 278, 1547–1560 [DOI] [PubMed] [Google Scholar]
- 60. Cruys-Bagger N., Elmerdahl J., Praestgaard E., Tatsumi H., Spodsberg N., Borch K., Westh P. (2012) Pre-steady state kinetics for the hydrolysis of insoluble cellulose by cellobiohydrolase Cel7A. J. Biol. Chem. 287, 18451–18458 [DOI] [PMC free article] [PubMed] [Google Scholar]
- 61. Igarashi K., Koivula A., Wada M., Kimura S., Penttilä M., Samejima M. (2009) High speed atomic force microscopy visualizes processive movement of Trichoderma reesei cellobiohydrolase I on crystalline cellulose. J. Biol. Chem. 284, 36186–36190 [DOI] [PMC free article] [PubMed] [Google Scholar]
- 62. Fox J. M., Levine S. E., Clark D. S., Blanch H. W. (2012) Initial- and processive-cut products reveal cellobiohydrolase rate limitations and the role of companion enzymes. Biochemistry 51, 442–452 [DOI] [PubMed] [Google Scholar]
- 63. Kipper K., Väljamäe P., Johansson G. (2005) Processive action of cellobiohydrolase Cel7A from Trichoderma reesei is revealed as “burst” kinetics on fuorescent polymeric model substrates. Biochem. J. 385, 527–535 [DOI] [PMC free article] [PubMed] [Google Scholar]
- 64. Murphy L., Cruys-Bagger N., Damgaard H. D., Baumann M. J., Olsen S. N., Borch K., Lassen S. F., Sweeney M., Tatsumi H., Westh P. (2012) Origin of initial burst in activity for Trichoderma reesei endo-glucanases hydrolyzing insoluble cellulose. J. Biol. Chem. 287, 1252–1260 [DOI] [PMC free article] [PubMed] [Google Scholar]
- 65. Beckham G. T., Bomble Y. J., Bayer E. A., Himmel M. E., Crowley M. F. (2011) Applications of computational science for understanding enzymatic deconstruction of cellulose. Curr. Opin. Biotechnol. 22, 231–238 [DOI] [PubMed] [Google Scholar]
- 66. Nishiyama Y., Kim U. J., Kim D. Y., Katsumata K. S., May R. P., Langan P. (2003) Periodic disorder along ramie cellulose microfibrils. Biomacromolecules 4, 1013–1017 [DOI] [PubMed] [Google Scholar]
- 67. Chanzy H. (2011) The continuing debate over the structure of cellulose. Historical perspective and outlook. Cellulose 18, 853–856 [Google Scholar]
- 68. von Ossowski I., Ståhlberg J., Koivula A., Piens K., Becker D., Boer H., Harle R., Harris M., Divne C., Mahdi S., Zhao Y., Driguez H., Claeyssens M., Sinnott M. L., Teeri T. T. (2003) Engineering the exo-loop of Trichoderma reesei cellobiohydrolase, Cel7A. A comparison with Phanerochaete chrysosporium Cel7D. J. Mol. Biol. 333, 817–829 [DOI] [PubMed] [Google Scholar]
- 69. Ubhayasekera W., Muñoz I. G., Vasella A., Ståhlberg J., Mowbray S. L. (2005) Structures of Phanerochaete chrysosporium Cel7D in complex with product and inhibitors. FEBS J. 272, 1952–1964 [DOI] [PubMed] [Google Scholar]
Associated Data
This section collects any data citations, data availability statements, or supplementary materials included in this article.