

Abstract
Motivation: The size and complex nature of mass spectrometry-based proteomics datasets motivate development of specialized software for statistical data analysis and exploration. We present DanteR, a graphical R package that features extensive statistical and diagnostic functions for quantitative proteomics data analysis, including normalization, imputation, hypothesis testing, interactive visualization and peptide-to-protein rollup. More importantly, users can easily extend the existing functionality by including their own algorithms under the Add-On tab.
Availability: DanteR and its associated user guide are available for download free of charge at http://omics.pnl.gov/software/. We have an updated binary source for the DanteR package up on our website together with a vignettes document. For Windows, a single click automatically installs DanteR along with the R programming environment. For Linux and Mac OS X, users must install R and then follow instructions on the DanteR website for package installation.
Contact: rds@pnnl.gov
1 INTRODUCTION
Analysis of proteomics data, such as based on liquid chromatography-mass spectrometry, presents special challenges due to a number of factors, including sample variation and missing peptide abundances, as well as the need to perform protein-level significance analysis on peptide-level data (Karpievitch et al., 2009a; Nesvizhskii, 2010). Existing non-commercial software for proteomics analysis, such as GProX (Rigbolt, 2011, http://bit.ly/PkBSWj) and DanTE (Polpitiya et al., 2008), uses multiple programming languages (e.g. R and C#) that make additional development and maintenance difficult. Moreover, these tools lack the flexibility and extensibility needed to allow end users to add new functionality.
DanteR is a graphical R package for quantitative bottom–up proteomics data analysis designed to overcome these limitations; implementation entirely in R makes for an independent and readily extensible data analysis platform. Although the software can be installed and used as a stand-alone program, user-defined algorithms can be easily integrated to extend data analysis and visualization.
2 DESCRIPTION
DanteR incorporates algorithms for preprocessing and normalizing peptide abundances, statistical analysis, multi-dimensional visualization and for creating publication analysis summaries. These features build on earlier DAnTE software (Polpitiya et al., 2008), but with additional functionalities such as EigenMS normalization (i.e. normalization using singular value decomposition), model-based filtering of low-quality peptides, likelihood model-based imputation of missing values and improved significance analysis at peptide and protein levels.
2.1 Data format and metadata
DanteR tracks contextual information (metadata) about rows and columns of data tables. Input data can be any data table (crosstab) containing rows and columns of peptide abundances; supported file formats include tab-delimited text files, SQLite and Excel. Rows correspond to distinct peptides and columns correspond to peptide abundances in different experimental samples. Additional columns may contain information on peptide and protein identities, pathway information, etc. Metadata, also called factors in statistics, can be loaded from a file, either manually specified within DanteR or automatically generated from input experiment names. For example, one might use metadata to track the experimental treatment conditions for various samples. As data are transformed and analyzed, DanteR keeps track of data-to-metadata while filtering to remove low-quality peptides, normalizing abundances or ‘rolling up’ peptide abundance information to the protein level.
2.2 Exploratory and statistical features
DanteR provides multiple investigative and diagnostic plots that include consistent factor coloring, dynamic zoom and column rearrangement (Fig. 1A). For unsupervised data exploration, DanteR can perform principal component analysis (with associated score and loading plots) as a method for finding major sources of variation in the data along with hierarchical and K-means clustering methods. All principal component analysis components can be displayed as interactive 3D plots, optionally with confidence ellipsoids around each point. Another new feature is interactive display of cross-tabulated data that can be accomplished using the Dynamic Row Plot function, which allows for fast and deep exploration (e.g. plotting all peptide abundances within given sets of proteins as heatmaps or line plots). Proteins can be sorted and plotted by P-value from hypothesis testing, K-means clustering group, etc. Finally, results of statistical tests can be explored using an interactive volcano plot function (Fig. 1B). All of the plots can be saved in a variety of high-resolution graphic file formats.
Fig. 1.
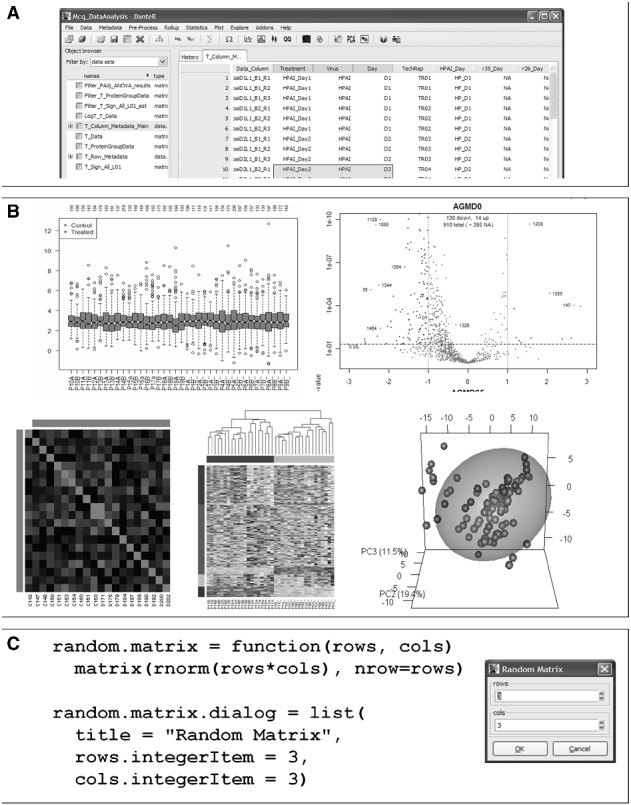
Representative screen shots from DanteR. (A) Program front-end and navigation panel. (B) Representative data screenshots of box plots (top right), volcano plot (top left), correlation plot (bottom left), hierarchical clustering (bottom center) and three-dimensional PCA plot (bottom right). (C) Example code and displayed dialog for a DanteR add-on to create a random matrix using the RGtk2Extras markup language. The dialog is initialized and shown when the function run.dialog is called, or when ‘OK’ is clicked, the function is run with user-specified arguments
DanteR also incorporates several robust normalization methods. Among these are the new EigenMS normalization method based on singular value decomposition (Karpievitch et al., 2009b), as well as existing methods that have been streamlined and simplified, e.g. robust linear, LOESS, quantile and median absolute deviation regression (Callister et al., 2006). For missing value imputation, DanteR offers simple and advanced algorithms, including K-nearest neighbor imputation, KNNimpute (Troyanskaya et al., 2001) and likelihood model-based imputation for randomly missing/censored abundance values (Karpievitch et al., 2009a).
Parametric (ANOVA) and non-parametric (Fisher's exact) statistical tests afford significance analysis capability. For ANOVA analysis, users can specify a linear model, a robust linear model for noisy data or a Poisson model for count data. Protein-level inference can be performed utilizing all of the available peptide abundances and a likelihood ratio test to compute P-values (Karpievitch et al., 2009a). Fisher's exact test can be used for significance analysis of peptide count data. Significant up or down protein expression changes can be summarized by using the tabulation function.
The ‘Add-On’ menu allows users to append new functions to DanteR by creating R scripts that contain the algorithm and a dialog specification with a simple markup scheme (see the RGtk2Extras R package, http://bit.ly/MM6dee). In this way, anyone with R knowledge can extend DanteR without knowing user interface programming. Figure 1C shows a user-created function ‘random.matrix’ that produces a matrix of size given by the parameters passed through a dialogue window. When this script is placed into the dedicated add-on directory, an additional menu itemfor the dialog is automatically created. Function output is automatically saved as a new data table in the user workspace.
3 SUMMARY
DanteR is entirely R-based software that incorporates many algorithms for proteomics data analysis. Moreover, its capabilities are readily extendible by end users and developers without any knowledge of user interface programming. While designed specifically for analyzing proteomics data, DanteR can also be applied to analyze microarray and other -omics data from multiple sources.
ACKNOWLEDGEMENTS
We thank Ken Auberry, Gordon Slysz, Shelley Herbrich, John Verzani and Michael Lawrence for their contributions.
Funding: Portions of this research were supported by the National Institute of General Medical Sciences (Large Scale Collaborative Research Grant U54 GM-62119-02), the NIH National Center for Research Resources (5P41RR018522-10) and the National Institute of General Medical Sciences (8 P41 GM103493-10) from the National Institutes of Health, Laboratory Directed Research and Development program at Pacific Northwest National Laboratory and the National Institute of Allergy and Infectious Diseases (NIH/DHHS through interagency agreement Y1-AI-4894-01). Work was performed in the Environmental Molecular Sciences Laboratory, a US Department of Energy/BER national scientific user facility at Pacific Northwest National Laboratory.
Conflict of Interest: none declared.
REFERENCES
- Callister SJ, et al. Normalization approaches for removing systematic biases associated with mass spectrometry and label-free proteomics. J. Proteome Res. 2006;5:277–286. doi: 10.1021/pr050300l. [DOI] [PMC free article] [PubMed] [Google Scholar]
- Karpievitch YV, et al. A statistical framework for protein quantitation in bottom-up MS-based proteomics. Bioinformatics. 2009a;25:2028–2034. doi: 10.1093/bioinformatics/btp362. [DOI] [PMC free article] [PubMed] [Google Scholar]
- Karpievitch YV, et al. Normalization of peak intensities in bottom-up MS-based proteomics using singular value decomposition. Bioinformatics. 2009b;25:2573–2580. doi: 10.1093/bioinformatics/btp426. [DOI] [PMC free article] [PubMed] [Google Scholar]
- Nesvizhskii AI. A survey of computational methods and error rate estimation procedures for peptide and protein identification in shotgun proteomics. J. Proteomics. 2010;73:2092–2123. doi: 10.1016/j.jprot.2010.08.009. [DOI] [PMC free article] [PubMed] [Google Scholar]
- Polpitiya AD, et al. DAnTE: a statistical tool for quantitative analysis of -omics data. Bioinformatics. 2008;24:1556–1558. doi: 10.1093/bioinformatics/btn217. [DOI] [PMC free article] [PubMed] [Google Scholar]
- Rigbolt KT, et al. 2011 Mol Cell Proteomics 10(8) [Google Scholar]
- Troyanskaya O, et al. Missing value estimation methods for DNA microarrays. Bioinformatics. 2001;17:520–525. doi: 10.1093/bioinformatics/17.6.520. [DOI] [PubMed] [Google Scholar]