Abstract
The goal of the current study was to evaluate whether CYP2E1 plays a role in binge-ethanol induced steatosis and if autophagy impacts CYP2E1-mediated hepatotoxicity, oxidative stress and fatty liver formation produced by ethanol. Wild type (WT), CYP2E1 knockin (KI) and CYP2E1 knockout (KO) mice were gavaged with 3g/kg body wt ethanol twice a day for four days. This treatment caused fatty liver, elevation of CYP2E1 and oxidative stress in WT and KI mice but not KO mice. Autophagy was impaired in ethanol-treated KI mice compared to KO mice as reflected by a decline in the LC3-II/LC3-I ratio and lower total LC-3 and Beclin-1 levels coupled to increases in P62, pAKT/AKT and mTOR. Inhibition of macroautophagy by administration of 3-methyladenine enhanced the binge ethanol hepatotoxicity, steatosis and oxidant stress in CYP2E1 KI, but not CYP2E1 KO mice. Stimulation of autophagy by rapamycin blunted the elevated steatosis produced by binge ethanol. Treatment of HepG2 E47 cells which express CYP2E1 with 100 mM ethanol for 8 days increased fat accumulation and oxidant stress but decreased autophagy. Ethanol had no effect on these reactions in HepG2 C34 cells which do not express CYP2E1. Inhibition of autophagy elevated ethanol toxicity, lipid accumulation and oxidant stress in the E47, but not C34 cells. The antioxidant N-acetylcysteine, and CYP2E1 inhibitor chlormethiazole blunted these effects of ethanol. These results indicate that CYP2E1 plays an important role in binge ethanol-induced fatty liver. We propose that CYP2E1-derived reactive oxygen species inhibit autophagy, which subsequently causes accumulation of lipid droplets. Inhibition of autophagy promotes binge ethanol induced hepatotoxicity, steatosis and oxidant stress via CYP2E1.
Keywords: Binge ethanol, Autophagy, Steatosis, hepatotoxicity, CYP2E1, Oxidative Stress
Introduction
Alcohol induced steatosis and liver injury involves several mechanisms [1–4], including lipid peroxidation and oxidative stress in alcohol toxicity [5–7]. One central pathway in the ability of ethanol to induce a state of oxidative stress is the induction of cytochrome P4502E1 by ethanol. CYP2E1 metabolizes and activates ethanol to more reactive, toxic products such as acetaldehyde and the 1-hydroxyethyl radical and is also an effective generator of reactive oxygen species [8, 9]. We previously reported that CYP2E1 plays a role in fatty liver and injury in a chronic ethanol oral–feeding model as fatty liver and ROS production developed in wild type (WT) but not CYP2E1 KO mice [10]. Fatty liver, ROS production and liver injury were restored in humanized CYP2E1 knock-in mice. Chlormethiazole, an inhibitor of CYP2E1, reduced the ethanol-induced fatty liver and ROS generation in WT mice [10]. These results suggest that CYP2E1 plays a central role in chronic alcohol induced liver steatosis. One goal of the current study was to expend the chronic ethanol model to a binge ethanol model and evaluate whether CYP2E1 contributes to binge ethanol-induced fatty liver and oxidant stress.
Autophagy is a degradative pathway involving delivery of cytoplasmic components such as proteins, organelles and invading microbes, to the lysosome for degradation. Autophagy was found to promote lipid droplet degradation in liver hepatocytes (lipophagy) [11]. The regulation and function of autophagy and lipid metabolism were reported to be reciprocally related to each other e.g. inhibition of autophagy caused lipid accumulation and lipid accumulation inhibited autophagy [11, 12]. A recent investigation reported that autophagy is involved in the regulation of alcoholic liver injury [13, 14]. Acute ethanol consumption elevated autophagy, perhaps as a protective mechanism against ethanol toxicity; inhibition of autophagy increased ethanol toxicity and steatosis [14]. We recently evaluated the ability of CYP2E1 to modulate the effects of ethanol on lipid accumulation and autophagy in vitro. HepG2 E47 cells which express CYP2E1 and C34 control cells which do not express CYP2E1 were treated with ethanol. Ethanol induced lipid accumulation and increased triglycerides (TG) in E47 cells to a greater extent than in C34 cells [15]. In contrast, autophagy was elevated by ethanol in C34 cells to a greater extent than in E47 cells, suggesting that expression of CYP2E1 may impair autophagy and this may contribute to the lipid accumulation produced by ethanol. The current study was designed to evaluate the role of autophagy in the modulation of CYP2E1-mediated alcohol-induced liver steatosis and injury. Humanized CYP2E1 knockin mice, CYP2E1 knockout and wild type SV129 mice were treated (binged) acutely with ethanol in the absence or presence of the autophagy modulators 3-MA or rapamycin. As an in-vitro model, E47 cells and C34 cells were treated with ethanol in the absence or presence of 3-MA or rapamycin. The inhibition of autophagy induced liver steatosis and lipid accumulation in the binge ethanol CYP2E1 KI mice but not in the CYP2E1 KO mice. Similarly, the inhibition of autophagy promoted ethanol toxicity, lipid accumulation and oxidant stress in E47 cells but not C34 cells. Treatment with ethanol impaired autophagy in CYP2E1 KI mice and E47 cells but not in the KO mice or C34 cells. This CYP2E1/ethanol impairment of autophagy may contribute to binge ethanol-induced liver steatosis and injury.
Materials and Methods
In vivo animal model
Male SV129 humanized CYP2E1 Knockin (KI) or CYP2E1 knockout (KO) mice, 20–25g (gifts from Dr. F. Gonzales, NCI, NIH), were bred and maintained in the Center for Laboratory Animal Sciences, Mount Sinai School of Medicine [16]. Male wild type SV129 mice were purchased from Charles River Laboratory. Mice were gavaged with 30% ethanol at the dose of 3g/kg body weight, twice a day for four days. Controls were gavaged with saline. Some mice were administrated (IP) 3-methyladenine (3-MA), an autophagy inhibitor or rapamycin, an autophagy inducer at a dose of 100mg/kg or 5mg/kg body weight once a day for four days, respectively. At the end of treatment the mice serum and liver were isolated for further analysis.
In vitro cell culture model
HepG2 E47 cells which express CYP2E1 and HepG2 C34 cells which do not express CYP2E1 [17]. were treated with 100 mM ethanol for 8 days. Some cells were also treated with 3-MA (2.5mM) or rapamycin (100nM) or CMZ, a CYP2E1 inhibitor (100µM) or NAC, a ROS scavenger (5mM).
Liver injury and lipid accumulation
Serum alanine aminotransferase (ALT) or aspartate aminotransferase (AST) and liver H&E staining were assayed as described previously [10, 16]. E47 and C34 cell viability were determined by the MTT cell proliferation assay and morphological observation as described previously [17]. Steatosis was determined by H&E Staining, Oil Red O Staining and TG content in either serum or liver tissue or cell cultures was assayed using a kit from Pointe Scientific, INC.
Biochemical assays
SDS-PAGE was carried out to determine levels of LC3 I, II, Beclin-1, Bip, p62, pAkt/Akt, mTOR and CYP2E1. The results were analyzed with an Odyssey fluorescence scanning system and the blots were quantified with ImageJ software from NIH. After the blots were quantified, the arbitrary units from saline mice or control groups and their related loading control (β-actin) or non phosphorylated protein (AKT) or LC3-I were set as 100 units and the other groups were compared with this respectively. The ratios of individual experimental groups and their β-actin related loading control or the phospharylated AKT/non-phospharylated protein AKT or the LC3-II/LC3-I ratios were calculated. Statistical significance (P<0.05) was analyzed with SPSS software by comparing the mean ratios from each group.
Parameters of oxidative stress such as levels of GSH or TBARS or ROS fluorescence staining were carried out as previously described [10,16,17]. CYP2E1 activity was measured by the rate of oxidation of p-nitrophenol to p-nitrocatechol. CYP2E1 protein content was determined by immunoblot analysis.
Statistical analysis
Statistical analysis was performed using one-way analysis of variance with subsequent post hoc comparisons by Scheffe. Values reflect means±standard error. The number of experiments is indicated in the figure legends.
Results
CYP2E1 potentiates binge ethanol-induced liver steatosis and oxidative stress
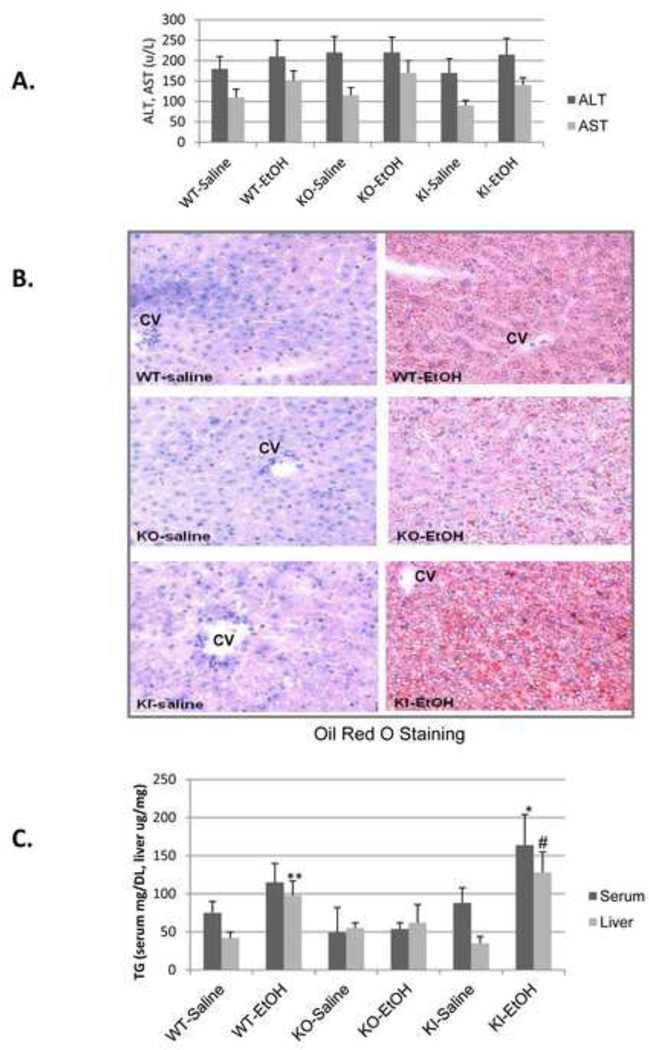
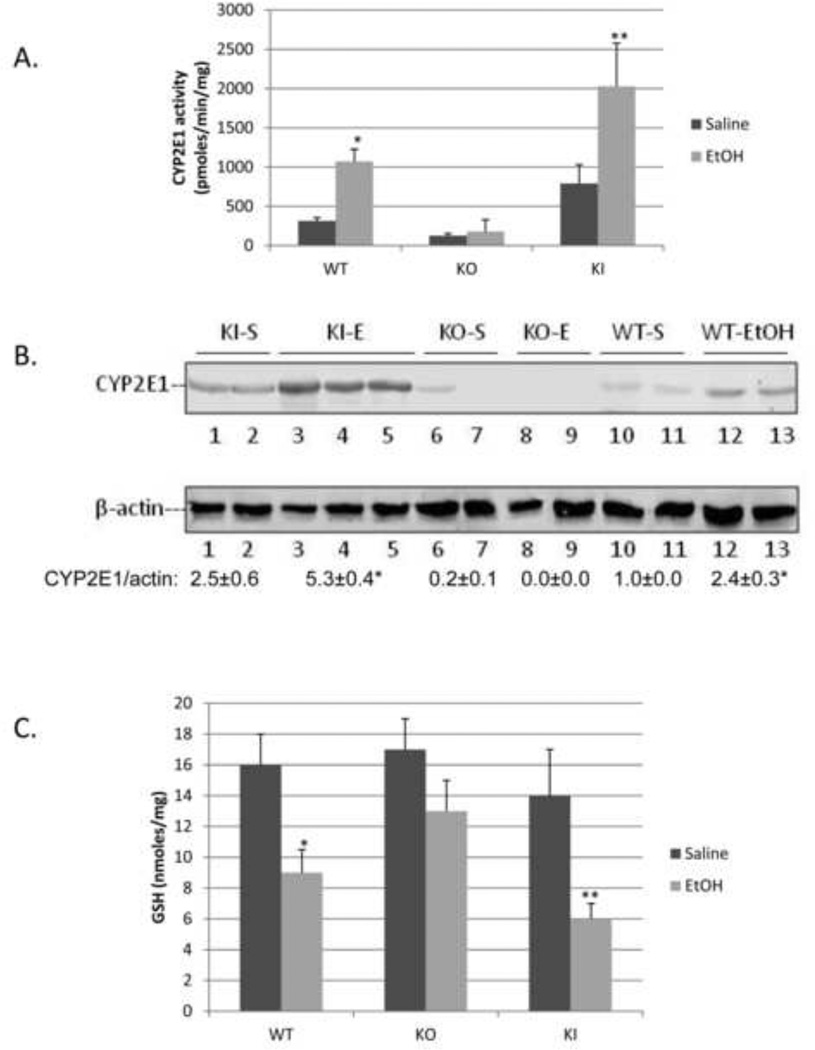
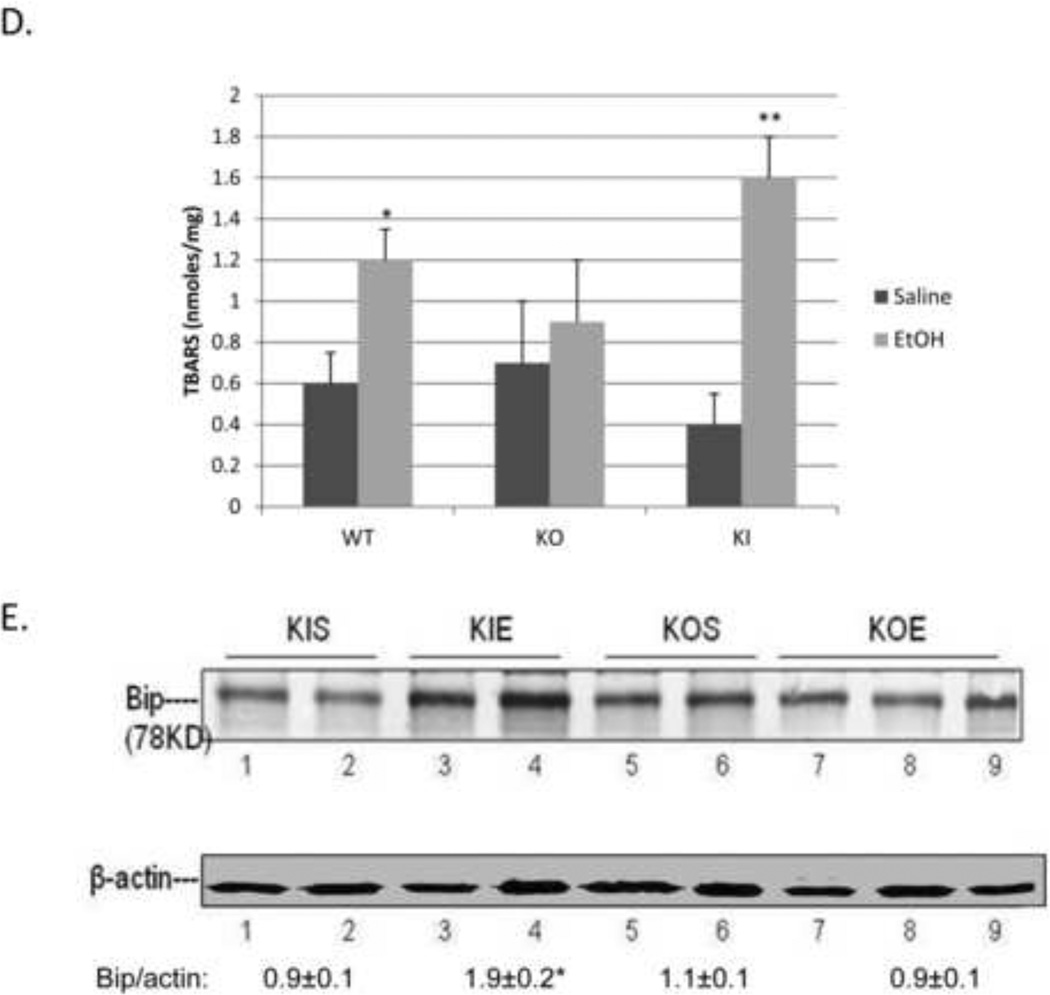
SV129 WT, CYP2E1 KO and CYP2E1 KI mice were gavaged with ethanol, 3g/kg body Wt, twice a day for 4 days. Under these conditions, mice did not significantly lose body weight and food intake was about the same between saline and ethanol gavaged mice. ALT or AST levels were not significantly elevated by the binge ethanol treatment in any of the mice (Fig. 1A). Ethanol induced steatosis in WT mice as reflected by increased Oil Red O Staining (Fig. 1B) and elevated serum and liver triglyceride levels (Fig. 1B, 1C). The binge ethanol-induced Oil Red O Staining was lower in the CYP2E1 KO mice, and serum and liver triglycerides were not elevated in these mice (Fig. 1B, 1C). However, binge ethanol-induced steatosis was restored in the CYP2E1 KI mice (Fig. 1B, 1C). The binge ethanol treatment elevated CYP2E1 catalytic activity and protein about two-to-three fold in the WT and KI mice. CYP2E1 activity and content were higher in the KI mice than the WT mice after either saline or ethanol treatment (Fig. 2A, 2B). Levels of CYP2E1 activity and protein content were undetectable or very low in the CYP2E1 KO mice, with or without binge ethanol treatment (Fig. 2A, 2B). Hepatic GSH levels were significantly lowered by the binge ethanol treatment in the WT and the KI mice but not in the KO mice (Fig. 2C) and hepatic TBARS increased in the WT and KI mice but not in the KO mice (Fig.2D). These results suggest that the binge ethanol elevation of CYP2E1 is associated with an increase in oxidative stress. Levels of BIP, an ER stress marker, were increased by binge ethanol in the CYP2E1 KI mice but not the CYP2E1 KO mice (Fig. 2E). However, levels of CHOP, another ER stress marker, were not increased by the binge ethanol in any mice (data not shown).
Fig. 1. Binge ethanol treatment induces liver steatosis in CYP2E1 knockin and wild type mice but not in CYP2E1 knockout mice.
SV129 wild type (WT), CYP2E1 knockout (KO) and humanized CYP2E1 knockin mice were gavaged with ethanol at a dose of 3g/kg twice a day or with saline for 4 days. ALT and AST levels in the serum (A), liver tissue Oil Red O Staining, 100× magnification (B), and TG levels in the serum (mg/DL) and liver homogenate (µg/mg) were determined (C). *, **, #, P<0.05 compared with saline treated WT or KI mice. N=4.
Fig. 2. Binge ethanol treatment induces CYP2E1 and oxidative stress.
WT, CYP2E1 KO and KI mice were treated as described in the legend to Fig. 1. CYP2E1 activity (A), *, **, P<0.05 compared with their saline control, n=4. CYP2E1 protein (B), GSH (C), TBARS (D) and BIP levels (E). *, **, P<0.05 compared with appropriate saline controls. N=4.
Effect of binge ethanol on macroautophagy
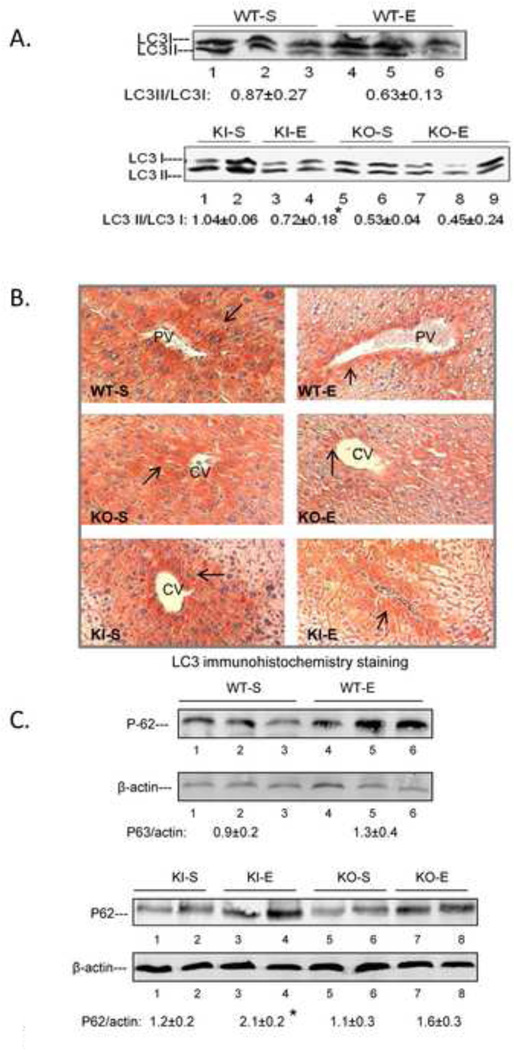
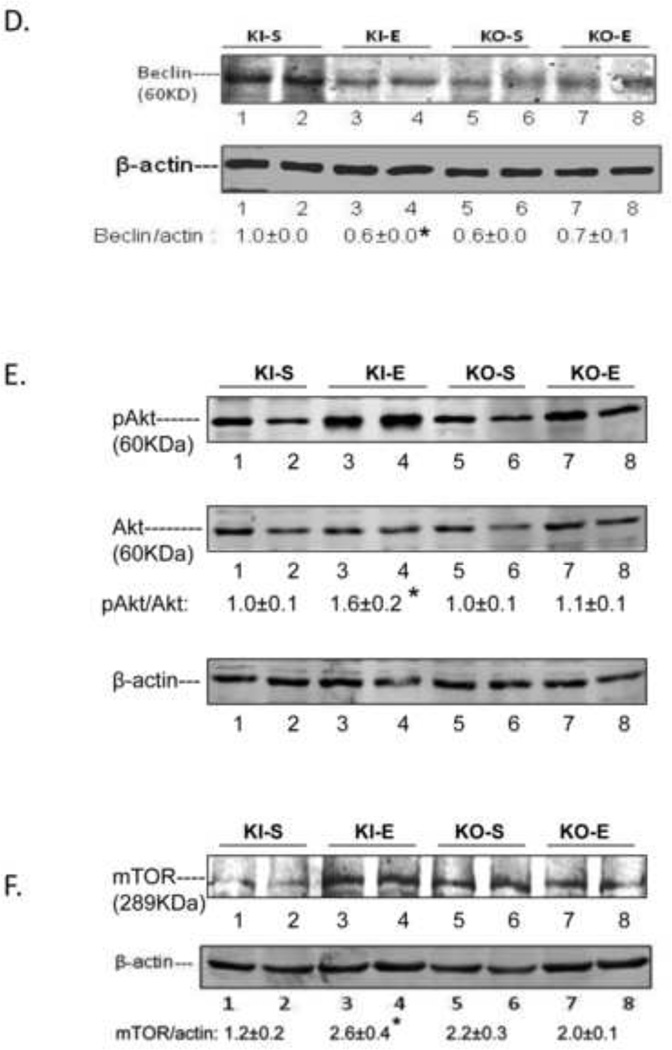
The binge ethanol treatment of CYP2E1 KI mice impaired macroautophagy in the liver as reflected by a decrease in the LC3 II/LC3 I ratio in conjunction with an increase in the P62/β-actin ratio (Fig. 3A, 3C). Immunohistochemical detection of total LC3 levels also showed a decrease by the binge ethanol treatment (Fig. 3B). There was a tendency for binge ethanol to lower the LC3 II/LC3 I ratio, and total LC3 levels and elevate the P62/β-actin ratio in WT mice but these changes did not reach or were borderline significant (Fig. 3A, 3B, 3C). Binge ethanol had no significant effect on macroautophagy in the KO mice (Fig. 3A, 3C) although total levels of LC3 slightly decreased (Fig, 3B). Pro-autophagic Beclin-1 levels were lowered by ethanol in the KI mice but no changes were observed in the KO mice (Fig. 3D). The ratio of pAKT/AKT (Fig. 3E) and levels of mTOR were increased by ethanol in the KI mice with no increase observed in the KO mice (Fig.3F). These results suggest that CYP2E1 plays a role in the binge ethanol decrease in macroautophagy.
Fig. 3. Binge ethanol treatment impairs autophagy.
Immunoblot for LC3I and LC3II (A); immunohistochemistry staining for total LC3, 200× magnification (B); Immunoblot for P62 (C); Beclin-1 (D); Akt (E); and mTOR (F). *, **, P<0.05 compared with the appropriate saline control. N=3.
Macroautophagy protects against binge ethanol hepatotoxicity and oxidant stress
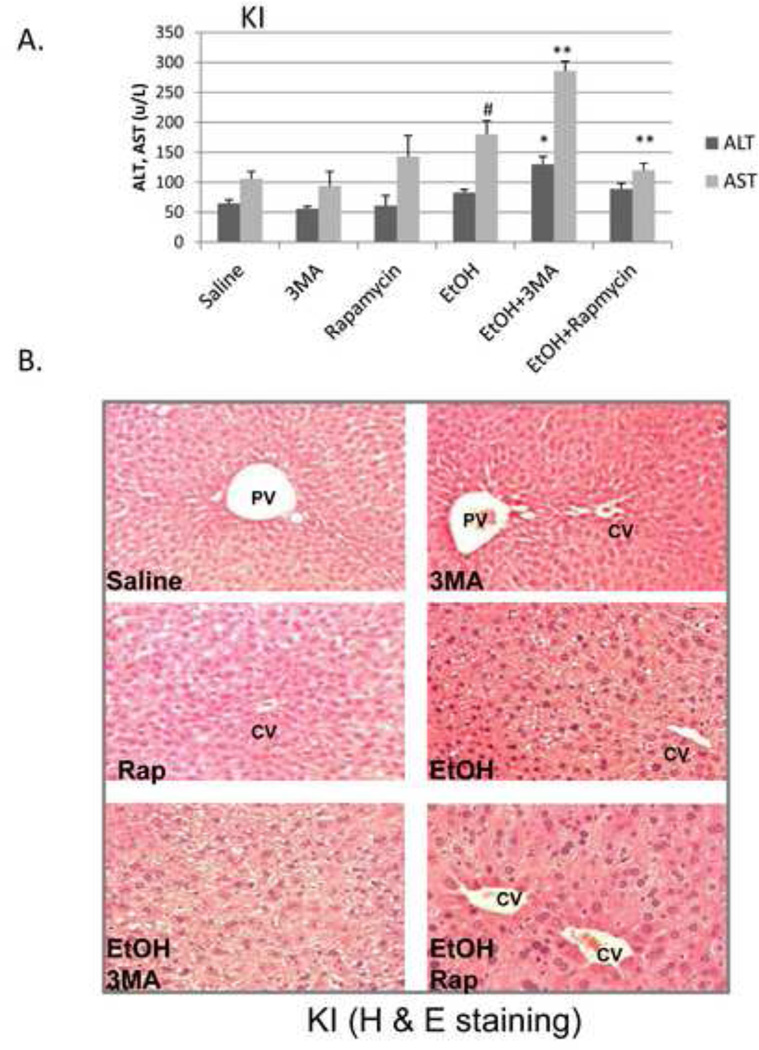
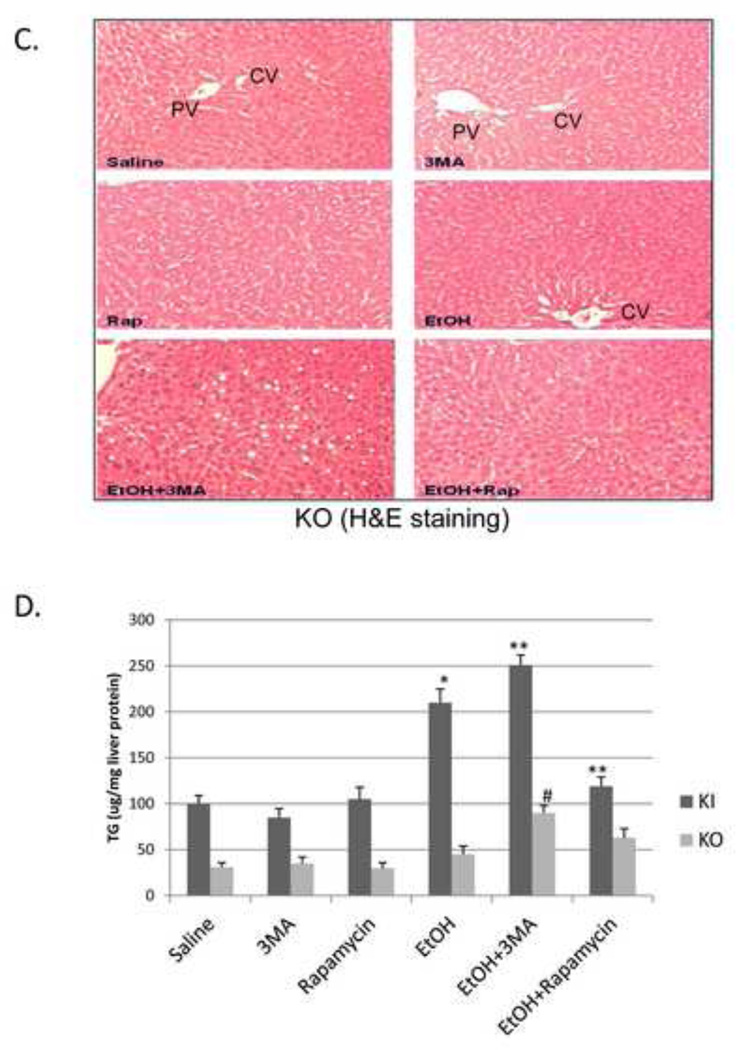
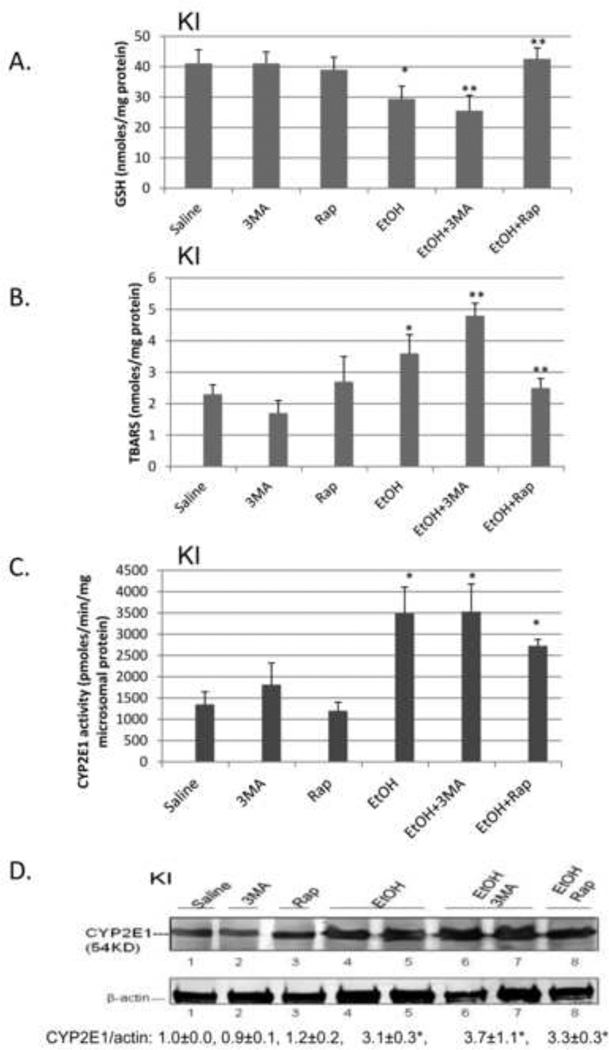
To evaluate the functional significance, if any, of the binge ethanol impairment of macroautophagy, WT, CYP2E1 KI and CYP2E1 KO mice were treated with ethanol in the absence and presence of an inhibitor of autophagy or an activator of autophagy. 3-MA blocks autophagosome formation by inhibition of type III phosphatidylinositol 3-kinases (PI-3K) [18, 19]. Rapamycin is an autophagy activator which blocks mTOR activation [20]. The 3-MA or rapamycin were administered by IP injection once a day for four days. Inhibition of autophagy by 3-MA in binge alcohol-treated CYP2E1 KI mice enhanced liver injury and steatosis. Binge ethanol treatment alone produced a small increase (50–75%) in serum ALT and AST levels in the KI mice in the absence of 3-MA or rapamycin (Fig 4A, columns 1 and 2 compared to columns 7 and 8). 3-MA had no effect on ALT or AST levels in saline-treated mice but increased transaminase levels in the binge ethanol-treated mice (Fig. 4A columns 9 and 10 compared to columns 3 and 4 and columns 7 and 8). Rapamycin lowered the ethanol-induced elevation of AST (Fig 4A, column 12 compared to column 8). Binge ethanol treatment in the KO mice did not elevate ALT or AST levels in the absence or presence of 3-MA or rapamycin (data not shown). The ethanol-induced increases in hepatic triglycerides or Oil Red O Staining were further elevated by 3-MA in the KI mice and reduced by rapamycin (Fig. 4B, 4D). Small increases in Oil Red O Staining and triglycerides by 3-MA were observed in the binge ethanol-treated KO mice (Fig. 4C, 4D). Rapamycin had no effect on the ethanol steatosis in the KO mice. The binge ethanol-induced oxidant stress in the KI mice was further elevated by 3-MA treatment but reduced by rapamycin. Hepatic GSH levels were 29, 23 and 40 nmoles/mg liver protein for the ethanol alone, ethanol plus 3-MA and ethanol plus rapamycin-treated mice, respectively, compared to saline control values of 40 nmoles/mg (Fig. 5A). Hepatic TBARS levels were (nmoles/mg): saline control, 2.1; ethanol alone, 3.7; ethanol plus 3-MA, 4.9; ethanol plus rapamycin, 2.3 (Fig. 5B). 3-MA or rapamycin did not affect CYP2E1 catalytic activity or protein levels in saline-treated or the binge ethanol-treated mice (Fig. 5C, 5D), and did not blunt the elevation of CYP2E1 produced by ethanol.
Fig. 4. Inhibition of autophagy promotes binge ethanol-induced liver injury and steatosis.
CYP2E1 KI, and KO mice were gavaged with ethanol in the absence or presence of 100 mg/kg body wt, 3MA or 5 mg/kg rapamycin once a day for 4 days. Serum ALT and AST (A). *,**, P<0.05 compared with ethanol alone, #, P<0.05 compared with saline group. N=4. Liver H&E staining in KI, 100× magnification (B) or KO mice, 100× magnification (C); liver TG content (D). *, P<0.05 compared with saline mice; **, #, P<0.05 compared with ethanol alone. N=4.
Fig. 5. Inhibition of autophagy enhances binge ethanol induced oxidative stress.
CYP2E1 KI mice were treated with ethanol in the absence or presence of 3MA or rapamycin. GSH (A), TBARS (B), CYP2E1 activity (C), CYP2E1 content (D). *, **, P<0.05 compared with saline mice or ethanol alone. N=4.
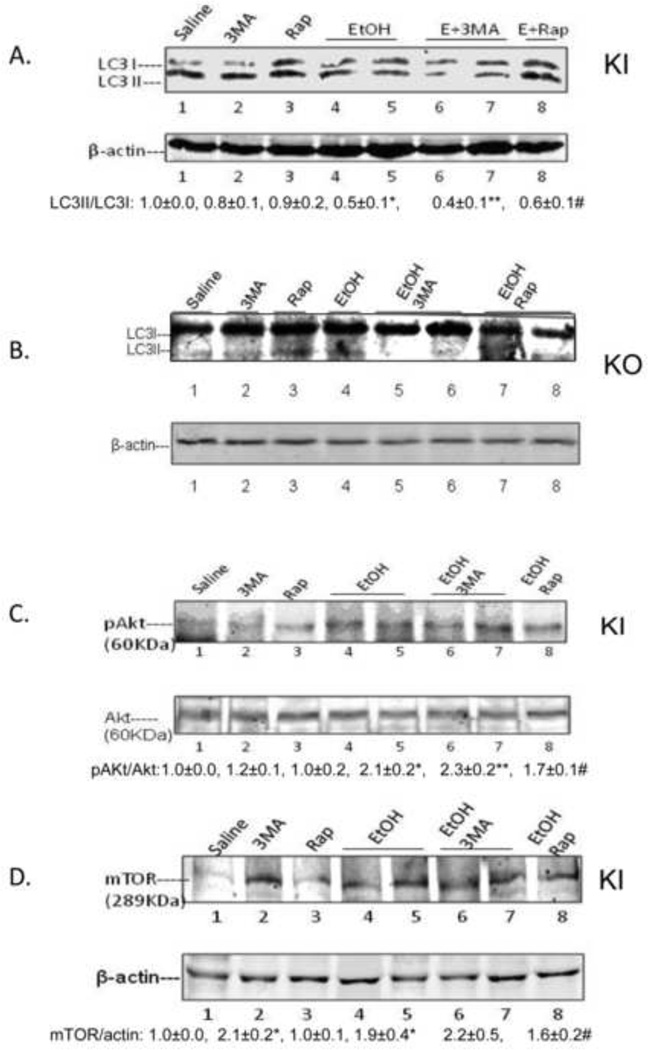
With respect to autophagy, the binge ethanol treatment lowered the LC3-II to LC3-I ratio 50% in the absence of 3-MA, 60 % in the presence of 3-MA, and 40% in the presence of rapamycin in KI mice (Fig 6A), with no effects on this ratio in KO mice (Fig 6B). The autophagy upstream regulator pAKT was increased 2 fold by binge alcohol; 3-MA slightly increased the pAKT/AKT ratio but rapamycin decreased it (Fig. 6C). The AKT downstream target mTOR was also increased 2 fold by binge alcohol, 3-MA slightly further increased and rapamycin slightly decreased mTOR levels (Fig. 6D).
Fig. 6. Effect of binge ethanol treatment on liver autophagy parameters.
CYP2E1 KI (A, C, D) or KO (B) mice were treated with ethanol in the absence of presence of 3MA or rapamycin. LC3I, II levels in KI (A) or KO mice (B); Levels of Akt or mTOR (C, D). *, P<0.05 compared with saline; **, P<0.05 compared with 3MA alone; #, P<0.05 compared with Rap alone. N=3.
Inhibition of autophagy induces toxicity and lipid accumulation in HepG2 E47 cells but not C34 cells
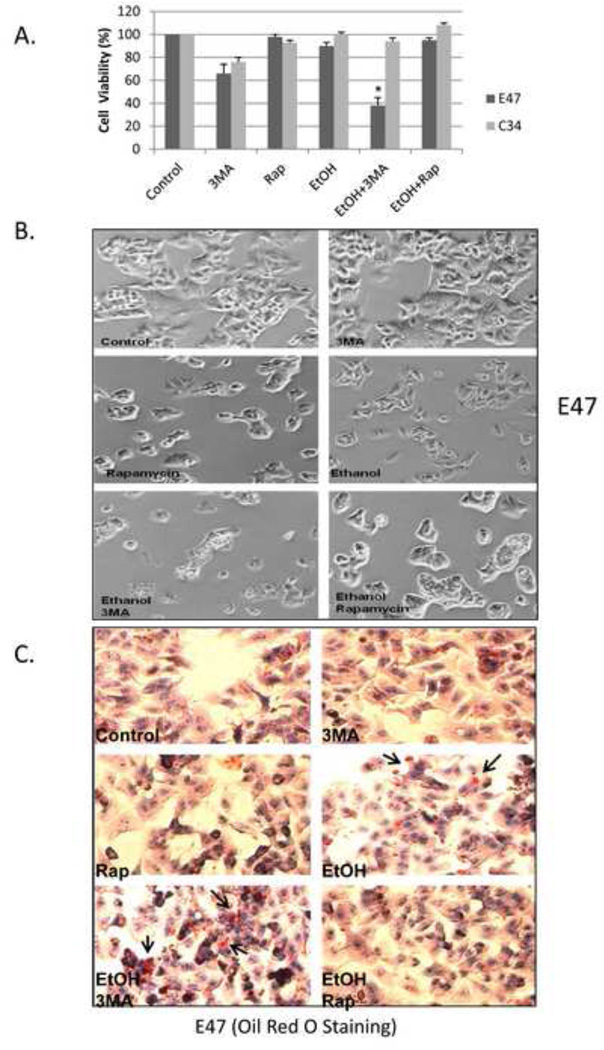
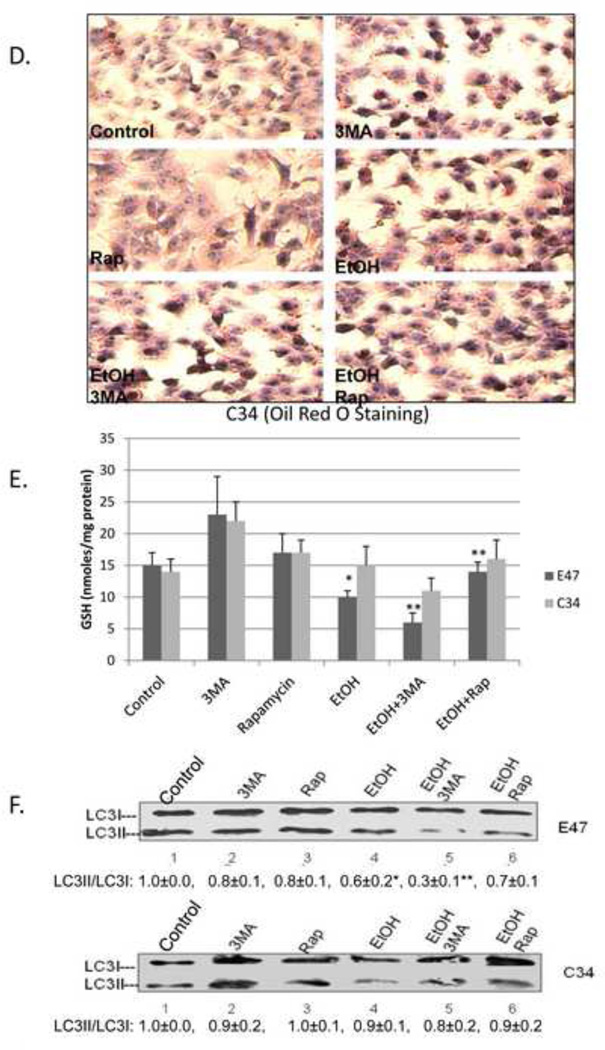
HepG2 E47 cells which express human CYP2E1 and HepG2 C34 cells which do not express CYP2E1 were treated with 100 mM ethanol for 8 days. Cell viability of the E47 cells was decreased only about 15 % (85 % viability) by ethanol alone but in presence of 2.5 mM 3-MA, the cell viability decreased to 38 % (Fig. 7A, B). Rapamycin afforded protection against this slight ethanol toxicity in the E47 cells. No ethanol toxicity was observed in the C34 cells even in the presence of ethanol plus 3-MA (Fig. 7A, B). E47 cells treated with 100 mM ethanol for 8 days had elevated lipid accumulation as seen by Oil Red O Staining (Fig. 7C). Inhibition of autophagy with 3-MA enhanced this lipid accumulation in E47 cells while rapamycin prevented it (Fig. 7C). Oil Red O Staining was much less in the C34 cells (Fig. 7D). The inhibition of autophagy by 3-MA enhanced oxidative stress in ethanol-treated E47 cells but not in ethanol-treated C34 cells e.g. GSH levels were significantly decreased by ethanol and further decreased by ethanol plus 3-MA. Rapamycin prevented the ethanol-induced decrease in E47 GSH levels, (Fig. 7E). Treatment with ethanol lowered the LC3-II/LC3-I ratio by 40 % in E47 cells but only by 10 % in C34 cells (Fig. 7F). 3-MA further lowered the LC3-II/LC3-I ratio, especially in the E47 cells (Fig. 7F).
Fig. 7. Inhibition of autophagy potentiates ethanol toxicity and steatosis in HepG2 E47 cells.
HepG2 E47 cells and C34 cells were treated with 100 mM ethanol in the absence or presence of 2.5 mM 3MA or 0.2 µg/ml rapamycin for 8 days. Cell viability was determined by MTT assay (A). *, P<0.05 compared with ethanol group; cell morphology under the light microscope (B); Oil Red O Staining in E47 (C) or C34(D) cells; GSH (E); LC3II/LC3I ratio (F). *, P<0.05 compared to control; **, P<0.05 compared to ethanol alone. N=3.
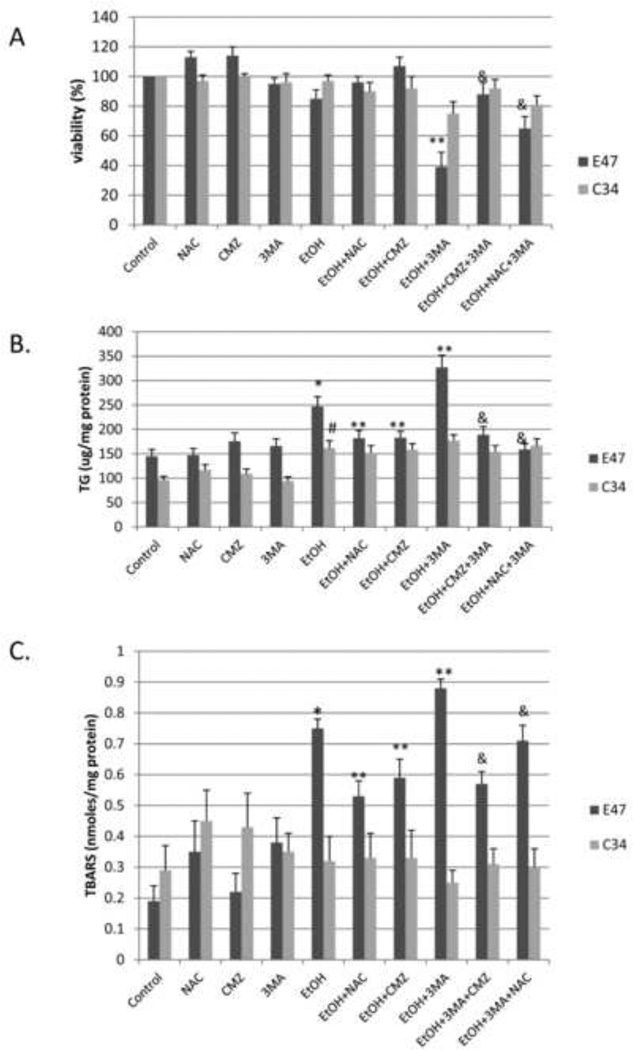
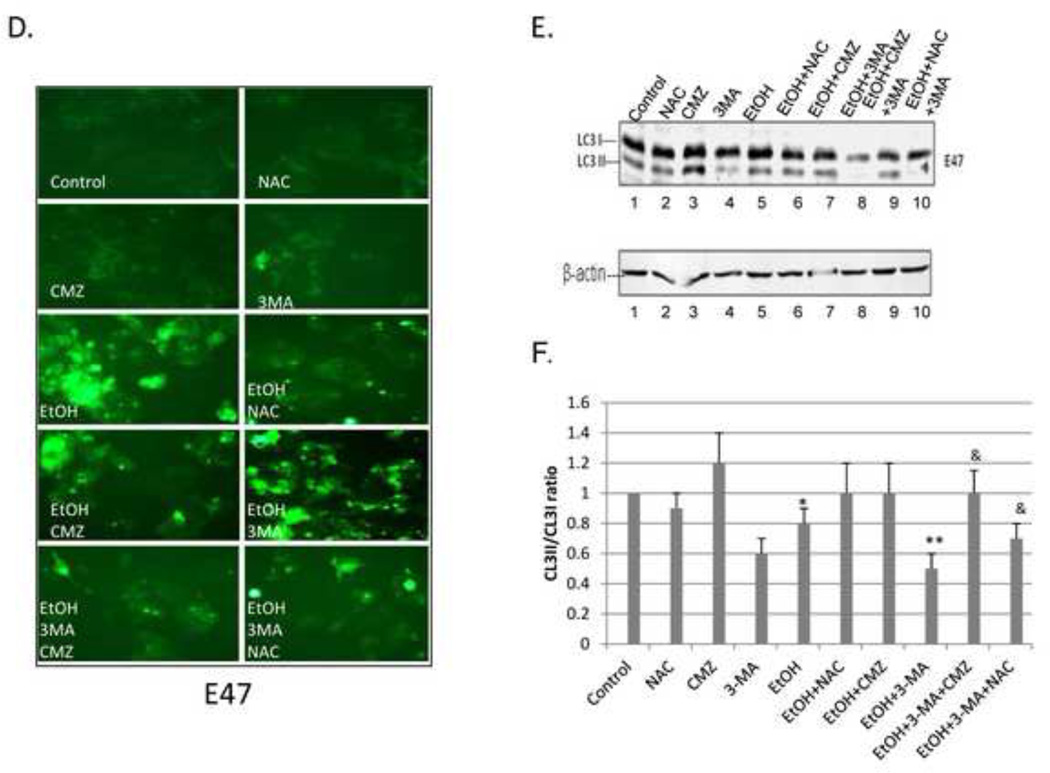
Experiments were carried out to validate a role for ROS in the ethanol-induced toxicity and steatosis, and the elevation of these effects by 3-MA in the E47 cells by studying the effects of the antioxidant NAC. We also confirmed that the more pronounced effects of ethanol in the E47 cells compared to the C34 cells was indeed due to the expression of CYP2E1 in the E47 cells by studying the effects of chlormethiazole (CMZ), an effective inhibitor of CYP2E1 [21]. Ethanol produced a 20 % loss of viability in the E47 cells (3 % loss of viability in the C34 cells). This decrease was prevented by either incubation with NAC or CMZ (Fig. 8A, panels 5, 6 and 7). In the presence of 3-MA, ethanol produced a 60 % loss of viability in the E47 cells (22 % loss in the C34 cells), an effect blocked by CMZ and partially blocked by NAC (Fig. 8A, panels 8, 9 and 10). The ethanol-induced increase in TG levels in the E47 cells was blocked by the treatments with NAC or CMZ (Fig. 8B panels 5, 6 and 7), as was the potentiation by 3-MA of the ethanol-induced increase in TG (Fig. 8B, panels 8, 9 and 10). The ethanol-induced increase in TBARS in the E47 cells, as well as the further increase by ethanol in the presence of 3-MA was partially blocked by the treatments with NAC or CMZ (Fig. 8C, panels 5–10). Ethanol increased the fluorescence of dihydroethidine a redox-sensitive dye, in the E47 cells (Fig 8D); little or no change occurred in the C34 cells, (data not shown). 3-MA treatment further elevated fluorescence of dihydroethidium. These increases in fluorescence by ethanol and by ethanol plus 3-MA in the E47 cells were largely prevented by the treatments with NAC or with CMZ (Fig. 8D). With respect to autophagy, ethanol lowered the LC3-II/LC3-I ratio by 20 % in the E47 cells, a decrease prevented by the treatment with NAC or CMZ (Fig. 8E lanes 5, 6, 7:quantified in Fig.8F). The LC3-II/LC3-I ratio was lowered 50% by ethanol plus 3-MA, a decrease prevented by NAC and CMZ (Fig, 8E, lanes 8, 9, 10:Fig.8F).
Fig. 8. Effect of NAC and CMZ on the potentiation of ethanol toxicity, oxidant stress and TG accumulation produced by 3-MA.
E47 or C34 cells were treated with 100 mM ethanol in the presence or absence of 3-MA or 3-MA plus CMZ or 3-MA plus NAC. Cell viability (A); TG content (B); TBARS (C); (*, P<0.05 compared to control; **, P<0.05 compared to ethanol alone; &, P<0.05 compared with EtOH plus 3MA); ROS evaluated by fluorescence staining with the Total ROS Detection Kit (D); LC3-I, LC3-II immunoblot (E); the ratio of LC3 II/LC3I (F). *, P<0.05 compared to control group; **, P<0.05 compared to ethanol alone; &, P<0.05 compared to EtOH plus 3-MA. N=3.
Discussion
Ethanol-induced liver pathology correlates with CYP2E1 levels and lipid peroxidation [22–24]. Inhibitors of CYP2E1 prevented the elevation of lipid peroxidation and the ethanol-induced liver pathology [21, 25]. Understanding the biochemical and toxicological properties of CYP2E1 is important for many reasons, even besides its role in contributing to alcohol-induced liver injury since CYP2E1 is induced under a variety of pathophysiological conditions such as fasting, diabetes, obesity and high fat diet, by drugs and in non alcohol-induced steatohepatitis [26–32]. CYP2E1 has been shown to contribute to ethanol-induced steatosis [10]. The effects of ethanol on autophagy are not clear. A recent study [13] showed that autophagy protects against liver injury from acute alcohol administration and acute alcohol increased autophagosome formation. Primary hepatocytes treated with ethanol had increased numbers of autophagosomes that contained mitochondria or lipid droplets compared with control hepatocytes. It was suggested that in response to alcohol, the liver might increase autophagy to selectively eliminate damaged mitochondria and limit lipid accumulation. Chemical and genetic inhibition of autophagy increased alcohol-induced injury in cultured hepatocytes and mouse liver [13, 14]. The effect of chronic ethanol consumption on autophagy has not yet been reported. Donohue and co-workers have shown that ethanol disrupts the lysosomes and inhibits lysosomal hydrolytic activity [33, 34] leading them to suggest ethanol might inhibit, not stimulate autophagic degradation [34]. More recently, ethanol was suggested to increase autophagosome formation but block autolysosome formation [35]. A combination of alcohol and LPS, which induced pancreatitis, increased numbers of autophagosomes but not autolysosomes [36]. These results indicated that the combination of alcohol and LPS blocked autophagosome-lysosome fusion [36]. Ethanol down-regulated autophagy-related proteins such as Beclin-1 and LC3-II in immune cells and this inhibition of autophagy by ethanol increased susceptibility to cell death [37]. Clearly more studies on the in-vitro and in-vivo effects of acute and chronic ethanol treatment on autophagy are needed. To our knowledge, there have been no reports on whether induction of CYP2E1 can modulate macroautophagy or whether ethanol metabolism by CYP2E1 or ethanol elevation of ROS via CYP21E1 can affect macroautophagy. Perhaps of major pathophysiological relevance is whether macroautophagy is protective against ethanol/CYP2E1 elevation of ROS, fatty liver and liver injury or promotes these responses by the liver to ethanol.
In the current study we have found that in a 4 day binge model, alcohol induced liver steatosis and produced higher TG levels in liver tissue and serum in WT mice and in CYP2E1 KI mice as compared to CYP2E1 KO mice. This effect of alcohol was associated with increases in CYP2E1 catalytic activity and protein levels and higher ROS stress (lower GSH higher TBARS) in WT and CYP2E1 KI mice as compared to KO mice. These results extend previous studies [16] in which chronic ethanol feeding induced steatosis and elevated oxidative stress in WT and CYP2E1 KI mice as compared to CYP2E1 KO mice to an acute binge alcohol model. In vitro tissue culture studies with HepG2 liver cells showed that 8 days of treatment with 100 mM ethanol increased fat accumulation to a greater extent in E47 HepG2 cells which express CYP2E1 than C34 HepG2 cells which do not express CYP2E1. Taken as a whole, these studies indicate that CYP2E1 plays a role in promoting binge ethanol-induced steatosis. Mechanistic studies as to how CYP2E1 promotes ethanol-induced steatosis focused on ROS formation and autophagy.
With respect to autophagy, a 4 day binge alcohol treatment lowered the LC3-II/LC3-I ratio about 30 % in WT and CYP2E1 KI mice as compared to a 10 % decline in the CYP2E1 KO mice. Treating the E47 cells with 100 mM ethanol for 8 days produced a 40 % decline in the LC3-II/LC3-I ratio as compared to a 10 % decline in the C34 cells. Treatment with ethanol plus 3-MA resulted in a 60% decline in the LC3-II/LC3-I ratio in livers from the KI mice, with no effect in the KO mice and a 70% decline in E47 cells compared to a 20% decline in the C34 cells.
A key regulator of autophagy is the mammalian target of rapamycin (mTOR) which senses cellular nutritional status and cell stress [20, 38]. Activation of mTOR inhibits autophagy. Anti-apoptotic Bcl-2 inhibits autophagy by complexing with a key autophagic component, Beclin-1 [39]. After binge alcohol treatment of CYP2E1 KI mice, P62/SQSTM1 was increased two fold, Beclin-1 decreased about one-half, and p-Akt and mTOR increased. Little or no changes in any of these parameters were found in the KO mice. These results suggest that the expression of CYP2E1 plays a role in the impairment of autophagy by ethanol, perhaps through activation of pAKT/mTOR. Interestingly, a decline in autophagy can contribute to hepatic steatosis [40, 41]. Hepatocyte lipid accumulation also decreases autophagy, suggesting that steatosis might be a mechanism of defective hepatic autophagy [11, 12, 40]. The impaired autophagy in KI mice or WT mice or E47 cells treated with ethanol might be due, in part, to CYP2E1 induced lipid accumulation. Conversely, the impairment of autophagy may contribute to the lipid accumulation.
It is likely that CYP2E1 promotes fat accumulation and impairs autophagy via mechanisms dependent on ROS formation. Binge alcohol treatment enhanced ROS stress in WT or CYP2E1 KI mice or E47 cells but not in CYP2E1 KO mice or C34 cells as reflected by decreases in GSH levels and increases in TBARS. Administration of 3MA enhanced ROS stress in the binge alcohol-treated CYP2E1 KI mice or ethanol treated E47 cells but not in KO mice or C34 cells. Rapamycin partiallly prevented the binge ethanol decline in GSH or increase in TBARS. Neither 3MA nor rapamycin modulated CYP2E1 activity or protein. 3MA inhibited autophagy and increased pAKT and mTOR, whereas rapamycin prevented these effects (Fig. 6. A, C, D), suggesting that the actions of 3MA or rapamycin were through altering autophagy activation and not CYP2E1 activity.
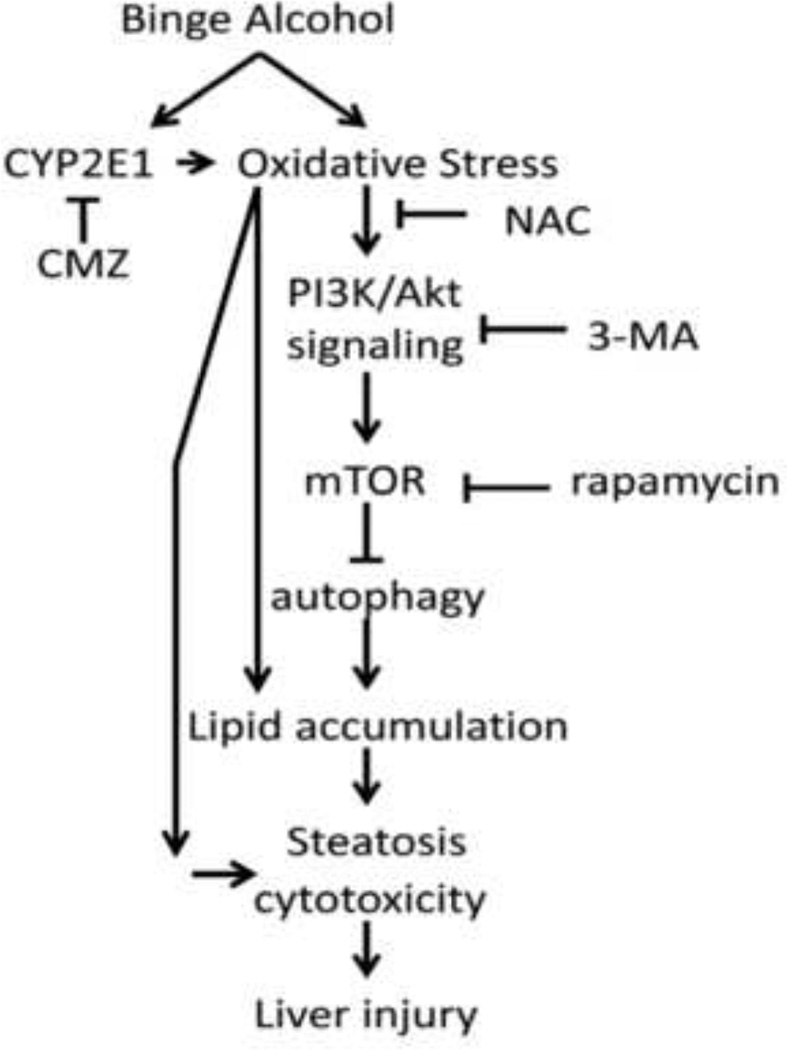
Autophagy suppresses cellular ROS [42, 43] by eliminating ROS-producing compartments such as damaged mitochondria (mitophagy) or endoplasmic reticulum (reticulophagy), or peroxisomes or accumulated lipids (lipophagy). Hence a decline in autophagy would promote ethanol-induced oxidant stress especially in the presence of CYP2E1. Autophagy may be activated by ROS as a cytoprotective mechanism but massive induction of autophagy by ROS may cause self digestion of cell components leading to cell injury or death. In many models, ROS appears to induce autophagy when then serves to decrease oxidative damage [43, 44]. However, not all ROS generators increase autophagy e.g. addition of menadione to Rala hepatocytes did not increase autophagy flow [45]. There are also indications that ROS can inhibit autophagy. For example, the protease activity of Atg 4, needed for the lipidation of LC3-I and conversion to LC3-II is inhibited by ROS [42, 46]. AMPK activity, which inhibits mTOR activity via phosphorylating TSC1 and TSC2, is lowered by ROS [47, 48]; this sustained activation of mTOR blocks autophagy. ROS such as H2O2 inhibit PTEN [49] which will promote accumulation of pAkt, and stimulation of mTOR. To evaluate the role of ROS and CYP2E1 in autophagy related liver injury and hepatotoxicity, we treated E47 or C34 cells with the ROS inhibitor NAC or the CYP2E1 inhibitor CMZ in the presence of 100mM ethanol for 8 days. The inhibition of autophagy by 3MA significantly increased ethanol toxicity, increased TG and TBARS levels and ROS stress in E47 cells but not in C34 cells. NAC or CMZ prevented the toxicity, lowered TG to non-treated control cell levels, and decreased TBARS content and ROS stress as compared with the ethanol plus 3MA group. These results suggest that in the presence of CYP2E1, the decrease of autophagy increased the generation of ROS which subsequently lowered cell viability and enhanced the accumulation of lipid droplets and TG levels (Fig. 9).
Fig. 9. Scheme.
A mechanistic link of autophagy, CYP2E1 and ethanol-induced ROS with development of steatosis and cytotoxicity.
Autophagy, in some settings is protective against cell injury, while in other settings, autophagy can promote cell toxicity [50, 51]. If autophagy is protective against ethanol/CYP2E1 toxicity, attempts to stimulate autophagy may prove to be helpful in lowering ethanol-induced liver injury. If autophagy promotes ethanol/CYP2E1 toxicity, inhibitors of autophagy (3MA, activators of mTOR signaling) may help to ameliorate ethanol hepatotoxicity. We have previously shown that ethanol induction of CYP2E1 initially upregulates hepatoprotective factors e.g. activation of Nrf2, induction of glutamate-cysteine ligase, heme oxygenase I, but this upregulation is not maintained in the face of sustained activation of CYP2E1 [52–54]. Does ethanol induction of CYP2E1 upregulate autophagy as an initial mechanism to remove damaged mitochondria and lipid droplets? If so, how can this upregulation be maintained and how can the harmful effects of overactivation of autophagy be prevented? Interestingly, Ding et. al (13) reported that an 18 hour binge with alcohol elevated autophagy, whereas we find that 4 days of binge alcohol lowered autophagy. The possibility that alcohol initially activates autophagy as a protective mechanism but this fails to be maintained by longer alcohol treatment merits investigation. Our results suggest that autophagy in ethanol treated CYP2E1 expressing mice or HepG2 cells can function as a protectant against liver injury or cytotoxicity and fat accumulation. A possible mechanism by which CYP2E1 promotes ethanol liver toxicity may be via impairment of liver autophagy, with a consequent loss of protection against liver steatosis, injury and cytotoxicity, which may have possible therapeutic implications for enhancement of autophagy to protect against alcohol liver injury.
Highlights.
Binge alcohol impairs autophagy in CYP2E1 knockin mice not in CYP2E1 knockout mice.
Activation of Akt and mTOR is found in binge alcohol treatment of CYP2E1 KI mice.
N-acetylcysteine prevents binge alcohol-induced steatosis and decline in autophagy.
Inhibit or induce autophagy promote or prevent binge alcohol steatosis and toxicity.
Autophagy is protective against CYP2E1-dependent alcoholic fatty liver and injury.
Acknowledgments
Financial Support:
Supported by United States Pubic Health Grants AA017425 and AA 018790 from the National Institute on Alcohol Abuse and Alcoholism.
List of Abbreviations
- CYP2E1
cytochrome P4502E1
- KI
knock in
- KO
knock out
- 3MA
3-methyladenine
- NAC
N-Acetyl-Cysteine
- CMZ
chlormethiazole hydrochloride
- TG
triglycerides
- ALT
alanine aminotransferase
- AST
aspartate aminotransferase
- MTT
3-(4,5-dimethylthiazol-2-yl)-2, 5-diphenyltetrazolium-bromide
- ROS
reactive oxygen species
Footnotes
Publisher's Disclaimer: This is a PDF file of an unedited manuscript that has been accepted for publication. As a service to our customers we are providing this early version of the manuscript. The manuscript will undergo copyediting, typesetting, and review of the resulting proof before it is published in its final citable form. Please note that during the production process errors may be discovered which could affect the content, and all legal disclaimers that apply to the journal pertain.
Contributor Information
Defeng Wu, Email: defeng.wu@mssm.edu.
Xiaodong Wang, Email: xiaodong.wang@mssm.edu.
Richard Zhou, Email: drahciruohz@gmail.com.
Lili Yang, Email: lili.yang@mssm.edu.
References
- 1.Gao B, Bataller R. Alcoholic liver disease:pathogenesis and new therapeutic targets. Gastroent. 2011;141:1572–1588. doi: 10.1053/j.gastro.2011.09.002. [DOI] [PMC free article] [PubMed] [Google Scholar]
- 2.Stickel F, Seitz HK. Alcoholic steatohepatitis. Best Pract. Res. Clin. Gastroenterol. 2010;24:683–693. doi: 10.1016/j.bpg.2010.07.003. [DOI] [PubMed] [Google Scholar]
- 3.Beier JL, McClain CJ. Mechanisms and cell signaling in alcoholic liver disease. Biol. Chem. 2010;39:1249–1264. doi: 10.1515/BC.2010.137. [DOI] [PMC free article] [PubMed] [Google Scholar]
- 4.Zeng T, Xie KQ. Ethanol and liver: recent advances in the mechanisms of ethanol-induced hepatosteatosis. Arch. Toxicol. 2009;83:1075–1081. doi: 10.1007/s00204-009-0457-4. [DOI] [PubMed] [Google Scholar]
- 5.Arteel GE. Oxidants and antioxidants in alcohol-induced liver disease. Gastroenterology. 2003;124:778–790. doi: 10.1053/gast.2003.50087. [DOI] [PubMed] [Google Scholar]
- 6.Tilg H, Moschen AR, Kaneider NC. Pathways of liver injury in alcoholic liver disease. J. Hepatology. 2011;55:1159–1161. doi: 10.1016/j.jhep.2011.05.015. [DOI] [PubMed] [Google Scholar]
- 7.Manzo-Avaloss, Saavedra-Molina A. Cellular and mitochondrial effects of alcohol consumption. Int. J. Environ. Res. Public Health. 2010;7:4281–4304. doi: 10.3390/ijerph7124281. [DOI] [PMC free article] [PubMed] [Google Scholar]
- 8.Caro AA, Cederbaum AI. Oxidative stress, Toxicology and Pharmacology of Cyp2E1. Annual Rev. Pharmacol. Toxicol. 2004;44:27–42. doi: 10.1146/annurev.pharmtox.44.101802.121704. [DOI] [PubMed] [Google Scholar]
- 9.Lu Y, Cederbaum AI. CYP2E1 and oxidative liver injury by alcohol. Free Radical. Biol. Med. 2008;44:723–738. doi: 10.1016/j.freeradbiomed.2007.11.004. [DOI] [PMC free article] [PubMed] [Google Scholar]
- 10.Lu Y, Zhuge J, Wang X, Bai J, Cederbaum AI. Cytochrome P4502E1 contributes to ethanol-induced fatty liver in mice. Hepatology. 2008;47:1483–1494. doi: 10.1002/hep.22222. [DOI] [PubMed] [Google Scholar]
- 11.Dong H, Czaja MJ. Regulation of lipid droplets by autophagy. Trends Endocrin. Metab. 2011;22:234–240. doi: 10.1016/j.tem.2011.02.003. [DOI] [PMC free article] [PubMed] [Google Scholar]
- 12.Amir M, Czaja MJ. Autophagy in nonalcoholic steatohepatitis. Expert Rev. Gastroenterol. Hepatol. 2011;52:159–166. doi: 10.1586/egh.11.4. [DOI] [PMC free article] [PubMed] [Google Scholar]
- 13.Ding WX, Li M, Chen X, Ni HN, Lin CW, Gao W, Lu B, Stolz DB, Clemens DL, Yin XM. Autophagy reduces acute ethanol-induced hepatotoxicity and steatosis in mice. Gastroent. 2010;139:1740–1752. doi: 10.1053/j.gastro.2010.07.041. [DOI] [PMC free article] [PubMed] [Google Scholar]
- 14.Ding WX, Manley S, Ni HN. The emerging role of autophagy in alcoholic liver disease. Exp. Biol. Med. 2011;236:546–556. doi: 10.1258/ebm.2011.010360. [DOI] [PMC free article] [PubMed] [Google Scholar]
- 15.Wu D, Wang X, Zhou R, Cederbaum AI. CYP2E1 enhances ethanol-induced lipid accumulation but impairs autophagy in HepG2 E47 cells. Biochem. Biophys. Res. Commun. 2010;402:116–122. doi: 10.1016/j.bbrc.2010.09.127. [DOI] [PMC free article] [PubMed] [Google Scholar]
- 16.Lu Y, Wu D, Wang X, Ward SC, Cederbaum AI. Chronic alcohol-induced liver injury and oxidant stress are decreased in cytochrome P4502E1 knockout mice and restored in humanized cytochrome P4502E1 knock-in mice. Free. Rad. Biol. Med. 2010;49:406–1416. doi: 10.1016/j.freeradbiomed.2010.07.026. [DOI] [PMC free article] [PubMed] [Google Scholar]
- 17.Wu D, Cederbaum AI. Development and properties of HepG2 cells that constitutively express CYP2E1. Methods Mol. Biol. 2008;447:137–150. doi: 10.1007/978-1-59745-242-7_11. [DOI] [PubMed] [Google Scholar]
- 18.Shintanl T, Klionsky DJ. Autophagy in health and disease: a double-edged sword. Science. 2004;306:990–995. doi: 10.1126/science.1099993. [DOI] [PMC free article] [PubMed] [Google Scholar]
- 19.Levine B. Eating oneself and uninvited guests: autophagy-related pathways in cellular defense. Cell. 2005;120:159–162. doi: 10.1016/j.cell.2005.01.005. [DOI] [PubMed] [Google Scholar]
- 20.Jung CH, Ro SH, Cao J, Otto NM, Kim DH. mTOR regulation of autophagy. FEBS Letters. 2010;584:1287–1295. doi: 10.1016/j.febslet.2010.01.017. [DOI] [PMC free article] [PubMed] [Google Scholar]
- 21.Gouillon Z, Lucas D, Li J, Hagbjork AL, French BA, Fu P, Fang C, Ingelman-Sundberg M, Donohue TM, Jr, French SW. Inhibition of ethanol-induced liver disease in the intragastric feeding rat model by chlormethiazole. Proc. Soc. Exp. Bio. Med. 2000;224:302–308. doi: 10.1046/j.1525-1373.2000.22435.x. [DOI] [PubMed] [Google Scholar]
- 22.French SW, Morimoto M, Reitz RC, Koop D, Klopfenstein B, Estes K, Clot P, Ingelman-Sundberg M, Albano E. Lipid peroxidation, CYP2E1 and arachidonic acid metabolism in alcoholic liver disease in rats. J. Nutr. 1997;127:907S–911S. doi: 10.1093/jn/127.5.907S. [DOI] [PubMed] [Google Scholar]
- 23.Castillo T, Koop DR, Kamimura S, Triadafilopoulos G, Tsukamoto H. Role of cytochrome P4502E1 in ethanol, carbon tetrachloride and iron-dependent microsomal lipid peroxidation. Hepatology. 1992;16:992–996. doi: 10.1002/hep.1840160423. [DOI] [PubMed] [Google Scholar]
- 24.Nanji AA, Zhao S, Sadrzadeh SMH, Dannenberg AJ, Tahan SR, Waxman DJ. Markedly enhanced cytochrome P4502E1 induction and lipid peroxidation is associated with severe liver injury in fish oil-ethanol-fed rats. Alcoholism: Clin. Exp. Res. 1994;18:1280–1285. doi: 10.1111/j.1530-0277.1994.tb00119.x. [DOI] [PubMed] [Google Scholar]
- 25.Morimoto M, Hagbjork AL, Wan YJ, Fu PC, Clot P, Albano E, Ingelman-Sundberg M, French SW. Modulation of experimental alcohol-induced liver disease by cytochrome P450 2E1 inhibitors. Hepatology. 1995;21:1610–1617. [PubMed] [Google Scholar]
- 26.Lieber CS. Cytochrome p4502E1:its physiological and pathological role. Physiol. Rev. 1997;77:517–544. doi: 10.1152/physrev.1997.77.2.517. [DOI] [PubMed] [Google Scholar]
- 27.Koop DR. Oxidative and reductive metabolism by cytochrome P4502E1. FASEB J. 1992;6:724–730. doi: 10.1096/fasebj.6.2.1537462. [DOI] [PubMed] [Google Scholar]
- 28.Song BJ, Cederbaum AI, Koop DR, Ingelman-Sundberg M, Nanji A. Ethanol-inducible cytochrome P450 (CYP2E1): Biochemistry, molecular biology and clinical relevance. Alcoholism: Clin. Exp. Res. 1996;20(Suppl.):138A–146A. doi: 10.1111/j.1530-0277.1996.tb01764.x. [DOI] [PubMed] [Google Scholar]
- 29.Raucy JL, Kraner JC, Lasker JM. Bioactivation of halogenated hydrocarbons by cytochrome P4502E1. Crit. Rev. Toxicol. 1993;2:1–20. doi: 10.3109/10408449309104072. [DOI] [PubMed] [Google Scholar]
- 30.Gonzalez FJ. Role of cytochromes P450 in chemical toxicity and oxidative stress: studies with CYP2E1. Mutat. Res. 2005;569:101–110. doi: 10.1016/j.mrfmmm.2004.04.021. [DOI] [PubMed] [Google Scholar]
- 31.Woodcroft KJ, Hafner MS, Novak RF. Insulin signaling in the transcriptional and posttranscriptional regulation of CYP2E1 expression. Hepatology. 2002;35:263–273. doi: 10.1053/jhep.2002.30691. [DOI] [PubMed] [Google Scholar]
- 32.Weltman MD, Farrell GC, Hall P, Ingelman-Sundberg M, Liddle C. Hepatic Cytochrome P4502E1 is increased in patients with nonalcoholic steatohepatitis. Hepatology. 1998;27:128–133. doi: 10.1002/hep.510270121. [DOI] [PubMed] [Google Scholar]
- 33.Kharbanda KK, McVicker DL, Zetterman RK, Donohue TM., Jr Ethanol consumption reduces the proteolytic capacity and protease activities of hepatic lysosomes. Biochim. Biophys. Acta. 1995;1245:421–429. doi: 10.1016/0304-4165(95)00121-2. [DOI] [PubMed] [Google Scholar]
- 34.Donohue TM., Jr Autophagy and ethanol-induced liver injury. World J. Gastroent. 2009;15:1178–1185. doi: 10.3748/wjg.15.1178. [DOI] [PMC free article] [PubMed] [Google Scholar]
- 35.Osna NA, Thomes PG, Donohue TM., Jr Involvement of autophagy in alcoholic liver injury and hepatitis c pathogenesis. World J. Gastroent. 2011;17:2507–2514. doi: 10.3748/wjg.v17.i20.2507. [DOI] [PMC free article] [PubMed] [Google Scholar]
- 36.Fortunato F, Burgers H, Bergmann F, Riemers P, Buchler MW, Kroemer G, Werner J. Impaired autolysosome formation correlates with Lamp-2 depletion. Gastroent. 2009;137:350–360. doi: 10.1053/j.gastro.2009.04.003. [DOI] [PubMed] [Google Scholar]
- 37.Von, Haefen C, Sifringe M, Menk M, Spies CD. Ethanol enhances susceptibility to apoptotic cell death via down regulation of autophagy-related proteins. Alcoholism: Clin. Exp. Res. 2011;35:1381–1391. doi: 10.1111/j.1530-0277.2011.01473.x. [DOI] [PubMed] [Google Scholar]
- 38.Mendelsohn AR, Larrick JW. Rapamycin as an antiaging therapeutic? Rejuvenation Res. 2011;14:437–441. doi: 10.1089/rej.2011.1238. [DOI] [PubMed] [Google Scholar]
- 39.Klionsky DJ, Emr SD. Autophagy as a regulated pathway of cellular degradation. Science. 2000;290:1717–1721. doi: 10.1126/science.290.5497.1717. [DOI] [PMC free article] [PubMed] [Google Scholar]
- 40.Czaja MJ. Functions of autophagy in hepatic and pancreatic physiology and disease. Gastroent. 2011;140:1895–1908. doi: 10.1053/j.gastro.2011.04.038. [DOI] [PMC free article] [PubMed] [Google Scholar]
- 41.Czaja MJ. Autophagy in health and disease. 2. Regulation of lipid metabolism and storage by autophagy: pathophysiological implication. Am. J. Physiol. Cell Physiol. 2010;298:C973–C978. doi: 10.1152/ajpcell.00527.2009. [DOI] [PMC free article] [PubMed] [Google Scholar]
- 42.Huang J, Lam GY, Brumell JH. Autophagy signaling through reactive oxygen species. Antioxidants & Redox Signaling. 2011;14:2215–2231. doi: 10.1089/ars.2010.3554. [DOI] [PubMed] [Google Scholar]
- 43.Shouvel-Scherz R, Elazar Z. Regulation of autophagy by ROS: Physiology and pathology. Trends Biochem. Sci. 2011;36:30–38. doi: 10.1016/j.tibs.2010.07.007. [DOI] [PubMed] [Google Scholar]
- 44.Shouvel-Scherz R, Elazar Z. ROS mitochondria and the regulation of autophagy. Trends Cell Biology. 2007;17:422–427. doi: 10.1016/j.tcb.2007.07.009. [DOI] [PubMed] [Google Scholar]
- 45.Wang Y, Singh R, Xiang Y, Czaja MJ. Macroautophagy and chaperone-mediated autophagy are required for hepatocyte resistance to oxidant stress. Hepatology. 2010;52:266–277. doi: 10.1002/hep.23645. [DOI] [PMC free article] [PubMed] [Google Scholar]
- 46.Liu Z, Lenardo MJ. Reactive oxygen species regulate autophagy through redox-sensitive proteases. Develop. Cell. 2007;12:484–485. doi: 10.1016/j.devcel.2007.03.016. [DOI] [PubMed] [Google Scholar]
- 47.Crabb DW, Liangpunsakol S. Alcohol and lipid metabolism. J. Gastroent. Hepatol. 2006;21:S56–S60. doi: 10.1111/j.1440-1746.2006.04582.x. [DOI] [PubMed] [Google Scholar]
- 48.Liangpunsakol S, Wou SE, Zeng Y, Ross RA, Jayaram HN, Crabb DW. Effect of ethanol on hydrogen peroxide-induced AMPK phosphorylation. Am. J. Physiol. GI. Liver Physiol. 2008;295:1173–1181. doi: 10.1152/ajpgi.90349.2008. [DOI] [PMC free article] [PubMed] [Google Scholar]
- 49.Chiarugi P. PTPs versus PTKs: the redox side of the coin. Free Rad. Res. 2005;39:353–365. doi: 10.1080/10715760400027987. [DOI] [PubMed] [Google Scholar]
- 50.Rautou PE, Mansour A, Lebrec D, Durand F, Valla D, Moreau R. Autophagy in liver diseases. J. Hepatol. 2010;53:1123–1134. doi: 10.1016/j.jhep.2010.07.006. [DOI] [PubMed] [Google Scholar]
- 51.Yin XM, Ding WX, Gao W. Autophagy in the liver. Hepatology. 2008;47:1773–1785. doi: 10.1002/hep.22146. [DOI] [PubMed] [Google Scholar]
- 52.Mari M, Cederbaum AI. Induction of catalase, alpha and microsomal glutathione transferases in CYP2E1-overexpressing HepG2 cells and protection against short-term oxidative stress. Hepatology. 2001;33:652–661. doi: 10.1053/jhep.2001.22521. [DOI] [PubMed] [Google Scholar]
- 53.Gong P, Cederbaum AI. Nrf2 is increased by CYP2E1 in rodent liver and HepG2 cells and protects against oxidative stress caused by CYP2E1. Hepatology. 2006;43:144–153. doi: 10.1002/hep.21004. [DOI] [PubMed] [Google Scholar]
- 54.Cederbaum AI. Nrf2 and antioxidant defense against CYP2E1 toxicity. Expert Opinion Drug Metab. and Toxicology. 2009;5:1223–1244. doi: 10.1517/17425250903143769. [DOI] [PubMed] [Google Scholar]


