

Abstract
The purpose of this study was to investigate the oxygen distribution and consumption in the pigmented Long-Evans rat retina in vivo during dark and light adaptation, and to compare these results to previous work on cat and albino rat. Double-barreled microelectrodes recorded both intraretinal PO2 depth profiles and the electroretinogram (ERG), which was used to identify the boundaries of the retina. Light adaptation decreased photoreceptor oxygen consumption per unit volume (Qav) from 3.0±0.4 ml•100 g−1•min−1 (mean ± SEM) in darkness to 1.8±0.2 ml•100 g−1•min−1 and increased minimum outer retinal PO2 at the inner segments (Pmin) from 17.4±3.0 to 29.9±5.3 mmHg. The effects of light on outer retinal PO2 and Qav were similar to those previously observed in cat, monkey, and albino rats; however, dark-adapted Pmin was higher in rat than cat. The parameters derived from fitting the oxygen diffusion model to the rat data were compared to those from cat. Oxygen consumption of the inner segments (Q2) and choroidal PO2 (PC) in rat and cat were similar. Pmin was higher in rat than in cat for two reasons: first, rat photoreceptors have a shorter oxygen consuming region; and second, the retinal circulation supplied a greater fraction of consumed oxygen to rat photoreceptors. The average PO2 across the inner retina (PIR) was not different in dark adaptation (25.4±4.8 mm Hg) and light adaptation (28.8±5.4 mmHg) when measured from PO2 profiles. However, with the microelectrode stationary at 9–18% retinal depth, a small consistent decrease in PO2 occurred during illumination. Flickering light at 6 Hz decreased inner retinal PO2 significantly more than an equivalent steady illumination, suggesting that changes in blood flow did not completely compensate for increased metabolism. This study comprehensively characterized rat retinal oxygenation in both light and dark, and determined the similarities and differences between rat and cat retinas.
Keywords: Long-Evans rat, retina, photoreceptor, metabolism, oxygen, flickering light
1. Introduction
The rat is commonly used as a model for human retinal diseases, including diabetic retinopathy. However, oxygen consumption and distribution has not been adequately characterized for the pigmented Long-Evans rat retina. Previous work on intraretinal oxygenation in the rat was mainly performed using albino Sprague-Dawley rats (Cringle et al., 1992a; Cringle et al., 1991, 1992b; Cringle et al., 2002; Cringle et al., 2006; Yu et al., 1998; Yu and Cringle, 2002; Yu et al., 1999; Yu et al., 1994; Yu et al., 2000). PO2 in the outer retina was found to be higher in rat than in cat and monkey (Cringle et al., 2002; Yu and Cringle, 2002). Therefore, one motivation for this work was to confirm that the intraretinal oxygen profiles of rat are indeed different from cat. In addition, the previous work on rats was conducted with single-barreled microelectrodes that did not record the intraretinal electroretinogram (ERG). The study described here used double-barreled microelectrodes that simultaneously recorded PO2 and ERG. ERG recordings are valuable because they are used to assess the condition of the retina as well as to detect when the electrode crosses from the vitreous into the retina and from the retina to the retinal pigment epithelium (RPE) (Linsenmeier and Braun, 1992). These recordings can be made while maintaining dark adaptation since only brief flashes of dim light are required to elicit the ERG.
A second motivation for this work was to identify the differences in photoreceptor oxygenation between rat and cat. We specifically wanted to determine why PO2 approaches zero at the photoreceptor inner segments in cat (Braun et al., 1995; Linsenmeier, 1986) but not in rat (Cringle et al., 2002; Yu and Cringle, 2002). This evaluation was done by comparing rat and cat retinal oxygenation parameters derived from fitting a mathematical model to oxygen profiles from both species. Ultimately, a thorough evaluation of the metabolic properties of the rat retina allows us to better apply this animal model towards understanding human retinal diseases.
Finally, this work begins to address the effect of flickering light on inner retinal oxygenation. In monkeys, ganglion cell firing rates are higher during flicker compared to steady light (Lee et al., 1989). The convergence of signals from rods onto bipolar and then ganglion cells allows this effect to occur at relatively low mean illumination. Increased ganglion cell firing rate is expected to increase oxygen consumption in the inner retina, and previous work showed that blood flow increased during flicker to partially compensate for increased oxygen consumption (see (Riva et al., 2005) for a review). However, the extent to which increased blood flow compensates for increased oxygen demand is not known. Although oxygen consumption in the inner retina cannot be quantified from PO2 measurements, the effect of flickering light on PO2 gives an indication of the balance between metabolism (demand) and blood flow (supply).
2. Materials and Methods
2.1 Animal preparation
All animal experiments were performed in accordance with the ARVO Statement for the Use of Animals in Ophthalmic and Vision Research, and were approved by Northwestern University’s Institutional Animal Care and Use Committee. A total of 10 adult male Long-Evans pigmented rats weighing 308 to 510 g were used in these experiments. Each rat was initially anesthetized with 3% isoflurane, 35% oxygen, and balance nitrogen. Isoflurane was adjusted as necessary during surgery. A tracheal tube was inserted to allow for artificial respiration following paralysis. The right eye was prepared for surgery by slitting the medial and lateral canthi. Sutures were placed in the upper eyelid and pulled back to expose the eye. An incision was made in the conjunctiva to expose the sclera. Two sutures were placed in the sclera on the superior side of the eye 3 mm apart and 1 mm from the limbus. A third suture was placed in the conjunctiva centered between the scleral sutures. Following completion of surgery on the eye, the eyelids were closed with a wound clip and the head was covered to reduce light exposure while other surgical preparations were performed. Two Ag/AgCl electrodes were sutured subcutaneously in the back of the neck and used as reference electrodes for the voltage and oxygen recordings. Next, the femoral vein and artery were cannulated. The arterial cannula was used to monitor arterial blood pressure, pH, and blood gases. Once the venous cannula was in place, urethane was administered intravenously at 0.8 to 1.0 ml/hr until a loading dose of 800 mg/kg was reached, while simultaneously reducing the isoflurane dose. After the loading dose of urethane was administered, the rat was paralyzed with pancuronium bromide (0.3 mg/kg) and artificially respired at a rate of 60 breaths/min. Adjusting the volume of artificial respiration allowed arterial blood to be maintained at normal physiological levels. Blood gases and pH were monitored approximately every hour using a Ciba-Corning RapidLab 860 (PaO2 = 101.0±12.0 mmHg, PaCO2 = 41.8±7.8 mmHg, pHa = 7.34±0.07; mean ± SD, n = 10). During the recording phase, a mixture of urethane (75 mg/kg-hr), pancuronium bromide (0.5 mg/kg-hr), and saline (3 ml/kg-hr) was administered intravenously by a syringe pump. Isoflurane was then reduced to 0.5%. The pupil was dilated with topical 1% atropine. The temperature was maintained at 38 to 39°C by a heating blanket connected to a water bath with feedback from a rectal temperature probe.
Following surgical preparations, the head was immobilized in a head holder. The eye was covered with an opaque contact lens to preserve dark adaptation. The sutures in the sclera and conjunctiva were tied to a brass plate to stabilize the eye. A specially constructed needle was used to penetrate the eye and carry the microelectrode. The needle had two graduated parts with an overall length of 23 mm. It was constructed from 20 mm-long, 14 gauge stainless steel tubing bonded to 20 gauge tubing that ended with a short bevel. Figure 1 shows a diagram of the rat eye with a needle and double-barreled oxygen electrode.
Figure 1.
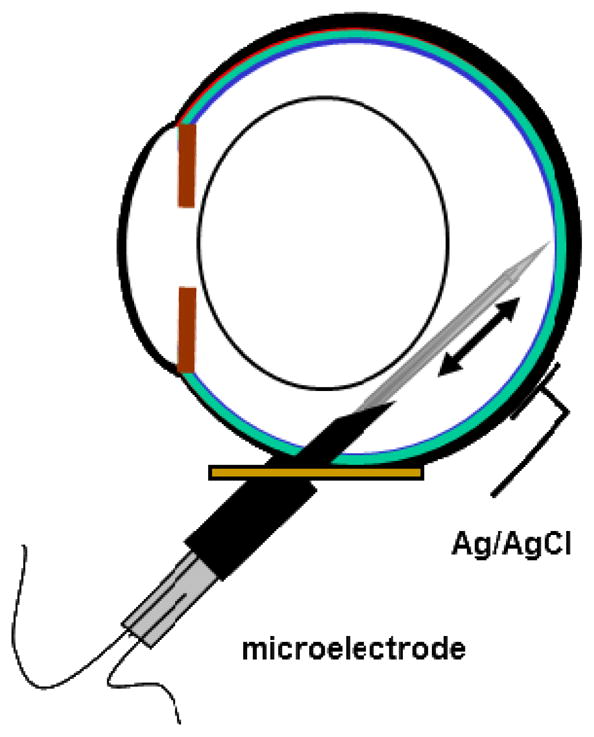
Schematic of the experimental setup. The manipulator that held the eye, which allowed for positioning of the electrode, and the boot sealing the electrode into the needle are not shown.
The needle was inserted into the eye via a hole in the brass plate and positioned so that it would pass behind the lens into the vitreous humor. Just before inserting the needle, the intraocular pressure was briefly increased to approximately 60 mmHg by cannulating the anterior chamber with a 30 gauge needle attached to a saline reservoir and returned to normal after needle insertion. The elevated pressure increased the rigidity of the eye, which assisted the needle penetration. Microelectrodes were guided through the needle towards the retina using a hydraulic microdrive (Model 607W, David Kopf Instruments, Tujunga, California), which allowed for controlled penetration into the retina in steps as small as 1 μm. The position of the needle, and therefore the electrode, in the eye was adjusted by a manipulator whose center of rotation in two dimensions was at the wall of the eye. The electrode was sealed into the needle by a silicone rubber boot (Dow Corning 3110 RTV) that prevented leakage of vitreous humor but allowed for movement of the electrode. The position of the needle was verified by direct ophthalmoscopy, taking care to minimize the illumination and duration of this procedure. Thereafter, the eye was maintained in darkness except for the illumination described below. A plano contact lens (base curve 3 mm radius, 6 mm diameter; Metro Optics, Houston, TX) was placed on the cornea to prevent dehydration.
2.2 Electrode preparation
Double-barreled oxygen-sensitive microelectrodes were used to collect oxygen profiles across the rat retina. Electrodes were constructed as previously described (Linsenmeier and Yancey, 1987). The electrodes were made with a long taper of approximately 7 mm so that only the tapered region entered the eye. In these electrodes, one barrel recorded current proportional to PO2 while the second barrel recorded intraretinal voltage.
2.3 Data collection
The vitreal and intraretinal ERGs were used to determine the relative position of the electrode and the condition of the retina. Flashes of light were 2.5 seconds in duration at an illumination below rod saturation (< 10 lux). The b-wave was positive in the vitreous and became negative when it crossed into the retina.
The microelectrode was advanced into the retina in 3 μm steps. The holder of the brass plate was tapped every two steps to help in electrode movement. Figure 2A shows ERGs as a function of retinal depth from one penetration in response to flashes at an illumination just below rod saturation. The boundary between the retina and choroid was identified when the magnitude of the b- and c-waves decreased. Frequently, the DC voltage also decreased when the electrode crossed the RPE and entered the choriocapillaris, which indicated the transepithelial potential across the RPE. During penetration, PO2 increased across the outer retina until it reached a maximum in the choroid. After the electrode crossed the RPE, it was withdrawn from the retina at a constant rate of 2 μm/sec, thus generating the oxygen profile. As the electrode approached the vitreous, brief flashes of light were delivered to determine when the electrode exited the retina, indicated by a reversal of the b-wave from negative to positive. The entire intraretinal oxygen profile was recorded at 2 Hz. PO2 profiles were first obtained in dark adaptation. Then, light-adapted profiles were recorded under constant illumination (approximately 80 lux) sufficient to saturate rod responses in the ERG.
Figure 2.

Intraretinal electroretinogram (ERG) from one rat (Rat 104) in response to 2.5 sec of illumination just below rod saturation (<10 lux), as a function of retinal depth.
A. Individual ERG traces at different retinal depths shown as percentage of the distance between the vitreous (0%) and the choriocapillaris (100%). The negative trough in the intraretinal recordings is the b-wave, and the c-wave is the peak just before the light was turned off. The amplitudes of both the b- and c-waves decreased precipitously after the electrode crossed the RPE into the choroid.
B. The amplitudes of the b- and c-waves from the traces in 2A, measured from baseline, as a function of retinal depth.
The ERG was recorded with a unity-gain, high impedance amplifier (WPI M707). The signal was then amplified by one channel of a Tektronix 5111 oscilloscope, filtered (DC to 30 or 50 Hz), and digitized with a National Instruments data acquisition board connected to a computer. The current from the oxygen electrode was measured with a picoammeter (Model 614 electrometer, Keithley Instruments, Cleveland, Ohio). The output voltage from the picoammeter was fed through a custom-made buffer amplifier, filtered from DC to 30 Hz, and recorded on a computer.
2.4 Three layer one-dimensional diffusion model
The three layer one-dimensional diffusion model (Haugh et al., 1990) previously used for cat retina (Braun et al., 1995) and monkey retina (Birol et al., 2007) was fitted to the outer half of rat retinal PO2 profiles to determine several parameters of photoreceptor oxygenation, including photoreceptor oxygen consumption per unit volume, Qav. The outer retina was modeled as a uniform semi-infinite slab with oxygen diffusing in one dimension along the photoreceptor from both the choroid and the retinal circulation. The oxygen-consuming region was physically separated from the oxygen sources, which were boundary conditions in the model (PC, PO2 at the choroid; and PL, the PO2 at x = L, which is the inner boundary of the avascular layer, approximately at the outer plexiform layer). Equation 1 below describes the steady-state oxygen balance based on Fick’s Law, where Q is oxygen consumption, D is diffusivity of oxygen, k is solubility of oxygen, P is PO2, and x is the distance from the choroid (Takahashi et al., 1966).
| Equation 1 |
The three layers of the model represented photoreceptor outer segments (Layer 1), photoreceptor inner segments (Layer 2), and the outer nuclear layer (Layer 3). Oxygen consumption in Layer 2 (Q2) was previously found to be two orders of magnitude larger than in Layers 1 and 3 (Haugh et al., 1990). Thus, Q1 and Q3 were considered negligible and were set to zero in those layers. Solving Equation 1 for the three layers gives Equations 2 to 4 below. The PO2 and oxygen flux were assumed to be continuous at the boundaries between layers (L1 and L2). The constants, α and β, were solved by imposing the boundary conditions on Equations 2 to 4 below.
| Equation 2 |
| Equation 3 |
| Equation 4 |
Layers 1 and 3 both have linear PO2 profiles. In order to establish the location of the choriocapillaris boundary, a straight line was drawn over the linearly decreasing PO2 data in layer 1, and the point at which the profile deviated from the line was taken to be x = 0. A similar procedure was used to find the end of layer 3 (at x = L), the boundary between retina and vitreous. L also represents the length of the photoreceptors. The length of the entire retina is approximately 2L, and the ERG b-wave reversed from negative to positive during withdrawal when the electrode crossed from the retina into the vitreous (at x = 2L). The retina/vitreous boundary at 2L was also used to verify the position of L. Equations 2 to 4 were fitted to the data by iteratively adjusting L1, L2, PC, PL, and Q2/Dk. Q2 was calculated by assuming values of D (1.97 × 10⁻⁵ cm2/sec) and k (2.4 × 10⁻⁵ ml O2/(ml retina · mmHg)) (Braun et al., 1995). The average oxygen consumption in the entire outer retina was calculated as the weighted average of consumption in the three layers, which is Qav = Q2 (L2−L1)/L. The length of the retina as determined from the PO2 profiles was usually longer than values found from histological studies of the rat retina. Qav was then normalized to L = 85 μm, the thickness of the electrode drag on the tissue. This normalization also affected the values of L1, L2, and Q2.
Oxygen consumption in the normal inner retina cannot be quantified in vivo using oxygen microelectrodes. Data can only be collected along one dimension, and oxygen can diffuse in three dimensions due to the distribution of blood vessels in the inner retina. Inner retinal oxygenation was characterized by obtaining the average PO2 across the inner 50% of the retina in each oxygen profile. A total of 10 rats were used in these experiments to evaluate Qav in dark and light adaptation.
2.5 Flicker experiments
To measure changes in PO2 in response to flickering light, the electrode was kept stationary in the inner retina. The electrode was driven from the vitreous toward the retina until a negative deflection in the voltage barrel indicated it hit the retina. The electrode was stepped in to 30–60 μm from the surface of the retina, approximately 9–18% retinal depth when corrected for the 30° penetration angle. PO2 was measured in response to both steady and flickering light. Baseline PO2 was recorded in the dark for 30 seconds. The duration of illumination was 30–60 seconds followed by darkness. The change in PO2 (ΔPO2) was calculated by subtracting the steady-state PO2 under illumination from the baseline PO2. Retinal illuminance was varied with neutral density filters and is given in log units of attenuation from the maximum available illumination of 790 lux. Flickering light with a sinusoidal temporal variation had the same or lower time-averaged illumination as the steady light to which it was compared. Five animals were used to compare 6 Hz flickering light to steady light with 3 log units or more of attenuation. In two of these animals, PO2 profiles in dark and light adaptation were also recorded.
2.6 Statistics
Values for each parameter were averaged within each animal, and then the values for all animals were averaged so that each animal was weighted equally. All values are reported as mean ± standard error of the mean (SEM). Statistical significance was determined using paired Student’s t-test and was defined as p < 0.05. A data point was considered an outlier if it was greater than two standard deviations from the mean. The parameters PC, Qav, and PL in darkness each had one outlier in the data set. The data sets for these parameters were Winsorized at the 10th percentile (Barnett and Lewis, 1978; Hastings et al., 1947) to minimize the aberrant influence of the outlier. First, for each of the three data sets with an outlier, values from all 10 rats were sorted from lowest to highest. Then, the lowest and highest values were replaced with the next value in the data set. Thus, the reported values for dark-adapted PC, Qav, and PL are the Winsorized mean and SEM.
3. Results
3.1 ERG depth profiles
The ERG was recorded to assess the condition of the retina and to determine the relative location of the electrode within the retina. Figure 2A shows the ERG as a function of retinal depth during one penetration under dark adaptation, which was typical of all rats used in this study. The b-wave was positive in the vitreous humor. As the electrode progressed into the retina, the b-wave became negative-going, increased in amplitude until it peaked at approximately 40% retinal depth (Figure 2B), and decreased as the electrode progressed towards the choroid. The c-wave was positive-going and did not become noticeable until approximately 40% retinal depth. It reached a maximum just proximal to the RPE. The amplitudes of both the b- and c-waves decreased dramatically after the electrode crossed the RPE into the choroid.
3.2 Rat retinal PO2 profiles
Figure 3 shows typical intraretinal PO2 profiles in dark and light adaptation obtained from one rat. In dark adaptation, the PO2 at the choriocapillaris (PC, 100% depth) was 40 mmHg. PO2 decreased to a minimum of 8 mmHg at 79% retinal depth and rose again toward the inner retina. The average PO2 over the inner half of the retina (called PIR) was 19 mmHg, and the PO2 at the border between the retina and vitreous (PL, 0% retinal depth) was 29 mmHg. The overall shape of the light-adapted PO2 profile was similar to the dark-adapted PO2 profile except that the minimum PO2 in the outer retina (Pmin) was higher under light adaptation. In the light-adapted retina, PC was 45 mmHg and Pmin was 28 mmHg. In the example shown, PIR was 27 mmHg and PL was 30 mmHg. PIR was higher in light adaptation than in dark adaptation, but this effect was not always observed, as noted below in the flicker experiments.
Figure 3.

Typical PO2 profiles as a function of retinal depth from one rat retina (Rat 117). Profiles were first recorded in dark adaptation. Then, light-adapted profiles were recorded during an illumination that was sufficient to saturate rod responses in the ERG. The choriocapillaris is located at 100% retinal depth, and 0% represents the interface between the retina and the vitreous. The PO2 profile in green was recorded in dark adaptation while the profile in orange was recorded in light adaptation. The solid black line is the model fit to the data obtained in dark adaptation, and the dashed black line is the model fit to the data obtained in light adaptation. The vitreous near the retina is indicated by negative percent retinal depth.
3.3 Outer retinal oxygenation: choroidal and minimum PO2
Two important characteristics of outer retinal oxygenation are choroidal PO2 (PC) and minimum PO2 (Pmin). Under dark-adapted conditions, PC was 47.0±7.7 mmHg and Pmin was 17.4±3.0 mmHg (mean ± SEM, n = 10 rats). Light adaptation did not significantly change PC (48.7±8.9 mmHg). However, it significantly increased Pmin to 29.9±5.3 mmHg compared to dark adaptation (p = 0.001, n = 10 rats). Table 1 summarizes the characteristics of oxygen distribution and consumption in the rat retina in dark and light.
Table 1.
Summary of characteristics of oxygen distribution and consumption in the dark- and light-adapted rat retina.
| Characteristics of Oxygen Distribution and Consumption | Dark | Light |
|---|---|---|
| Choroidal PO2 (PC, mmHg) | 47.0±7.7 | 48.7±8.9 |
| Minimum PO2 in outer retina (Pmin, mmHg) | 17.4±3.0 | 29.9±5.3 |
| Average PO2 across inner retina (PIR, mmHg) | 25.4±4.8 | 28.8±5.4 |
| Qav (ml•100 g−1•min−1) | 3.0±0.4 | 1.8±0.2 |
Mean ± SEM, n = 10 rats
3.4 Oxygen consumption in outer retina in dark and light adaptation
The oxygen consumption (Qav) for the avascular outer retina was calculated for each PO2 profile using the three layer one-dimensional diffusion model described in Materials and Methods. Qav was 3.0±0.4 ml•100 g−1•min−1 in dark adaptation. Light adaptation significantly reduced Qav to 1.8±0.2 ml•100 g−1•min−1, which is 60.2±4.1% of the dark-adapted value (p = 0.0002, n = 10).
Qav varied among animals. Figure 4A shows the distribution of Qav under dark and light adaptation. Each point on the graph represents the average Qav for one animal in light or dark adaptation. The regression lines show that Qav was dependent on choroidal PO2 (Figure 4B).
Figure 4.

Photoreceptor oxygen consumption (Qav) decreased in light adaptation and was dependent on choroidal PO2.
A. Qav in dark and light adaptation for each rat with lines connecting values from individual rats. (n = 10 rats)
B. Qav was dependent on choroidal PO2. Each data point is the averaged dark- or light-adapted value from each rat.
Both the choroidal and retinal circulations supply the oxygen consumed by the photoreceptors. The parameter values derived from the fitted diffusion equations were used to determine the contribution of each circulatory bed to the consumed oxygen. Equation 5 gives the percent oxygen supplied by the retinal circulation (Fr) (Linsenmeier and Braun, 1992).
| Equation 5 |
In the dark-adapted rat retina, the retinal circulation supplied 18.4±2.5% of the oxygen to the photoreceptors with the balance supplied by the choroidal circulation. Light adaptation reduced Fr to 6.5±6.9%. In light adaptation, Fr was negative for 4 of the 10 rats. In those rats, the retinal circulation did not provide any oxygen to the photoreceptors in the light, and some oxygen from the choroid diffused to the inner retina.
3.5 Inner retinal and vitreal oxygenation
The PO2 across the inner retina fluctuated, as shown in Figure 3, due to presence of the retinal circulation and the proximity of the electrode to blood vessels. Peaks in the PO2 profile originate from the retinal circulation, but the exact location of the retinal capillaries, arterioles, and venules are heterogeneous and cannot be definitively determined by oxygen microelectrodes. Instead, PIR was used to assess the oxygenation across the inner retina, which was 25.4±4.8 mmHg in dark adaptation and was not significantly different during light adaptation (28.8±5.4 mmHg, p = 0.1, n = 10). PIR was consistently lower than choroidal PO2 in all animals. PIR was also significantly lower than PO2 in the vitreous at 50 μm (35.6 ± 6.6 mmHg, p < 0.003) and 100 μm (36.0 ± 7.6 mmHg, p < 0.01) from the retinal surface, as measured from the same profiles used to determine PIR. These vitreal PO2 values were higher than those found in previous studies using rats (e.g. 24 mmHg (Zhang et al., 2003), 22.6 mmHg (Alder et al., 1991), and 21.5 mmHg (Yu et al., 1994)). However, in the latter study using microelectrodes, the intraretinal PO2 profiles showed that PO2 in the inner retina was lower than in the vitreous (Yu et al., 1994).
3.6 Oxygenation of inner retina under steady and flickering light
Experiments, in which PO2 was recorded under steady and flickering light, indicated that local PO2 in the inner retina normally decreased with light. When the electrode remained stationary in the inner retina, light consistently decreased PO2. Figure 5A shows an example of inner retinal PO2 under steady and flickering light from Rat 132. Steady light decreased PO2 by 0.44±0.22 mmHg compared to 1.33±0.21 mmHg during 6 Hz flickering light (n = 5, p < 0.03), shown in Figure 5B. Steady and flickering light had equivalent mean illumination, which was an attenuation of 3 log units or more from the maximum available from the stimulator. ΔPO2 did not appear to be dependent on light attenuation at this flicker frequency.
Figure 5.

PO2 was recorded within the inner retina while the electrode was held stationary. Illumination is given as log units of light attenuation from the maximum.
A. Representative examples of inner retinal PO2 in response to steady light (red) and 6 Hz flicker at 3.5 log units of attenuation (blue), from Rat 132. Light was turned on at 30 seconds and turned off at 80 seconds. The electrode was positioned at approximately 9% retinal depth.
B. Changes in inner retinal PO2 (mmHg) in response to steady and 6 Hz flickering light. Illumination was 3 log units of attenuation or more from the maximum available. (n = 5 rats, mean ± SEM, * p < 0.03)
4. Discussion
4.1 Dark and light adaptation in the rat retina
This study is the first to simultaneously measure PO2 and voltage in the rat retina, and assess the position of the electrode and the condition of the retina during PO2 recordings. The b- and c-waves of the intraretinal ERG had comparable amplitudes and changed with depth in a manner similar to the cat retina (Brown and Wiesel, 1961), which was expected since both rat and cat retina are strongly rod dominated.
These studies characterized the effects of dark and light adaptation on oxygenation of the rat retina. Qav in rat outer retina was comparable to Qav previously found in cat (Table 2). However, Qav in the present study was higher than previously reported for rat retina in vivo in dark adaptation, 3.0±0.4 ml•100 g−1•min−1 versus 1.96±0.14 ml•100 g−1•min−1 (Cringle et al., 2002). Several factors may explain this discrepancy. First, Cringle et al. determined that the retinal thickness was 280 μm based on the track distances of their profiles and assumed the outer retina was 40% of total retinal thickness (Cringle et al., 2002), which makes the outer retina approximately 112 μm thick. They also assumed the electrode penetrated the retina at 30° from perpendicular. In this study, we could not precisely measure the penetration angle. Therefore, we instead normalized the length of the outer retina to 85 μm based on histological measurements of photoreceptor length (Feng et al., 2007). If the value from Cringle et al. is adjusted so that the outer retina has a length of 85 μm and occupies 50% of the retina, it becomes 2.58 ml•100 g−1•min−1. This value is lower than but comparable to Qav found in this study. In an in vitro study, photoreceptor QO2 during dark adaptation was determined in Long-Evans rats by subtracting inner retinal consumption from whole retinal consumption by pharmacologically inhibiting the outer retina and was calculated to be 3.7 ml•100 g−1•min−1 (Medrano and Fox, 1995).
Table 2.
Characteristics of oxygen distribution and consumption in dark-adapted rat and cat retina.
| Characteristics of Oxygen Distribution and Consumption | Rat | Cat* | Measured (M) or derived (D) | |
|---|---|---|---|---|
| L1 (μm) | 33.0±1.8 | 34.0±1.4 | p > 0.06 | D |
| L2 (μm) | 45.5±2.5 | 53.5±1.5 | p < 0.01 | D |
| Inner segment thickness, L2-L1 (μm) | 12.5±1.7 | 19.6±1.1 | p < 0.002 | D |
| Choroidal PO2 (mmHg) | 47.0±7.7 | 47.0±3.1 | p > 0.9 | D |
| Minimum PO2 in inner segments (mmHg) | 17.4±3.0 | 3.4±0.4 | p < 0.001 | M |
| PO2 at L (mmHg) | 22.8±3.2 | 8.5±0.8 | p < 0.001 | D |
| Average inner retinal PO2 (mmHg) | 25.4±4.8 | 15.6±1.1 | p < 0.007 | M |
| Q2 (ml•100 g−1•min−1) | 23.2±3.6 | 23.5±2.5 | p > 0.9 | D |
| Qav (ml•100 g−1•min−1) | 3.0±0.4 | 3.5±0.3 | p > 0.4 | D |
| Fraction of O2 consumed by photoreceptors supplied by retinal circulation | 18.4±2.5% | 9.8±1.3% | p < 0.003 | D |
| Number of animals | 10 | 28 |
Mean ± SEM.
Cat data from profiles recorded in normoxia (Braun et al., 1995; Padnick-Silver and Linsenmeier, 2003; Wang and Linsenmeier, 2007). In bold: significantly different between rat and cat (unpaired Student’s t-test).
As expected, light adaptation decreased oxygen consumption and increased minimum PO2 in the outer retina compared to dark adaptation, as is true for all vertebrates (Birol et al., 2007; Braun et al., 1995; Cringle et al., 2002; Kimble et al., 1980; Linsenmeier and Braun, 1992; Wang et al., 1997). Whereas calculating absolute values of QO2 introduces potential measurement errors, comparing the ratio of QO2 under light vs. dark adaptation produces more consistent results since those measurement errors cancel. QO2 is graded with illumination, but modest amounts of light below standard room illumination can maximally reduce QO2 of the photoreceptors (Linsenmeier, 1986; Wang et al., 2010). Previous studies did not always report the illumination used, but they likely obtained maximum light-evoked reductions in QO2. The magnitude of the light-evoked reduction in Qav in the Long-Evans rats studied here (Qav, light/Qav, dark = 0.60) was comparable to the effect found in other studies on rats (0.66 (Yu and Cringle, 2002) 0.68 (Cringle et al., 2002) and 0.63 (Medrano and Fox, 1995)). The light-evoked decrease in Qav in rat is less than in cat (0.33 (Linsenmeier and Braun, 1992), 0.36 (Braun et al., 1995) and 0.51 (Braun and Linsenmeier, 1995)) and greater than in monkey (0.72 (Birol et al., 2007) and 0.75 (Ahmed et al., 1993).
In cat (Linsenmeier and Braun, 1992), monkey (Birol et al., 2007), and rat, Qav in the dark depends on PC. The explanation for this dependence in cat was that, since Pmin was already very low, decreases in PC reduced the oxygen gradient from the choroid to the photoreceptors, making the oxygen supply insufficient and thereby decreasing Qav. In cat, Qav did not depend on PC during light adaptation, since Pmin was sufficiently above zero that it could decrease with decreasing PC to maintain the oxygen gradient. However, Pmin during dark adaptation is much higher in rat than in cat. Therefore, the choroidal oxygen supply should not be limiting in rat in darkness, and Qav is not expected to depend on PC, like the light-adapted cat retina. The dependence of dark-adapted Qav on PC in rat is therefore puzzling. Further, in both rat and monkey, Qav also depends on PC during light adaptation, where choroidal oxygen supply should not be limiting. Thus, at this time there is no good explanation for the dependence of Qav on PC in darkness in rat, or the difference between cat versus rat and monkey in light adaptation.
4.2 Flickering light
In the brain, the vascular supply responds to changes in local neural activity and metabolism in a process known as neurovascular coupling (see (Girouard and Iadecola, 2006) for a review). Neural activation increases oxygen, glucose, and ATP consumption as well as neurotransmitter release. These increases directly and indirectly lead to vasodilation via vasoactive agents including NO, K+, CO2, adenosine, and neurotransmitters (Girouard and Iadecola, 2006). Neurovascular coupling also occurs in the retina. Flickering light increases retinal blood vessel diameter and retinal blood flow in the optic nerve and in the retinal vessels (Mishra et al., 2011; Riva et al., 2005). It is currently unknown which cell type consumes the most oxygen in the inner retina. However, ganglion cells increase their firing activity under flickering light (Lee et al., 1989) and are likely to increase their oxygen consumption as a result. Inner retinal glucose uptake is known to be higher during flicker than during steady illumination in monkey retina (Bill and Sperber, 1990). Increased oxygen consumption is expected to decrease PO2, while the corresponding blood flow response from the retinal circulation would either stabilize or increase PO2. Thus, changes to the inner retinal PO2 in response to flickering light show the net effect of these changes.
Flickering light decreased inner retinal PO2 by a small but measurable amount. A similar change was also found at the surface of the optic nerve head (Buerk et al., 1998; Riva et al., 2005). ΔPO2 was significantly larger during 6 Hz flicker than during steady light with an equivalent illumination. As expected from the convergence of retinal signals at the ganglion cell, a low illumination was sufficient to evoke the change in PO2 during flicker. Decreased PO2 during flicker suggests that increased blood flow in the retinal circulation did not completely compensate for the light-induced increase in oxygen consumption.
4.3 Comparison of rat and cat retinal oxygenation
The availability of experimentally measured and model-derived characteristics of rat retinal oxygenation allowed a quantitative comparison with cat retinal oxygenation, as summarized in Table 2. The cat characteristics were aggregated from data collected in three previous studies (n = 28 cats) (Braun and Linsenmeier, 1995; Padnick-Silver and Linsenmeier, 2003; Wang and Linsenmeier, 2007). The values for cat were reanalyzed to express QO2, L1, and L2 uniformly on the basis of a total photoreceptor length of 100 μm, thus some values are not the same as reported in the original papers. The modeled choroidal PO2, which closely matched the measured choroidal PO2, was 47.0 mmHg for both rat and cat. Qav was also comparable for both animals, although it was slightly lower in rat. While choroidal PO2 and Qav were similar in the rat and cat retina, several other characteristics were different in the two species. First, the measured thickness of the retina obtained from PO2 profiles was smaller in rat than in cat, 206±4.9 μm versus 241±4.6 μm. These values were corrected for the angle between the electrode penetration and the retinal surface, which was assumed to be 45 degrees in cat and 30 degrees in rat. As noted in Materials and Methods, a correction was also included for any distortion caused by electrode drag on the retina during withdrawal. Second, the model-derived length of the oxygen consuming region, the inner segments, of the rat retina is smaller than in the cat retina, 12.5 μm versus 19.6 μm. Third, the minimum PO2 in rat inner segments is higher than in cat inner segments. Finally, the oxygenation of the rat inner retina is also different from the cat inner retina. Both PO2 at L, the boundary between inner and outer retina, and the average inner retinal PO2 (PIR) are higher in rat than in cat.
As noted in this study and previous studies (Cringle et al., 2002; Yu and Cringle, 2002), the dark-adapted rat retina has a higher minimum PO2 than cat (Braun and Linsenmeier, 1995; Padnick-Silver and Linsenmeier, 2003; Wang and Linsenmeier, 2007). The data for primate are less extensive but show that monkey is similar to cat. Minimum PO2 might be assumed to be higher in the rat outer retina because it has lower oxygen consumption. However, Qav and Q2 are comparable between rat and cat. Therefore, Qav alone does not explain why rat minimum PO2 is higher.
In addition to oxygen consumption, several other parameters could account for the differences between rat and cat outer retinal oxygenation, and simulations were performed to determine which parameters were key factors (Figure 6). The parameters varied in the simulations were L, L1, L2, PC, PL, and Qav, and the values are given in Table 2. In Figure 6, the red traces show the simulation for cat, and the blue traces are for rat, illustrating the difference in Pmin between the two species. We then varied the rat model parameters to identify which ones affect Pmin. First, the overall length of the outer retina (L) is shorter in rat than cat by 15 μm. Therefore, the distance oxygen needs to diffuse from the sources is expected to be shorter in rat than cat. However, adjusting L in the rat model, while keeping all other parameters constant, only decreased the minimum PO2 in the inner segments by 1 mmHg (Figure 6A).
Figure 6.

Simulations of average outer retinal PO2 profiles in rat from parameters given in Table 2, compared to simulated profiles from cat. In each section of the figure, the PO2 profile in rat (blue) and cat (red) are shown.
A. The length of rat photoreceptors is shorter than in cat. Modifying L in the rat model so that it is the same as in the cat decreased Pmin by 1 mmHg in the rat simulation (green).
B. Modifying L1 and L2 in the rat model so that they were the same as in the cat model decreased Pmin to 6.4 mmHg (green).
C. Changing Fr, the percent oxygen supplied by the retinal circulation to the photoreceptors, in the rat model so that it is the same as in the cat model changed PL to 12.1 mmHg. By modifying L1, L2, and PL in the rat model, Pmin approached zero (green).
Although L is different in the two species, the boundary of the consuming region closest to the choroid (L1), is approximately in the same location in both rat and cat retinas, at 33.0 μm and 34.0 μm from the choroid respectively. Thus, the distance oxygen needs to diffuse from the choroid to the inner segments is approximately the same for both species. In contrast, L2, the boundary of the consuming region closest to the inner retina, is at 45.5 μm from the choroid in rat compared to 53.5 μm in cat. As a result, the oxygen consuming region is smaller and occupies a smaller fraction of the outer retina in rat than cat, 14.7% compared to 19.5%. Adjusting the rat model so that L1 and L2 are the same as in cat, while keeping all other parameters constant, decreased minimum PO2 in the inner segments to 6.4 mmHg (Figure 6B).
However, adjusting the length of the inner segments (L1 and L2) alone did not reduce minimum PO2 in the rat retina to zero, as in the cat model. An additional factor influencing Pmin is that rat photoreceptors receive almost twice as much of their oxygen from the retinal circulation than cat photoreceptors, 18.4% versus 9.8%. Adjusting the rat model (by adjusting Fr) so that it gets 9.8% of consumed oxygen from the retinal circulation changes PL to 12.1 mmHg. Modifying L1, L2, as well as PL in the rat model brings the minimum PO2 to 0.3 mmHg (Figure 6C). In summary, the major factors affecting oxygenation in the outer retina are the size of the oxygen-consuming region (length of the inner segments) and the fraction of oxygen supplied from the inner retina (Fr and PL).
The structure and function of the retina is highly conserved between species. However, small anatomical differences in the rat retina result in differences in its intraretinal oxygen profile when compared to the cat retina. The Long-Evans rat has a retinal thickness of approximately 170 μm (Feng et al., 2007), which is thinner than the cat retina with a retinal thickness of 200 μm (Vogel, 1978). In addition to being thinner overall, the oxygen consuming region of the outer retina, the inner segments of the photoreceptors, is also smaller in the rat than in the cat.
The foregoing analysis assumed that the rat photoreceptors were 85 μm long, a value from histology, while recent in vivo measurements (Berkowitz et al., 2011) suggest a length of 100 μm for Long-Evans rat photoreceptors. However, both Feng et al. and Berkowitz et al. showed that retinal thickness decreased with age, and the rats used for this study were closer in age to the rats in the study by Feng et al. Nevertheless, if we adjust the rat model to a basis of 100 μm long photoreceptors, all the conclusions about differences between cat and rat discussed above still hold.
The oxygen distribution and consumption in the inner retina may also vary between species. At the same arterial PO2 and under the same anesthetic, rat has a higher average inner retinal PO2 than cat. However, oxygen consumption in the normal inner retina cannot be quantified in vivo using oxygen microelectrodes because data are collected in one dimension and this is a three dimensional problem. No technique is currently available to model oxygen consumption in the normal inner retina in vivo, although other researchers have reported oxygen consumption values based on an eight-layer model of oxygenation for the entire retina (Yu and Cringle, 2001). The validity of this model is questionable because it applies the one-dimensional diffusion equation to solve for three-dimensional oxygen diffusion in the inner retina.
Conclusion
The primary motivations for this study were to evaluate oxygenation of the pigmented retina in dark and light and to determine why rat intraretinal PO2 profiles looked different from cat profiles, specifically why Pmin in rat retina appeared to be higher than in cat. We found that the profiles in pigmented rats looked very much like those previously reported in albino rats. After analysis of the model parameters, we found that the higher Pmin in rat retina than in cat retina is caused by differences in the length of the inner segments, which affects the size of the oxygen consuming region, and the fraction of oxygen supplied to the photoreceptors by the retinal circulation. Nevertheless, no difference exists between rat and cat in photoreceptor oxygen consumption per gram of retina or the supply of oxygen from the choroid as indicated by choroidal PO2. A subsidiary objective of this work was to evaluate the effect of light on inner retinal PO2. We found that steady illumination decreased PO2 by a small amount, and that flicker significantly decreased inner retinal PO2 further.
Highlights.
We recorded PO2 depth profiles from Long-Evans rat retinas using microelectrodes
We evaluated O2 distribution and consumption during dark and light adaptation
Rat outer retina has smaller oxygen consuming region than cat outer retina
Rods in rat receive twice as much O2 from the retinal circulation as in cat
Both steady and flickering light decreased local inner retinal PO2
Acknowledgments
This study was funded in part by NEI Training Grant T32 EY007128 and NEI Grant R01 EY021165.
Footnotes
Publisher's Disclaimer: This is a PDF file of an unedited manuscript that has been accepted for publication. As a service to our customers we are providing this early version of the manuscript. The manuscript will undergo copyediting, typesetting, and review of the resulting proof before it is published in its final citable form. Please note that during the production process errors may be discovered which could affect the content, and all legal disclaimers that apply to the journal pertain.
References
- Ahmed J, Braun RD, Dunn R, Jr, Linsenmeier RA. Oxygen distribution in the macaque retina. Invest Ophthalmol Vis Sci. 1993;34:516–521. [PubMed] [Google Scholar]
- Alder VA, Yu DY, Cringle SJ. Vitreal oxygen tension measurements in the rat eye. Exp Eye Res. 1991;52:293–299. doi: 10.1016/0014-4835(91)90093-t. [DOI] [PubMed] [Google Scholar]
- Barnett V, Lewis T. Outliers in Statistical Data. John Wiley & Sons; New York: 1978. [Google Scholar]
- Berkowitz BA, Bissig D, Bergman D, Bercea E, Kasturi VK, Roberts R. Intraretinal calcium channels and retinal morbidity in experimental retinopathy of prematurity. Mol Vis. 2011;17:2516–2526. [PMC free article] [PubMed] [Google Scholar]
- Bill A, Sperber GO. Aspects of oxygen and glucose consumption in the retina: effects of high intraocular pressure and light. Graefes Arch Clin Exp Ophthalmol. 1990;228:124–127. doi: 10.1007/BF00935720. [DOI] [PubMed] [Google Scholar]
- Birol G, Wang S, Budzynski E, Wangsa-Wirawan ND, Linsenmeier RA. Oxygen distribution and consumption in the macaque retina. Am J Physiol Heart Circ Physiol. 2007;293:H1696–1704. doi: 10.1152/ajpheart.00221.2007. [DOI] [PubMed] [Google Scholar]
- Braun RD, Linsenmeier RA. Retinal oxygen tension and the electroretinogram during arterial occlusion in the cat. Invest Ophthalmol Vis Sci. 1995;36:523–541. [PubMed] [Google Scholar]
- Braun RD, Linsenmeier RA, Goldstick TK. Oxygen consumption in the inner and outer retina of the cat. Invest Ophthalmol Vis Sci. 1995;36:542–554. [PubMed] [Google Scholar]
- Brown KT, Wiesel TN. Analysis of the intraretinal electroretinogram in the intact cat eye. J Physiol. 1961;158:229–256. doi: 10.1113/jphysiol.1961.sp006767. [DOI] [PMC free article] [PubMed] [Google Scholar]
- Buerk DG, Atochin DN, Riva CE. Simultaneous tissue PO2, nitric oxide, and laser Doppler blood flow measurements during neuronal activation of optic nerve. Adv Exp Med Biol. 1998;454:159–164. doi: 10.1007/978-1-4615-4863-8_19. [DOI] [PubMed] [Google Scholar]
- Cringle S, Yu DY, Alder V, Su EN. Oxygen tension and blood flow in the retina of normal and diabetic rats. Adv Exp Med Biol. 1992a;317:787–791. doi: 10.1007/978-1-4615-3428-0_96. [DOI] [PubMed] [Google Scholar]
- Cringle SJ, Yu DY, Alder VA. Intraretinal oxygen tension in the rat eye. Graefes Arch Clin Exp Ophthalmol. 1991;229:574–577. doi: 10.1007/BF00203324. [DOI] [PubMed] [Google Scholar]
- Cringle SJ, Yu DY, Alder VA. Intravitreal and intraretinal oxygen tension in the rat eye. Adv Exp Med Biol. 1992b;316:113–117. doi: 10.1007/978-1-4615-3404-4_12. [DOI] [PubMed] [Google Scholar]
- Cringle SJ, Yu DY, Yu PK, Su EN. Intraretinal oxygen consumption in the rat in vivo. Invest Ophthalmol Vis Sci. 2002;43:1922–1927. [PubMed] [Google Scholar]
- Cringle SJ, Yu PK, Su EN, Yu DY. Oxygen distribution and consumption in the developing rat retina. Invest Ophthalmol Vis Sci. 2006;47:4072–4076. doi: 10.1167/iovs.05-1638. [DOI] [PubMed] [Google Scholar]
- Feng L, Sun Z, Han H, Zhou Y, Zhang M. No age-related cell loss in three retinal nuclear layers of the Long-Evans rat. Vis Neurosci. 2007;24:799–803. doi: 10.1017/S0952523807070721. [DOI] [PubMed] [Google Scholar]
- Girouard H, Iadecola C. Neurovascular coupling in the normal brain and in hypertension, stroke, and Alzheimer disease. J Appl Physiol. 2006;100:328–335. doi: 10.1152/japplphysiol.00966.2005. [DOI] [PubMed] [Google Scholar]
- Hastings C, Mosteller F, Tukey JW, Winsor CP. Low Moments for Small Samples: A Comparative Study of Order Statistics. Annals of Mathematical Statistics. 1947;18:413–426. [Google Scholar]
- Haugh LM, Linsenmeier RA, Goldstick TK. Mathematical models of the spatial distribution of retinal oxygen tension and consumption, including changes upon illumination. Ann Biomed Eng. 1990;18:19–36. doi: 10.1007/BF02368415. [DOI] [PubMed] [Google Scholar]
- Kimble EA, Svoboda RA, Ostroy SE. Oxygen consumption and ATP changes of the vertebrate photoreceptor. Exp Eye Res. 1980;31:271–288. doi: 10.1016/s0014-4835(80)80037-6. [DOI] [PubMed] [Google Scholar]
- Lee BB, Martin PR, Valberg A. Sensitivity of macaque retinal ganglion cells to chromatic and luminance flicker. The Journal of Physiology. 1989;414:223–243. doi: 10.1113/jphysiol.1989.sp017685. [DOI] [PMC free article] [PubMed] [Google Scholar]
- Linsenmeier RA. Effects of light and darkness on oxygen distribution and consumption in the cat retina. J Gen Physiol. 1986;88:521–542. doi: 10.1085/jgp.88.4.521. [DOI] [PMC free article] [PubMed] [Google Scholar]
- Linsenmeier RA, Braun RD. Oxygen distribution and consumption in the cat retina during normoxia and hypoxemia. J Gen Physiol. 1992;99:177–197. doi: 10.1085/jgp.99.2.177. [DOI] [PMC free article] [PubMed] [Google Scholar]
- Linsenmeier RA, Yancey CM. Improved fabrication of double-barreled recessed cathode O2 microelectrodes. J Appl Physiol. 1987;63:2554–2557. doi: 10.1152/jappl.1987.63.6.2554. [DOI] [PubMed] [Google Scholar]
- Medrano CJ, Fox DA. Oxygen consumption in the rat outer and inner retina: light- and pharmacologically-induced inhibition. Exp Eye Res. 1995;61:273–284. doi: 10.1016/s0014-4835(05)80122-8. [DOI] [PubMed] [Google Scholar]
- Mishra A, Hamid A, Newman EA. Oxygen modulation of neurovascular coupling in the retina. Proceedings of the National Academy of Sciences. 2011;108:17827–17831. doi: 10.1073/pnas.1110533108. [DOI] [PMC free article] [PubMed] [Google Scholar]
- Padnick-Silver L, Linsenmeier RA. Effect of acute hyperglycemia on oxygen and oxidative metabolism in the intact cat retina. Invest Ophthalmol Vis Sci. 2003;44:745–750. doi: 10.1167/iovs.02-0432. [DOI] [PubMed] [Google Scholar]
- Riva CE, Logean E, Falsini B. Visually evoked hemodynamical response and assessment of neurovascular coupling in the optic nerve and retina. Prog Retin Eye Res. 2005;24:183–215. doi: 10.1016/j.preteyeres.2004.07.002. [DOI] [PubMed] [Google Scholar]
- Takahashi GH, Fatt I, Goldstick TK. Oxygen consumption rate of tissue measured by a micropolarographic method. J Gen Physiol. 1966;50:317–335. doi: 10.1085/jgp.50.2.317. [DOI] [PMC free article] [PubMed] [Google Scholar]
- Vogel M. Postnatal development of the cat’s retina: a concept of maturation obtained by qualitative and quantitative examinations. Albrecht Von Graefes Arch Klin Exp Ophthalmol. 1978;208:93–107. doi: 10.1007/BF00406985. [DOI] [PubMed] [Google Scholar]
- Wang L, Tornquist P, Bill A. Glucose metabolism in pig outer retina in light and darkness. Acta Physiol Scand. 1997;160:75–81. doi: 10.1046/j.1365-201X.1997.00030.x. [DOI] [PubMed] [Google Scholar]
- Wang S, Linsenmeier RA. Hyperoxia improves oxygen consumption in the detached feline retina. Invest Ophthalmol Vis Sci. 2007;48:1335–1341. doi: 10.1167/iovs.06-0842. [DOI] [PubMed] [Google Scholar]
- Wang SF, Birol G, Budzynski E, Flynn R, Linsenmeier RA. Metabolic Responses to Light in Monkey Photoreceptors. Curr Eye Res. 2010;35:510–518. doi: 10.3109/02713681003597255. [DOI] [PMC free article] [PubMed] [Google Scholar]
- Yu DY, Alder VA, Cringle SJ, Su EN, Burns M. Intraretinal oxygen distribution in urethan-induced retinopathy in rats. Am J Physiol. 1998;274:H2009–2017. doi: 10.1152/ajpheart.1998.274.6.H2009. [DOI] [PubMed] [Google Scholar]
- Yu DY, Cringle SJ. Oxygen distribution and consumption within the retina in vascularised and avascular retinas and in animal models of retinal disease. Prog Retin Eye Res. 2001;20:175–208. doi: 10.1016/s1350-9462(00)00027-6. [DOI] [PubMed] [Google Scholar]
- Yu DY, Cringle SJ. Outer retinal anoxia during dark adaptation is not a general property of mammalian retinas. Comp Biochem Physiol A Mol Integr Physiol. 2002;132:47–52. doi: 10.1016/s1095-6433(01)00528-1. [DOI] [PubMed] [Google Scholar]
- Yu DY, Cringle SJ, Alder V, Su EN. Intraretinal oxygen distribution in the rat with graded systemic hyperoxia and hypercapnia. Invest Ophthalmol Vis Sci. 1999;40:2082–2087. [PubMed] [Google Scholar]
- Yu DY, Cringle SJ, Alder VA, Su EN. Intraretinal oxygen distribution in rats as a function of systemic blood pressure. Am J Physiol. 1994;267:H2498–2507. doi: 10.1152/ajpheart.1994.267.6.H2498. [DOI] [PubMed] [Google Scholar]
- Yu DY, Cringle SJ, Su EN, Yu PK. Intraretinal oxygen levels before and after photoreceptor loss in the RCS rat. Invest Ophthalmol Vis Sci. 2000;41:3999–4006. [PubMed] [Google Scholar]
- Zhang W, Ito Y, Berlin E, Roberts R, Berkowitz BA. Role of hypoxia during normal retinal vessel development and in experimental retinopathy of prematurity. Invest Ophthalmol Vis Sci. 2003;44:3119–3123. doi: 10.1167/iovs.02-1122. [DOI] [PubMed] [Google Scholar]