

Abstract
Heparan sulfate (HS) glycosaminoglycans (GAGs) regulate a host of biological functions. To better understand their biological roles, it is necessary to gain understanding about the structure of HS, which requires identification of the sulfation pattern as well as the uronic acid epimerization. In order to model HS structure, it is necessary to quantitatively profile depolymerization products. To date, liquid chromatography-mass spectrometry (LC-MS) methods for profiling heparin lyase decomposition products have been shown. These enzymes, however, destroy information about uronic acid epimerization. Deaminative cleavage using nitrous acid (HONO) is a classic method for GAG depolymerization that retains uronic acid epimerization. Several chromatographic methods have been used for analysis of deaminative cleavage products. The chromatographic methods have the disadvantage that there is no direct readout on the structures producing the observed peaks. This report demonstrates a porous graphitized carbon (PGC)-MS method for the quantification of HONO generated disaccharides to obtain information about the sulfation pattern and uronic acid epimerization. Here we demonstrate the separation and identification of uronic acid epimers as well as geometric sulfation isomers. The results are comparable to those expected for benchmark HS and heparin samples. The data demonstrate the utility of PGC-MS for quantification of HS nitrous acid depolymerization products for structural analysis of HS and heparin.
Introduction
Heparan sulfate (HS) and heparin glycosaminoglycans (GAGs) have been identified as key players in several physiological and pathophysiological processes.1–4 These GAGs are structurally related linear polysaccharides. They are biosynthesized as repeating units of glucuronic acid and N-acetyl-glucosamine, [4-GlcAβ-1,4-GlcNAcα1-]n.5 The nascent chains are modified through a series of enzymatic reactions initiated by N-deacetylation and N-sulfation of GlcNAc residues, followed by epimerization of some D-glucuronic acid to L-iduronic acid (IdoA) and subsequent sulfation at the C2 position. In the mature chains, GlcN units may be N-acetylated (GlcNAc), N-sulfated (GlcNS), or (rarely) unsubstituted (GlcN), and may be sulfated at the C6 and, rarely, C3 positions. Because of these modifications, HS and heparin chains are comprised of disaccharide units with unique patterns of N-acetylation, N-sulfation, O-sulfation, and uronosyl epimerization. Mature chains have domains of high content of IdoA and sulfation, interspersed with unmodified domains and those of intermediate sulfation. The expression of HS is required for embryogenesis and for normal functioning of every adult physiological system.6,7 Although the biological roles of HS and heparin are highly diverse, it has been shown that their functions depend largely upon the proteins to which they interact as determined by the HS chain structures.8–10 For example, binding is dependent on either 2-O- or 6-O-sulfation patterns for FGF signaling in Drosophila tracheal development.8 The binding region for lipoprotein lipase in endothelial cell HS is composed of five consecutive N- and 2,6-di-O-sulfated disaccharide repeats.10
Structural analysis of HS and heparin is necessary to determine their biological activities, but experiments have been limited by the extreme heterogeneity in their composition, sulfation, acetylation, and epimerization patterns. Many methods focus on enzymatic depolymerization of HS and heparin followed by disaccharide analysis using liquid chromatography (LC)11, capillary electrophoresis (CE)12, MS13, CE-MS14, or LC-MS15,16. However, the enzymatic digestion cleaves glycosidic GlcN-HexA bonds, resulting in loss of asymmetry at C5 of the original uronic acid because of the generation of unsaturated bonds between C4 and C5.
An alternative method of depolymerization is hydrazinolysis followed by HONO treatment. The deacetylation and deaminative cleavage results in disaccharide units composed of uronic acid (GlcA or IdoA) and 2,5-anhydromannose (aMan) bearing an aldehyde group.17,18 The advantage of this classic method for GAG depolymerization is that the original epimeric nature of the uronic acid is retained. The resulting disaccharides have been analyzed by paper electrophoresis or chromatography16 and anion exchange HPLC19 after reduction with NaB3H4, ion pair reverse phase LC (IPRP-LC) after coupling with paranitrophenyl-hydrazine20, and IPRP-LC-MS after reduction with NaBH421.
Recently, a bioinformatics algorithm, ChamP, has been developed to model HS chain structure based on compositional analysis data.22 This algorithm requires disaccharide compositional profiles from both lyase digested and deaminative cleavage methods. However, in order to correctly model HS structure from compositional analysis data, effective means of analysis of deaminative cleavage products have to be used. As shown by Kuberan’s group21, IPRP-LC-MS is useful for estimating C5-epimerase activity by resolving GlcA from IdoA containing HONO disaccharides. Complete LC-MS analysis of all products from deaminative cleavage is desirable because the MS dimension provides direct validation to all chromatographic peaks. Another major advantage of LC-MS is that use of tandem MS provides structural information on peak identities. Porous graphitized carbon (PGC) chromatography is well suited for the separation of all HONO-derived product disaccharides (dp2). The high isomeric resolving power23–26 of graphitized carbon avoids the use of derivatization, which can be time consuming, costly, and usually decreases the sensitivity of analysis. The use of salts or amine ion pairs in the mobile phase is not necessary, making PGC well suited for interface with mass spectrometry. This approach has been applied successfully to glycan classes including O-linked, N-linked, and GAGs.27,28 PGC-LC-MS under negative ionization conditions has been applied to the analysis of enzymatically derived-dp2s from hyaluronan, keratan sulfate, chondroitin sulfate, heparin and HS.29,30 To date, an LC-MS method for quantification of all deaminative cleavage products of HS has not been described. This work shows PGC-LC-MS for analysis of the complete range of HONO generated disaccharides to obtain information about the sulfation pattern and uronic acid epimerization. Effort was made to validate the identifications of all disaccharide peaks using advanced tandem mass spectrometry.
Experimental Section
Hydrazinolysis and Nitrous Acid (HONO) Depolymerization
Intact polysaccharides were deacetylated and depolymerized according to Guo and Conrad18. Details are in the Supporting Information.
Enzymatic Digestion
HS from bovine kidney (HSBK) and porcine intestinal mucosa (HSPIM) as well as heparin were digested as previously described.14 Details are in the Supporting Information.
Chemical O-Desulfation
6-O-desulfated disaccharides were prepared according to Takano et al.31 2-O-desulfated disaccharides were prepared according to Jaseja et al.32 Details are in the Supporting Information.
Exoglycosidase Digestion
The HONO-derived dp2s (1 μg) were treated with the exoenzymes at 37 °C for 2–24 hours in a final volume of 20 μL of 50 mM sodium acetate buffer, pH 4.5, containing 100 μg/mL bovine serum albumin (BSA). Final enzyme concentration for effective complete digestion was 500 milliunits/mL. Enzyme digests were terminated by heating the solutions at 100 °C for 5 min.
Liquid Chromatography/Mass Spectrometry
The PGC column (Hypercarb Column, 5 um, 150 mm × 4.6 mm) was purchased from Thermo Electron Corporation (Waltham, MA). The SEC column (Superdex™ peptide PC 3.2/30) was purchased from GE Healthcare (Piscataway, NJ). The samples were separated using a Waters Acquity Ultra Performance LC system (Milford, MA). Disaccharides eluting from the LC column were analyzed using an Applied Biosystems QSTAR Pulsar-I (Q-TOF) mass spectrometer (Carlsbad, CA) operating in negative ion mode. Solvents, gradients, and MS conditions used are described in detail in the Supporting Information.
Tandem Mass Spectrometry
All tandem mass spectra were obtained using a 12 Tesla Fourier transform ion cyclotron resonance (FT-ICR) mass spectrometer (SolariX, Bruker Daltonics, Billerica, MA) operated in negative ion mode. MS parameters used for the electron detachment dissociation (EDD) and electron capture dissociation (ECD) are described in the Supporting Information.
Results and Discussion
Separation of HONO-Derived Disaccharides
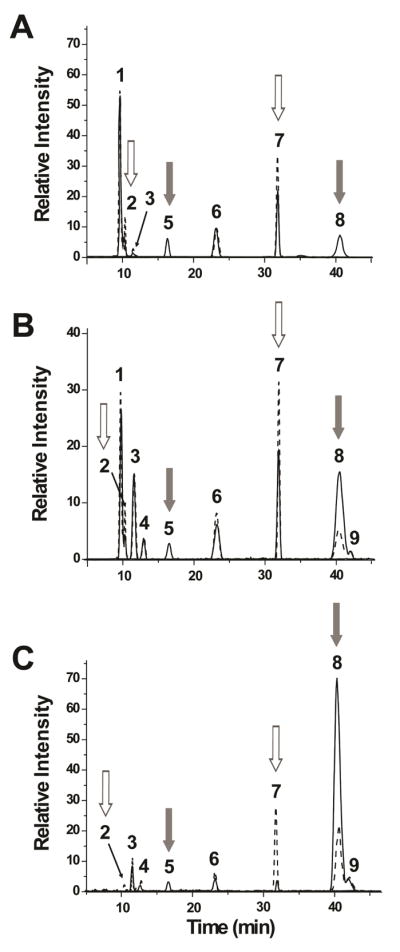
Samples of HS and heparin were subjected to N-deacetylation by hydrazinolysis and deaminative cleavage by nitrous acid. These conditions led to cleavage at GlcN as well as GlcNS units, resulting in depolymerization to HexA-2,5-anhydromannose (HexA-aMan) disaccharide units for completely N-deacetylated HS chains (structures are shown in Supporting Information Figure S-1 and the nitrous acid reaction in S-2). Reduction of the products with NaBH4 followed by SEC-MS revealed the presence of a low abundance of tetrasaccharides (<10% of the total products) in addition to disaccharides. These tetrasaccharides are due primarily to a side reaction of deaminative ring contraction.33 Disaccharides consistently accounted for >90% of the total products and are considered to reflect the overall composition of the HS and heparin samples. The structures of these HONO-derived dp2s are shown in the Supporting Information Figure S-3. Extracted ion chromatograms (EIC) for the non-sulfated (m/z 339), mono-sulfated (m/z 419), and di-sulfated (m/z 499) HexA-aManR disaccharides derived from HONO treatment of HS from bovine kidney (HSBK), porcine intestinal mucosa (HSPIM), and heparin separated by PGC are shown in Figure 1. A peak corresponding to loss of sulfate was observed for the di-sulfated disaccharide. Note that HSBK as well as other HS samples (see Supporting Information Figure S-4) do not exhibit peaks 4 and 9. This suggests that these peaks are specific to heparinoids from porcine intestinal mucosa. Mass spectra for each HONO-derived disaccharide from HSPIM are shown in Supporting Figure S-5. A peak was observed for each disaccharide [M-H]− ion. Low abundance peaks corresponding to loss of SO3 were also observed in the mass spectra of the di-sulfated disaccharides (peaks 8 and 9). The relative quantities of the nine chromatographically separated HexA-aManR disaccharides extracted from the PGC-MS data are summarized in Supplemental Information Table S-1. The identities of these peaks will be discussed in subsequent sections. HSPIM and heparin yielded predominantly di-sulfated disaccharides. This is expected as the N- and 2,6-di-O-sulfated structure, IdoA(2S)-GlcNS(6S)R is generally the most abundant disaccharide unit in heparin preparations.34 In contrast, HSBK generated more abundant non-sulfated HexA-aManR dp2s.
Figure 1.

Extracted ion chromatograms of HONO-derived dp2s analyzed by PGC-MS from (A) HSBK, (B) HSPIM, and (C) heparin. Peaks 1 and 2 are non-sulfated, peaks 3–7 are mono-sulfated, and peaks 8 and 9 are di-sulfated dp2s. For 8 and 9, the EIC for in-source loss of SO3 is overlaid.
The HS and heparin samples were also digested with a mixture of heparin lyases I, II and III, resulting in complete depolymerization of the GAG chains to disaccharides (the structures for which are shown in Supporting Information Figure S-3). The codes used for the dp2s derived from enzyme digestion are based on the nomenclature proposed by Lawrence et al.35 Separation of these 4,5-unsaturated disaccharides was performed by SEC-MS (see Supporting Information Figure S-6). This method has been used extensively and successfully by our group for disaccharide analysis.15,36–40 A comparison of the deaminative cleavage in conjunction with PGC-MS and enzymatic digestion in combination with SEC-MS is shown in Table S-2. The two methods are compared for equivalent disaccharide units based on degree of sulfation. The two methods generated similar percentages for each group of disaccharides. The enzymatic digestion/SEC-MS method resulted in slightly higher percentages of mono-sulfated dp2s. Incomplete hydrazinolysis or deaminative cleavage and the presence of low abundance tetrasaccharides from deaminative ring contraction may account for these minor differences. Overall, the results from the two methods are in good agreement, thus, confirming the validity of the HONO and PGC-MS method for disaccharide analysis of HS and heparin samples.
Identification of Uronic Acids
In the HS samples, there are two peaks for the non-sulfated disaccharide with m/z 339.1 (peaks 1 and 2 in Figure 1). In order to identify the GlcA-aManR, K5 polysaccharide was subjected to hydrazinolysis and deaminative cleavage followed by PGC-MS. K5 polysaccharide, a polymer consisting of unsulfated GlcAβ(1→4)GlcNAc disaccharide units, showed one major peak at ~9.8 min (Fig 2A). On the other hand, the EIC of m/z 339.1 from epimerized and N-sulfated K5 polysaccharide (50% epimerization of the HexA C5 position) showed two equally abundant peaks, peak 1 at 9.8 min and peak 2 at 10.2 min (Fig. 2A). These data indicate that the first and second peaks correspond to GlcA-aManR and IdoA-aManR, respectively.
Figure 2.

Effect of exoglycosidases on HONO-derived dp2s. (A) EIC of the non-sulfated dp2 from K5 polysaccharide (solid line). The EIC of the epimerized and N-sulfated K5 polysaccharide is shown in dashed lines. (B) EIC of the non-sulfated dp2 of epimerized and N-sulfated K5 polysaccharide with (dashed line) and without (solid line) treatment with α-iduronidase. After treatment with the enzyme, there is a decrease in intensity of peak 2, as indicated by the gray arrow. After treatment with β-glucuronidase, the mono-sulfated peak 6 of (C) HSBK and (D) HSPIM decreased. The mono-sulfated peak 7 of (E) HSBK and (F) HSPIM decreased significantly after incubation with α-iduronidase.
The exoglycosidases, β-glucuronidase and α-iduronidase, were used to determine which HONO-derived dp2s have GlcA and IdoA, respectively. β-glucuronidase and α-iduronidase catalyzes the hydrolysis of β-D-glucuronic acid and α-L-iduronic acid residues, respectively, from the non-reducing end of GAGs such as HS.41 These enzymes have been shown to have very high specificity for un-sulfated hexuronic acid residues at the non-reducing end.42,43 These exoglycosidases will, thus, have no activity on highly sulfated disaccharides and will have no effect on the di-sulfated HONO-derived dp2s containing 2-O-sulfate.
To confirm that peak 2 corresponds to IdoA-aManR, the HONO-derived disaccharides from epimerized and N-sulfated K5 polysaccharide were treated with α-iduronidase. Figure 2B shows that there was ~70% decrease in the second peak of epimerized and N-sulfated K5 polysaccharide after treatment with the enzyme. This verifies that the second peak is IdoA-aManR.
The EIC of the mono-sulfated dp2 (m/z 419.1) from HSBK showed four distinct peaks, whereas HSPIM and heparin showed five peaks (peaks 3–7, Figure 1). After treatment with β-glucuronidase, the intensity of peak 6 for both HSBK and HSPIM decreased by about 50% and 40%, respectively (Figures 2C and 2D). β-Glucuronidase is specific for GlcA-(β1,4)/(β1,3)-HexNY6S/3S where Y is either an acetyl or sulfate group38. Consistent with this report, β-glucuronidase did not have an effect on the non-sulfated GlcA-aManR. Peak 7 for both HSBK and HSPIM showed ~70% and 55% decrease, respectively, after treatment with α-iduronidase (Figures 2E and 2F). In addition, there is a small decrease (~15% and 8% for HSBK and HSPIM, respectively) in IdoA-aManR which is consistent with the findings of Freeman et. al.43 α-iduronidase has greater activity for IdoA-aMan(6S)R compared to IdoA-aManR. Peak 1′ represents the resulting aMan(6S)R residue with m/z 243. These results indicate that peaks 6 and 7 are GlcA-aMan(6S)R and IdoA-aMan(6S)R, respectively.
Identification of Positional Sulfation Isomers
Chemical O-desulfation was used to determine the position of the sulfates in the mono- and di-sulfated HONO-derived dp2s. Selective 2-O-desulfation was achieved by treatment of HS and heparin with alkali.32 By lyophilization, the 2-O-sulfated hexuronic acid quantitatively converted into an epoxidated structure after treatment with a base such as NaOH, is converted to a 2-O-desulfated HexA.44 Figure 3 shows that the mono-sulfated peak 5 disappeared and the di-sulfated peak 8 decreased significantly after 2-O-desulfation for HSBK, HSPIM, and heparin. There was a corresponding increase in IdoA-aManR, indicating that peak 5 is IdoA(2S)-aManR. There was also an increase in the mono-sulfated peak 7. This is likely a result of the removal of 2-O-sulfate from the di-sulfated peak 8.
Figure 3.
Effect of chemical 2-O-desulfation on HONO-derived dp2s from (A) HSBK, (B) HSPIM, and (C) heparin. The EIC of the disaccharides after 2-O-desulfation are shown in dotted lines. For all the samples, there is a decrease in mono-sulfated peak 5 and di-sulfated peak 8 after treatment with NaOH and lyophilization (gray arrows). There is also an increase in the non-sulfated peak 2 and mono-sulfated peak 7 (white arrows).
Chemical 6-O-desulfation was achieved by using a silylating agent, MTSTFA, which has a high regioselectivity for 6-O-desulfation.31 A report showed that while this method can remove 6-O-sulfates completely, it can also remove 2-O-sulfates to a lesser degree.45 PGC-MS revealed that mono-sulfated peaks 3, 4, 6, and 7 as well as di-sulfated peaks 8 and 9 decreased in intensity after treatment with MTSTFA (Figure 4). Together with the results after treatment with exoglycosidases (Figure 2C–2F), this suggests that peaks 6 and 7 are GlcA-aMan(6S)R and IdoA-aMan(6S)R, respectively. The peaks for the non-sulfated dp2s, peak 1 GlcA-aManR and peak 2 IdoA-aManR, increased after 6-O-desulfation. This is due to the removal of 6-O-sulfates from the mono-sulfated dp2s. There was also an increase in peak 5, IdoA(2S)-aManR, which can be due to the removal of 6-O-sulfate from either peaks 8 or 9.
Figure 4.
Effect of chemical 6-O-desulfation on HONO-derived dp2s from (A) HSBK, (B) HSPIM, and (C) heparin. The EIC of the disaccharides after incubation with MTSTFA are shown in dotted lines. For all the samples, there is a decrease in mono-sulfated peaks 3, 4, 6, and 7 as well as in the di-sulfated peaks 8 and 9 after 6-O-desulfation (gray arrows). There is also an increase in the both non-sulfated peaks 1 and 2 and mono-sulfated peak 5 (white arrows).
Arixtra, a pentasaccharide consisting of GlcNS(6S)-GlcA-GlcNS(3S)(6S)-IdoA(2S)-GlcNS(6S)OCH3, was used to identify the di-sulfated peaks 8 and 9 present in HSPIM and heparin. Deaminative cleavage followed by PGC-MS revealed three major and three minor cleavage products (Figure 5). The first major peak 1′ corresponds to aMan(6S)R with m/z 243. The three minor peaks (~10% of total products) are mono-sulfated dp2s and have same retention times as peaks 3, 4 and 5 of the HS and heparin samples. The last two peaks are di-sulfated peaks with same retentions times as peaks 8 and 9. Arixtra was treated with Sulf2, an endosulfatase that selectively removes 6-O-sulfates from HS chains. Previous studies have revealed that Sulf2 acts predominantly on HexA(2S)-GlcNS(6S) disaccharides and weakly on HexA-GlcNS(6S).46,47 Figure 5B shows that the first di-sulfated peak 8 decreased in intensity after treatment with Sulf2, indicating that this peak is IdoA(2S)-aMan(6S)R. The HONO-treated Arixtra was also subjected to chemical O-desulfation. Only the peak 8 decreased after 2-O-desulfation (Figure 5C), which confirms that this peak is IdoA(2S)-aMan(6S)R. As expected, there was an increase in the peak at ~32 min, the same retention time as IdoA-aMan(6S)R, peak 7, from the HS samples and heparin. In contrast, both di-sulfated peaks 8 and 9 disappeared after 6-O-desulfation (Figure 5D). There was an increase in the peak at ~16.5 min, the same retention time as the IdoA(2S)-aManR, peak 5, from the HS samples. This is due to the removal of 6-O-sulfate from the first di-sulfated peak 8, IdoA(2S)-aMan(6S)R. These results indicate that the second di-sulfated peak 9 is, thus, GlcA-aMan(3S)(6S)R. The results also revealed that the treatment with MTSTFA removes both 3-O- and 6-O-sulfates at the same rate. The 6-O-desulfation was performed at different temperatures and reaction times to determine the optimum conditions for selective removal of either 3-O- and 6-O-sulfates (data not shown). However, selective removal was not obtained at any of the conditions used.
Figure 5.

Identification of di-sulfated dp2s. (A) EIC of Arixtra HONO disaccharides. (B) The EIC of the disaccharides after Sulf2 treatment are shown in dotted lines. There is a decrease in the di-sulfated peak 8 (gray arrow) and an increase in mono-sulfated peak 5 (white arrow). (C) The EIC of the dp2s after chemical 2-O-desulfation are shown in dotted lines. The di-sulfated peak 8 as well as the mono-sulfated peak 5 decreased (gray arrows). Peaks 2 and 7 increased after desulfation (white arrows). (D) The EIC of the dp2s after chemical 6-O-desulfation are shown in dotted lines. Disulfated peaks 8, 9, monosulfated peaks 3, 4 decreased after desulfation (gray arrows). Unsulfated peaks 1, 2 and monosulfated peak 5 increased after removal of 6-O-sulfate (white arrows).
Analysis of Pure Mono-Sulfated HONO-Derived Disaccharides
Since no standards for the mono-sulfated dp2s generated using deaminative cleavage were available, each disaccharide peak was collected and subjected to tandem mass spectrometry in addition to chemical O-desulfation and uronidase degradation to determine the uronic acid epimerization and the sulfate position. EDD and EID were performed on each of the isomeric disaccharides. The two MS/MS techniques provided unique product ion spectra of each of the isomers, useful for identification of the position of the sulfate groups (Supporting Information Figure S-7 and S-8). The rms mass accuracy of the product ion assignments averaged 0.5 ppm. The EDD mass spectra are consistent with the assignment of 2-O and 6-O-sulfation sites of the mono-sulfated dp2s.
Some product ions in the EDD of [M-2H]2− and EID of [M-H]− (Supporting Information Figure S-7 and S-8) were common to all isomers and were generated from the neutral loss from the precursor ion. An abundant neutral loss product ion was m/z 357, assigned as [M-CO2H-H2O]−. In the EID, the abundant product ions m/z 339 and 388 likely corresponds to a loss of SO3 and CH3O, respectively. For all isomers, both EDD and EID resulted in the presence of cross-ring cleavages in addition to glycosidic cleavages. For peaks 3, 4, 6, and 7 (Figure S-5A, S-5B, S-5D, S-5E; Figure S-6A, S-6B, S-6D, S-6E), the presence of product ions at m/z 225 and 243 corresponds to glycosidic bond cleavages where charge is retained on the reducing end portion of the molecule containing the sulfate group, to form Z1 and Y1 ions, respectively. The glycosidic bond cleavage product ions establish that the site of sulfation lies within the aManR residue, either at the C3 or C6 position, and can have the structures shown in Figure S-5F, S-5G, or S-5H. The MS2 spectra also showed several product ions resulting from a cross-ring cleavage: 2,5X1-CO2H (m/z 256), 1,5X1 (m/z 271), 0,2X1 (m/z 285), 0,3X1-2H (m/z 313), and 0,3X1 (m/z 315).
Most of the observed glycosidic bond and cross-ring cleavage product ions were common to all tandem mass spectra but with different abundances. A few peaks were not common to all spectra. The product ions 1,3X0 and Y1-CH2O are observed only in the mass spectra of peaks 6 and 7, but are significantly more intense in the spectrum of peak 6. The presence of 1,3X0 in the EDD of peaks 6 and 7 is consistent with results from previous sections showing that these two peaks are 6-O-sulfated. A product ion at m/z 341 which is likely the loss of H2O from 1,4A2 or 1,3X1 or 2,4X1, is observed only in the EDD spectrum of peak 7 and not in peak 6. In addition, the product ions 0,3X1-2H (m/z 313) and 2,4A2/1,4X1/3,5X1-2H (m/z 329) are more intense in the EDD and EID spectra of peak 7 compared to peak 6. These peaks can, thus, distinguish the 6-O-sulfated peaks 6 (Figure S-7F) and 7 (Figure S-7G) which differ only in their hexuronic acid. For peak 5 (Figure S-5C and Figure S-6C), the EID mass spectrum showed five diagnostic fragment ions. Three product ions result from glycosidic cleavage wherein the charge is retained on the uronic acid containing the sulfate group: B1-CO2 (m/z 211), B1 (m/z 255), and C1+H (m/z 272). The other two product ions, 1,4A1-2H (m/z 167) and 1,5A1 (m/z 227) result from cross-ring cleavages. The sulfate group of peak 5 is assigned to the C2 position of the uronic acid as shown in Figure S-5I, consistent with the results from the previous sections.
Each mono-sulfated disaccharide was subjected to chemical O-desulfation to determine the uronic acid epimerization. After the chemical treatment, an increase in either GlcA-aManR or IdoA-aManR was expected, resulting from the removal of the sulfate. The results are shown in Figure S-8. In the figure, the dotted trace represents the EIC of m/z 339 of epimerized and N-sulfated K5 polysaccharide. In a previous section, it was demonstrated that peaks 1 and 2 correspond to GlcA-aManR and IdoA-aManR, respectively. For each series, the upper panel represents the EIC of m/z 419 for the purified mono-sulfated dp2, the middle panel the effect of 2-O-desulfation, and the lower panel the effect of 6-O-desulfation. For peak 3 (S-7A), 2-O-desulfation had no effect. After 6-O-desulfation, there was a ~50% decrease in peak 3 and a corresponding increase in GlcA-aManR, indicating that this peak is GlcA-aMan(3S)R or GlcA-aMan(6S)R. Similarly, 6-O-desulfation resulted in a decrease in the intensity of peak 4 (S-7B) and an increase in GlcA-aManR, suggesting that this peak is also either GlcA-aMan(3S)R or GlcA-aMan(6S)R. However, the removal of sulfate for peak 4 was greater (~90%) compared to peak 3 which is consistent with the conclusion that these peaks represent different structures. In fact, the effect of 6-O-desulfation was least in peak 3 (S-7A) compared to peaks 4 (S-7B), 6 (S-7D), and 7 (S-7E), which suggests that this peak has a different sulfate position, a 3-O-sulfate instead of a 6-O-sulfate. This conclusion is supported by the fact that peak 3 is abundant for heparin and HSPIM, but very low abundance for HSBK (Figure 1). In addition, peak 3 is of very low abundance in HS from aorta, lung and the low salt fraction of kidney and is significant in abundance only for intestine and the high salt fraction of kidney (Figure S-4). This pattern is consistent with peak 3 corresponding to GlcA-AMan3SR since its abundance is highest for tissues known to have high anticoagulant activity. The anticoagulant activity requires a 3-O-sulfation48,49.
For peak 5 (Figure S-8C), there was ~60% decrease in intensity after 2-O-desulfation and a corresponding increase in IdoA-aManR, indicating that this peak is IdoA(2S)-aManR. Also, treatment with MTSTFA resulted in removal of a small (~5%) amount of the 2-O-sulfate. Both peaks 6 (S-8D) and 7 (S-8E) were unaffected by the treatment with alkali but disappeared after 6-O-desulfation. For peak 6, there was a corresponding increase in peak 1 (GlcA-aManR) suggesting that this peak is GlcA-aMan(6S)R. On the other hand, there was an increase in peak 2 (IdoA-aManR) after removal of the 6-O-sulfate from peak 7 indicating that this peak is IdoA-aMan(6S)R. These results are in agreement with those discussed in previous sections.
Using the exoglycosidases, chemical O-desulfation, and tandem mass spectrometry, the elution order in PGC of the HONO-derived dp2s have been determined (Table 1).
Table 1.
Disaccharides obtained by nitrous acid depolymerization and PGC and the effect of exoglycosidases and chemical-O-desulfation
| Peak | Disaccharide | β-glucuronidase | α-iduronidase | 2-O-desulfation | 6-O-desulfation |
|---|---|---|---|---|---|
| 1 | GlcA-aManR | ||||
| 2 | IdoA-aManR | ↓ (70%)b | |||
| 3 | GlcA-aMan(3S)R | 0 | ↓ (50%)c | ||
| 4 | GlcA-aMan(3S)/(6S)R | 0 | ↓ (90%)c | ||
| 5 | IdoA(2S)-aManR | ↓ (60%)c | ↓ (95%)c | ||
| 6 | GlcA-aMan(6S)R | ↓ (45%)a | 0 | ↓ (100%)c | |
| 7 | IdoA-aMan(6S)R | ↓ (65%)a | 0 | ↓ (100%)c | |
| 8 | IdoA(2S)-aMan(6S)R | ↓ (95%)d | ↓ (95%)d | ||
| 9 | GlcA-aMan(3S)(6S)R | 0 | ↓ (95%)d |
Value is an average of the decrease in abundance of dp2s from HSBK and HSPIM.
Value is based on decrease of abundance of dp2 from heparosan.
Value is based on decrease of abundance of purified mono-sulfated dp2s.
Value is an average of the decrease in abundance of dp2s from HSBK, HSPIM, and heparin
Conclusions
A method for disaccharide analysis of HS and heparin samples using deaminative cleavage by HONO in conjunction with PGC-MS has been described in this work. Results demonstrate that PGC is suitable for the separation of HONO-derived dp2s with different sulfate groups. In addition PGC allows separation of uronic acid epimers and isomeric glycans prior to MS and tandem MS. Another advantage of PGC is that the mobile phase used makes it well suited for interface with mass spectrometry. Lastly, the disaccharide composition obtained from combination of HONO treatment and PGC-MS is comparable to that of enzymatic digestion and SEC-MS. This analytical method provides data on uronic acid epimers that is essential for modeling of HS structure based on compositional analysis.22
Supplementary Material
Acknowledgments
Support for this research was provided by NIH grants P41RR10888, P41GM104603, R01HL098950, and S10RR025082.
Footnotes
Additional information as described in the text. This material is available free of charge via the Internet at http://pubs.acs.org.
References
- 1.Conrad HE. Heparin Binding Proteins. Academic Press, Inc; New York: [Google Scholar]
- 2.Caoila I, Linhardt RJ. Angew Chem Int Ed Engl. 2002;41:391–412. doi: 10.1002/1521-3773(20020201)41:3<390::aid-anie390>3.0.co;2-b. [DOI] [PubMed] [Google Scholar]
- 3.Fuster MM, Esko JD. Nat Rev Cancer. 2005;5:526–542. doi: 10.1038/nrc1649. [DOI] [PubMed] [Google Scholar]
- 4.Zu W, Li J, Liang G. Biomed Environ Sc. 2011;24:81–87. doi: 10.3967/0895-3988.2011.01.011. [DOI] [PubMed] [Google Scholar]
- 5.Esko JD, Lindahl U. J Clin Invest. 2001;108:169–173. doi: 10.1172/JCI13530. [DOI] [PMC free article] [PubMed] [Google Scholar]
- 6.Bishop JR, Schuksz M, Esko JD. Naure. 2007;446:1030–1037. doi: 10.1038/nature05817. [DOI] [PubMed] [Google Scholar]
- 7.Bulow HE, Hobert O. Annu Rev Cell Dev Biol. 2006;22:375–407. doi: 10.1146/annurev.cellbio.22.010605.093433. [DOI] [PubMed] [Google Scholar]
- 8.Kreuger J, Spillmann D, Li J, Lindahl U. J Cell Biol. 2006;174:323–327. doi: 10.1083/jcb.200604035. [DOI] [PMC free article] [PubMed] [Google Scholar]
- 9.Kamimura K, Koyama T, Habuchi H, Ueda R, Masu M, Kimata K, Nakato H. J Cell Biol. 2006;174:773–778. doi: 10.1083/jcb.200603129. [DOI] [PMC free article] [PubMed] [Google Scholar]
- 10.Parthasarathy N, Goldberg IJ, Sivaram P, Mulloy B, Flory DM, Wagner WD. J Biol Chem. 1994;269:22391–22396. [PubMed] [Google Scholar]
- 11.Toyoda H, Kinoshita-Toyoda A, Selleck SB. J Biol Chem. 2000;275:21856–21861. doi: 10.1074/jbc.M003540200. [DOI] [PubMed] [Google Scholar]
- 12.Hitchcock AM, Bowman MJ, Staples GO, Zaia J. Electrophoresis. 2008;29:4538–4548. doi: 10.1002/elps.200800335. [DOI] [PMC free article] [PubMed] [Google Scholar]
- 13.Saad OM, Ebel H, Uchimura K, Rosen SD, Bertozzi CR, Leary JA. Glycobiology. 2005;15:818–826. doi: 10.1093/glycob/cwi064. [DOI] [PubMed] [Google Scholar]
- 14.Ruiz-Calero V, Moyano E, Puignou L, Galceran MT. J Chromatogr A. 2001;914:277–291. doi: 10.1016/s0021-9673(00)01181-x. [DOI] [PubMed] [Google Scholar]
- 15.Shi X, Zaia J. J Biol Chem. 2009;284:11806–11814. doi: 10.1074/jbc.M809637200. [DOI] [PMC free article] [PubMed] [Google Scholar]
- 16.Jones CJ, Membreno N, Larive CK. J Chromatogr A. 2010;1217:479–188. doi: 10.1016/j.chroma.2009.11.064. [DOI] [PubMed] [Google Scholar]
- 17.Shaklee PN, Conrad HE. Biochem J. 1984;217:187–197. doi: 10.1042/bj2170187. [DOI] [PMC free article] [PubMed] [Google Scholar]
- 18.Guo Y, Conrad HE. Anal Biochem. 1989;176:96–104. doi: 10.1016/0003-2697(89)90278-9. [DOI] [PubMed] [Google Scholar]
- 19.Maccarana M, Sakura Y, Tawada A, Yoshida K, Lindahl U. J Biol Chem. 1996;271:17804–17810. doi: 10.1074/jbc.271.30.17804. [DOI] [PubMed] [Google Scholar]
- 20.Kariya Y, Herrmann J, Suzuki K, Isomura K, Ishihara M. J Biochem. 1998;123:240–246. doi: 10.1093/oxfordjournals.jbchem.a021928. [DOI] [PubMed] [Google Scholar]
- 21.Babu P, Victor XV, Nelsen E, Thao KNN, Raman K, Kuberan B. Anal Bioanal Chem. 2011;401:237–244. doi: 10.1007/s00216-011-5087-z. [DOI] [PMC free article] [PubMed] [Google Scholar]
- 22.Spencer JL, Bernanker JA, Buczek-Thomas J, Nugent MA. PLoS ONE. 2010;5:e9389. doi: 10.1371/journal.pone.0009389. [DOI] [PMC free article] [PubMed] [Google Scholar]
- 23.Koimur M, Lu B, Westerlund D. Chromatographia. 1996;43:254–260. [Google Scholar]
- 24.Estrella RP, Whitelock JM, Packer NH, Karlsson NG. Anal Chem. 2007;79:3597–3606. doi: 10.1021/ac0622227. [DOI] [PubMed] [Google Scholar]
- 25.Pabst M, Bondili JS, Stadlamann J, Mach L, Altmann F. Anal Chem. 2007;79:5051–5057. doi: 10.1021/ac070363i. [DOI] [PubMed] [Google Scholar]
- 26.Wei W, Ninonuevo NR, Sharma A, Danan-Leon LM, Leary JA. Anal Chem. 2011;83:3703–3708. doi: 10.1021/ac2001077. [DOI] [PMC free article] [PubMed] [Google Scholar]
- 27.Zaia J. Mass Spec Rev. 2009;28:254–272. doi: 10.1002/mas.20200. [DOI] [PMC free article] [PubMed] [Google Scholar]
- 28.Pabst M, Altmann F. Proteomics. 2011;11:631–643. doi: 10.1002/pmic.201000517. [DOI] [PubMed] [Google Scholar]
- 29.Karlsson NG, Schulz BL, Packer NH, Whitelock JM. J Chromatogr B. 2005;824:139–147. doi: 10.1016/j.jchromb.2005.07.014. [DOI] [PubMed] [Google Scholar]
- 30.Barroso B, Didraga M, Bischoff R. J Chromatogr A. 2005;1080:43–48. doi: 10.1016/j.chroma.2005.03.020. [DOI] [PubMed] [Google Scholar]
- 31.Takano R, Ye Z, Ta T-V, Kamei K, Kariya Y, Hara S. Carbohydr Lett. 1998;3:71–77. [Google Scholar]
- 32.Jaseja M, Rej RN, Sauriol F, Perlin AS. Can J Chem. 1989;67:1449–1456. [Google Scholar]
- 33.Shively JE, Conrad HE. Biochemistry. 1976;15:3943–3950. doi: 10.1021/bi00663a006. [DOI] [PubMed] [Google Scholar]
- 34.Bienkowski MJ, Conrad HE. J Biol Chem. 1985;260:356–365. [PubMed] [Google Scholar]
- 35.Lawrence R, Lu H, Rosenberg RD, Esko JD, Zhang L. Nature Methods. 2008;5:291–292. doi: 10.1038/nmeth0408-291. [DOI] [PubMed] [Google Scholar]
- 36.Staples GO, Shi X, Zaia J. J Biol Chem. 2010;285:18336–18343. doi: 10.1074/jbc.M110.101592. [DOI] [PMC free article] [PubMed] [Google Scholar]
- 37.Staples GO, Shi X, Zaia J. PLoS ONE. 2011;6:e16689. doi: 10.1371/journal.pone.0016689. [DOI] [PMC free article] [PubMed] [Google Scholar]
- 38.Thelin M, Svensson KJ, Shi X, Bagher M, Axelssom J, Isinger-Ekstrand A, van Kuppevelt TH, Johansson J, Nilbert M, Zaia J, Belting M, Maccarana M, Malmstrom A. Cancer Res. 2012;72:1943–1952. doi: 10.1158/0008-5472.CAN-11-1351. [DOI] [PMC free article] [PubMed] [Google Scholar]
- 39.Schumacher VA, Schlotzer-Schrehardt U, Karumanchi SA, Shi X, Zaia J, Jeruschke S, Zhang D, Pavenstaedt H, Drenckhan A, Amann K, Ng C, Hartwig S, Ng KH, Ho J, Kreidberg JA, Taglienti M, Royer-Pokora B, Ai X. J Am Soc Nephrol. 2011;22:1286–1296. doi: 10.1681/ASN.2010080860. [DOI] [PMC free article] [PubMed] [Google Scholar]
- 40.Langsdorf V, Schumacher V, Shi X, Tran T, Zaia J, Jain S, Taglienti M, Kreidberg JA, Fine A, Ai X. Glycobiology. 2011;21:152–161. doi: 10.1093/glycob/cwq133. [DOI] [PMC free article] [PubMed] [Google Scholar]
- 41.Ernst S, Langer R, Cooney CL, Sasisekharan R. CRC Cr Rev Bioch Mol. 1995;30:387–444. doi: 10.3109/10409239509083490. [DOI] [PubMed] [Google Scholar]
- 42.Kresse H, Glossl J. Adv Enzymol RAMB. 1987;60:217–312. doi: 10.1002/9780470123065.ch4. [DOI] [PubMed] [Google Scholar]
- 43.Freeman C, Hopwood JJ. Biochem J. 1992;282:899–908. doi: 10.1042/bj2820899. [DOI] [PMC free article] [PubMed] [Google Scholar]
- 44.Piani S, Casu B, Marchi EG, Torri G, Ungarelli F. J Carbohyd Chem. 1993;12:507–521. [Google Scholar]
- 45.Kariya Y, Kyogashima M, Suzuki K, Isomura T, Sakamoto T, Horie K, Ishihara M, Takano R, Kamei K, Hara S. J Biol Chem. 2000;275:25949–25958. doi: 10.1074/jbc.M004140200. [DOI] [PubMed] [Google Scholar]
- 46.Morimoto-Tomita M, Uchimura K, Werb Z, Hemmerich S, Rosen SD. J Biol Chem. 2002;277:49175–49185. doi: 10.1074/jbc.M205131200. [DOI] [PMC free article] [PubMed] [Google Scholar]
- 47.Lamanna WC, Frese MA, Balleininger M, Dierks T. J Biol Chem. 2008;283:27724–27735. doi: 10.1074/jbc.M802130200. [DOI] [PubMed] [Google Scholar]
- 48.Lindahl U, Backstrom G, Thunberg L, Leder IG. Proc Natl Acad Sci USA. 1980;77:6551–6555. doi: 10.1073/pnas.77.11.6551. [DOI] [PMC free article] [PubMed] [Google Scholar]
- 49.Petitou M, Duchaussoy P, Lederman I, Choay J, Sinay P. Carbohydr Res. 1988;179:163–172. doi: 10.1016/0008-6215(88)84116-8. [DOI] [PubMed] [Google Scholar]
Associated Data
This section collects any data citations, data availability statements, or supplementary materials included in this article.