Abstract
Objective: To define the roles of gray-scale, color-Doppler ultrasound, and sonoelastography for the assessment of thyroid nodule to determine whether nodule size affects the differential diagnosis of benign and malignant. Methods: A total of 243 consecutive subjects (214 women, 29 men) with 329 thyroid nodules were examined by gray-scale, color-Doppler ultrasound, and sonoelastography in this prospective study. All patients underwent surgery and the final diagnosis was obtained from histopathological examination. Results: Three hundred and twenty-nine nodules (208 benign, 121 malignant) were divided into small (SNs, 5–10 mm, n=137) and large (LNs, >10 mm, n=192) nodules. Microcalcifications were more frequent in malignant LNs than in malignant SNs, but showed no significant difference between benign LNs and SNs. Poorly-circumscribed margins were not significantly different between malignant SNs and LNs, but were less frequent in benign LNs than in benign SNs. Among all nodules, marked intranodular vascularity was more frequent in LNs than in SNs. By comparison, shape ratio of anteroposterior to transverse dimensions (A/T) ≥1 was less frequent in LNs than in SNs. Otherwise, among all nodules, marked hypoechogenicity and elasticity score of 4–6 showed no significant difference between LNs and SNs. Conclusions: The predictive values of microcalcifications, nodular margins, A/T ratio, and marked intranodular vascularity depend on nodule size, but the predictive values of echogenicity and elastography do not.
Keywords: Ultrasound, Thyroid nodules, Sonoelastography, Nodule size
1. Introduction
Thyroid nodules are very common, with an estimated prevalence ranging from 4% by palpation to 67% by ultrasonography (Ezzat et al., 1994). The detection rate of nonpalpable thyroid nodules in the general population is increasing as a consequence of the widespread use of ultrasound evaluation of the cervical region. Most thyroid nodules are benign, with 5%–15% being malignant (Frates et al., 2006). In general, thyroid carcinomas are growing slowly and run an indolent course. Although the majority of thyroid carcinomas behave in a benign fashion, a small percentage can lead to regional and distant metastases and even death (Samaan et al., 1992). Thyroid microcarcinoma is defined as thyroid carcinoma with a maximum tumor diameter of 10 mm or less. Malignant involvement is not less frequent in thyroid microcarcinomas than in macrocarcinomas (Pelizzo et al., 2006; Cooper et al., 2009). Clinically, it is essential to identify the malignant nodules in order to establish an optimal therapeutic plan for each patient. Furthermore, early diagnosis and treatment of small tumors may be clinically important; however, an aggressive disease course is rare in incidentally discovered microcarcinomas. Hence, incidental thyroid lesions with a diameter of less than 5 mm should usually be followed up with ultrasound (Pelizzo et al., 2006; Cooper et al., 2009).
Fine-needle aspiration biopsy (FNAB) is considered to be the most reliable diagnostic test for evaluation of thyroid nodules, especially when ultrasound guidance is used (Lee et al., 2002). However, performing FNAB on every thyroid nodule detected by ultrasound is not cost-effective due to the high prevalence of nodules. Ultrasound is the most sensitive test available to detect thyroid lesions (Moon H.C. et al., 2007) and may be used to further characterize thyroid nodules, providing an assessment of risk of malignancy, and thereby narrowing down those nodules which require FNAB. Numerous studies have investigated the sonographic features of nodules as predictors of malignancy (Reading et al., 2005; Hoang et al., 2007; Moon W.J. et al., 2008). Although individual sonographic features may be of limited value, when multiple signs of thyroid malignancy appear in combination, it is possible to make accurate predictions (Kim et al., 2002; Ahn et al., 2010). However, whether the diagnostic accuracy of these features may be dependent on nodular size has not been fully investigated.
Sonoelastography is based on the principle that when body tissues are compressed, the softer parts deform more easily than the harder parts (Khaled et al., 2006). Preliminary results of sonoelastography have shown an excellent differentiation of variable hardness of thyroid nodules when compared to histopathology (Lyshchik et al., 2005; Rago et al., 2007; Asteria et al., 2008; Dighe et al., 2008; Rubaltelli et al., 2009; Bojunga et al., 2010). Whether elastographic measurement can give reliable results in nodules less than 10 mm is not clear.
The purpose of this study was to define the roles of gray-scale, color-Doppler ultrasound, and sonoelastography for assessment of thyroid nodules to determine if nodule size affects differential diagnosis of benign and malignant using histopathology as the reference standard.
2. Subjects and methods
2.1. Patients
The study was conducted with the approval of the institutional review board of Zhejiang University, China. All patients provided informed consent to participate in the study.
A total of 663 consecutive patients with both palpable and nonpalpable nodules who had undergone thyroid ultrasound between November 2008 and September 2010 were considered for the study. Only 283 patients who underwent surgery and pathological evaluation were included. The indications for surgery included the following reasons: suspicious ultrasound malignant findings (n=159), compression symptoms or cosmetic reasons (large goiter) (n=85), and the patients’ desires (n=39). The final diagnosis was based on the results of histopathologic examination of resected specimens.
As for thyroid nodules, the inclusion criterion was the presence of single or multiple thyroid nodules larger than 5 mm. The exclusion criteria were: (1) nodules with cystic portion >50%; (2) nodules in which ultrasound revealed the presence of calcified shell; (3) nodules which could not be clearly distinguishable from other nodules present in the thyroid.
Thus, a total of 243 patients with 329 thyroid nodules were enrolled in this study. There were 214 women and 29 men with a mean age of (45.3±12.7) years (range: 17–76 years).
2.2. Conventional ultrasound and sonoelastography
Both conventional sonography and sonoelastography were performed using EUB-8500 or HI VISION 900 US system machines (Hitachi Medical, Tokyo, Japan) and 6–13 MHz linear array transducer. All examinations were performed by the same investigator with ten years of experience in thyroid ultrasound.
All selected thyroid nodules were assessed by conventional gray-scale and color-Doppler ultrasound. The echogenicity of the nodules was classified into four categories: marked hypoechogenicity, hypoechogenicity, isoechogenicity, and hyperechogenicity. The marked hypoechogenicity was defined as low echogenicity compared with the surrounding strap muscles. The hypoechogenicity, isoechogenicity, and hyperechogenicity were defined according to the comparative echogenicity between the thyroid parenchyma and the nodule. Shape was assessed as the ratio of anteroposterior (A) to transverse (T) dimensions (A/T≥1 or <1). The margin of the nodule was described as (1) well-circumscribed when the boundary of the nodule was well-defined or the contour of the nodule was smooth and rounded; or (2) poorly-circumscribed when the boundary of the nodule was ill-defined or the contour of the nodule was irregular with jagged edges. Calcification within the nodule was classified into four categories: no calcification, microcalcification, large and dense calcification, and rim calcification. Microcalcification was defined as hyperechoic spots less than 2 mm with or without acoustic shadowing. The component of the nodule was classified as solid (solid portion>90%), predominantly solid (solid portion>50%), predominantly cystic (cystic portion>50%), and cystic (cystic portion>90%). The presence and the pattern of blood flow evaluated by color-Doppler imaging were classified as follows: no vascularity-defined as no color-Doppler flow in the periphery or within the nodule; peripheral vascularity-defined as flow in the peripheral position and absent or slight flow in the central part of the nodule; marked intranodular vascularity-defined as more flow in the central part of the nodule than at the periphery.
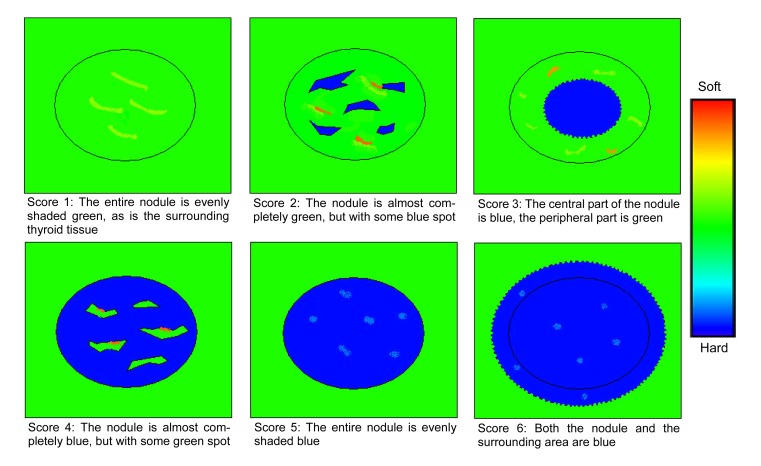
Sonoelastography was performed after the conventional sonographic examination by the same investigator. With the use of sonoelastographic mode, the probe was placed on the neck with light pressure, and an elastographic region of interest (ROI) was positioned by the operator that included the nodule and sufficient surrounding thyroid tissue to be evaluated. To keep the strain distribution uniform, the probe was pressed to the area with a frequency of 2 to 3 times per second during the cycle of compressing-decompressing in elastography. The level of the pressure was indicated by a 5-point scale meter, which was displayed in real time on the screen. A scale of 2 to 4 was indicative of correct compression. The real-time elastogram was displayed over the gray-scale imaging in a color-coded map: highly elastic tissues (soft) appear in red, less elastic tissues (hard) appear in blue, and intermediate degrees of elastic tissues are shown in green. The sonoelastogram was considered to be reliable only when the elastographic image displayed over the B-mode continued for at least 5 s with the illuminated indicator showing a value between 2 and 4. In our study, the characteristics of thyroid nodules on sonoelastogram were categorized into 6 patterns (i.e., elasticity scores 1–6). Fig. 1 demonstrates the features of each pattern.
Fig. 1.
Schematic representation of the general appearance of thyroid nodules for elasticity scores of 1–6
2.3. Statistical analysis
The software package SPSS for Windows 13.0 (SPSS Inc., Chicago, IL, USA) was used for statistical data analysis. Each of the ultrasound features was analyzed to determine its association with a benign vs. malignant diagnosis. A Student’s t-test was used for comparison of quantitative variables. To assess the diagnostic values of conventional ultrasound and sonoelastography compared with the histopathologic results, cross-table tests were carried out. The diagnostic sensitivity, specificity, positive predictive value (PPV), and negative predictive value (NPV) were calculated. To summarize the overall performance, the areas under the receiver operating characteristic curve (A Z) were calculated and compared for the two techniques. P-value of less than 0.05 was considered to be statistically significant.
3. Results
Two-hundred and forty-three patients with 329 thyroid nodules were successfully evaluated by gray-scale, color-Doppler ultrasound, and sonoelastography. All thyroid nodules were confirmed histologically by means of surgery. There were 208 benign (63%) and 121 malignant (37%) nodules. In the 67 patients having multiple thyroid lesions, 14 patients had multiple malignant nodules, 46 had multiple benign nodules, and 7 had both multiple benign and malignant nodules. The diagnoses of malignancy included papillary carcinoma (n=116), follicular carcinoma (n=2), anaplastic carcinoma (n=1), and medullary carcinoma (n=2). The diagnoses of benign nodules included nodular goiter (n=187), Hashimoto’s thyroiditis (n=9), subacute thyroiditis (n=5), follicular adenoma (n=4), and atypical adenoma (n=3). The mean maximal diameter of the malignant nodules ((14.2±9.4) mm, range from 5 to 50 mm) was significantly smaller than that of the benign nodules ((16.6±11.8) mm, range from 5 to 54 mm) (P=0.002).
3.1. Ultrasound features of nodules vs. nodule size
To evaluate the relationship between nodule size and ultrasound features, a cutoff of 10 mm was set as a criterion for dividing small and large nodules. Based on the pathologic findings, there were 137 small nodules (SNs) (malignant 60, benign 77) and 192 large nodules (LNs) (malignant 61, benign 131). The findings of ultrasound features in malignant and benign nodules within SN and LN groups are shown in Table 1.
Table 1.
Frequency of suspicious ultrasound features in malignant and benign nodules according to nodular size
| Characteristics |
n
m
|
n
b
|
||||
| d 5–10 mm (n=60) | d>10 mm (n=61) | P | d 5–10 mm (n=77) | d>10 mm (n=131) | P | |
| Poorly-circumscribed margin | 56 (93%)a | 54 (89%) | 0.362 | 22 (29%) | 21 (16%) | 0.042 |
| Marked hypoechogenicity | 35 (58%) | 42 (69%) | 0.233 | 7 (9%) | 9 (7%) | 0.564 |
| Microcalcification | 30 (50%) | 43 (71%) | 0.021 | 10 (13%) | 7 (5%) | 0.080 |
| A/T≥1 | 29 (48%) | 5 (8%) | <0.001 | 7 (9%) | 2 (2%) | 0.032 |
| Marked intranodular vascularity | 11 (18%) | 24 (39%) | 0.010 | 4 (5%) | 25 (19%) | 0.001 |
| Elasticity score of 4–6 | 54 (90%) | 57 (93%) | 0.496 | 14 (18%) | 26 (20%) | 0.770 |
n m: number of malignant; n b: number of benign; d: diameter
Data are expressed as n (%)
Among malignant nodules, the ultrasound findings of microcalcification and marked intranodular vascularity were more commonly observed in LNs (71% and 39%, respectively) than in SNs (50% and 18%, P=0.021 and P=0.010, respectively). In addition, the ratio of A/T≥1 in malignant nodules showed less frequency in LNs than in SNs (8% vs. 48%, P<0.001). Other ultrasound features (poorly-circumscribed margin, marked hypoechogenicity, elasticity score of 4–6) showed no significant difference between malignant LNs and SNs. Among benign nodules, the ultrasound findings of poorly-circumscribed margin and A/T≥1 were less commonly observed in LNs (16% and 2%, respectively) than in SNs (29% and 9%, P=0.042 and P=0.032, respectively). In contrast, marked intranodular vascularity in benign nodules showed more frequency in LNs than in SNs (19% vs. 5%, P<0.001). Other ultrasound features (marked hypoechogenicity, microcalcification, elasticity score of 4–6) showed no significant difference between benign LNs and SNs.
3.2. Diagnostic accuracy of ultrasound features for malignant nodules
The diagnostic accuracy of the ultrasound features was evaluated separately for SNs and LNs (Table 2). For both SNs and LNs, the presence of marked hypoechogenicity, microcalcification, A/T≥1 ratio, and marked intranodular vascularity had a specificity of 87%–98% and a sensitivity of 8%–70%. In contrast, the elasticity score of 4–6 and poorly-circumscribed margin had a specificity of 71%–80% and a sensitivity of 89%–93%. The feature with the highest A Z was the elasticity score of 4–6 (0.859 in SNs, 0.868 in LNs). The A Z of the elasticity score of 4–6 was significantly greater than that of the poorly-circumscribed margin (0.824 in SNs, P=0.001; 0.862 in LNs, P=0.011, respectively).
Table 2.
Diagnostic accuracy of ultrasound findings for malignant nodules according to nodular size
| Characteristics | n m | n b | S 1(%) | S 2(%) | PPV(%) | NPV(%) | A(%) | A Z | OR | P |
| d 5–10 mm (n=137) | 60 | 77 | ||||||||
| Poorly-circumscribed margin | 56 | 22 | 93 | 71 | 72 | 93 | 81 | 0.824 | 35.0 | <0.001 |
| Marked hypoechogenicity | 25 | 7 | 42 | 91 | 78 | 67 | 69 | 0.663 | 7.14 | <0.001 |
| Microcalcification | 30 | 10 | 50 | 87 | 75 | 69 | 71 | 0.685 | 6.70 | <0.001 |
| A/T≥1 | 29 | 7 | 48 | 91 | 81 | 69 | 72 | 0.696 | 9.36 | <0.001 |
| Marked intranodular vascularity | 11 | 4 | 18 | 95 | 73 | 60 | 61 | 0.566 | 4.10 | 0.015 |
| Elasticity score≥4 | 54 | 14 | 90 | 82 | 79 | 91 | 85 | 0.859 | 40.5 | <0.001 |
| d>10 mm (n=192) | 61 | 131 | ||||||||
| Poorly-circumscribed margin | 54 | 21 | 89 | 84 | 72 | 94 | 85 | 0.862 | 40.41 | <0.001 |
| Marked hypoechogenicity | 19 | 9 | 31 | 93 | 68 | 74 | 73 | 0.621 | 6.132 | <0.001 |
| Microcalcification | 43 | 7 | 70 | 95 | 86 | 87 | 87 | 0.826 | 42.32 | <0.001 |
| A/T≥1 | 5 | 2 | 8 | 98 | 71 | 70 | 70 | 0.533 | 5.76 | 0.022 |
| Marked intranodular vascularity | 24 | 25 | 39 | 81 | 49 | 74 | 68 | 0.601 | 2.75 | 0.003 |
| Elasticity score≥4 | 57 | 26 | 93 | 80 | 69 | 96 | 84 | 0.868 | 57.55 | <0.001 |
n m: number of malignant; n b: number of benign; d: diameter; S 1: sensitivity; S 2: specificity; PPV: positive predictive value; NPV: negative predictive value; A: accuracy; A Z: the areas under the receiver operating characteristic curve; OR: odds ratio
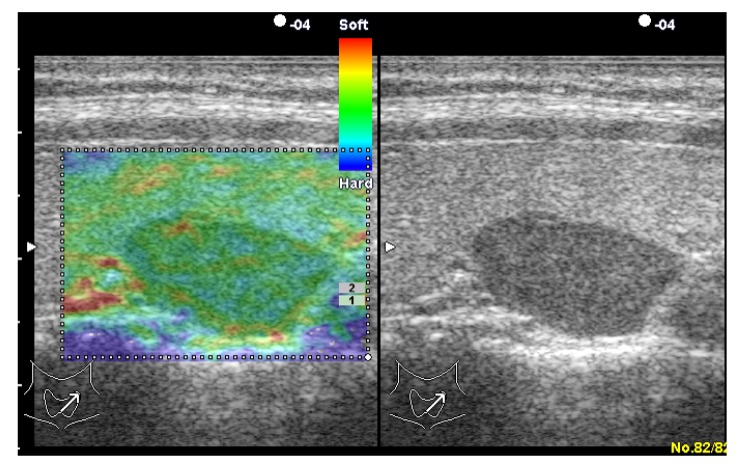
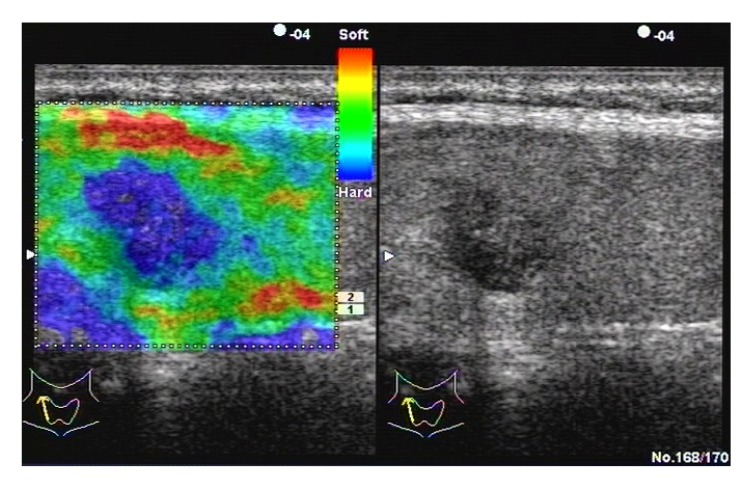
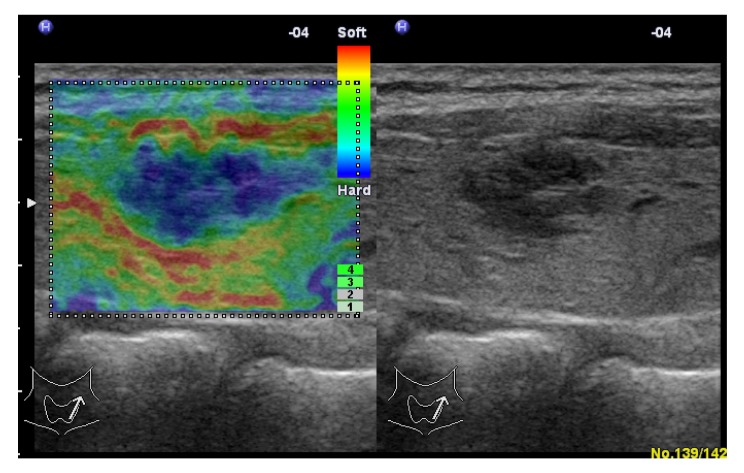
The distribution of elasticity scores in thyroid nodules is shown in Table 3. Among malignant nodules, 90% (54/60) of SNs and 93% (57/61) of LNs had a score of 4–6. Among benign nodules, 82% (63/77) of SNs and 80% (105/131) of LNs had a score of 1–3 (Fig. 2). All the nodules with a score of 6 were malignant (Fig. 3). As for subacute thyroiditis, 4 had a score of 4, 1 had a score of 5 (Fig. 4).
Table 3.
Distribution of elasticity scores in thyroid nodules
| Elasticity score |
n
m
|
n
b
|
||
| d 5–10 mm (n=60) | d>10 mm (n=61) | d 5–10 mm (n=77) | d>10 mm (n=131) | |
| 1 | 2 | 0 | 26 | 9 |
| 2 | 3 | 2 | 29 | 94 |
| 3 | 1 | 2 | 8 | 2 |
| 4 | 14 | 26 | 5 | 21 |
| 5 | 32 | 24 | 9 | 5 |
| 6 | 8 | 7 | 0 | 0 |
n m: number of malignant; n b: number of benign; d: diameter
Fig. 2.
Adenomatoid nodule in a 35-year-old woman
Left: real-time elastogram of the nodule in the left lobe of the thyroid shows completely elastic (score 1). Right: gray-scale sonogram of the nodule shows hypoechoic and well-circumscribed margin
Fig. 3.
Papillary carcinoma in a 35-year-old woman
Left: real-time elastogram of the nodule in the right lobe of the thyroid shows anelastic in the nodule and surrounding tissues (score 6). Right: gray-scale sonogram of the nodule shows hypoechoic and poorly-circumscribed margin
Fig. 4.
Subacute thyroiditis in a 40-year-old woman
Left: real-time elastogram of the nodule in the right lobe of the thyroid shows anelastic (score 5). Right: gray-scale sonogram of the nodule shows marked hypoechoic and poorly-circumscribed margin
4. Discussion
There is a general agreement that ultrasound features indicating a high risk for malignancy should be an indication for an FNAB and even further treatment such as surgery. Ultrasound features predictive of malignant nodules include the presence of irregular margins, marked hypoechogenicity, microcalcifications, taller-than-wide shape, and intranodular vascularity (Kim et al., 2002; Hoang et al., 2007; Moon W.J. et al., 2008; Cooper et al., 2009; Ahn et al., 2010).
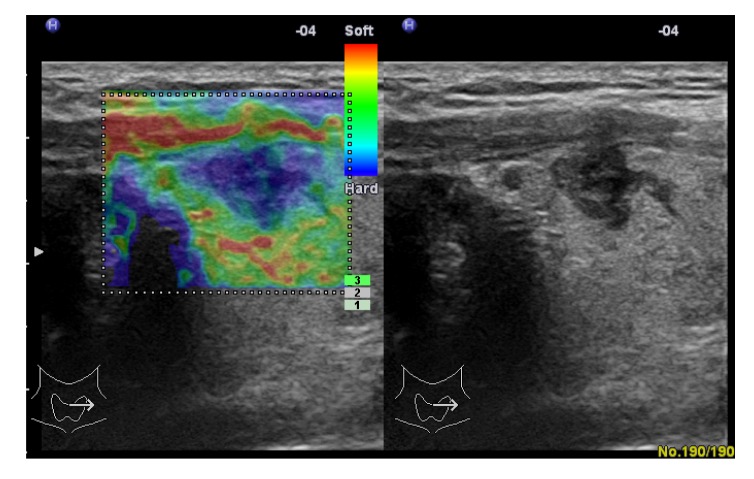
Ultrasound evaluation of the border of a thyroid nodule can be classified as well-defined or ill-defined. Furthermore, nodules can be classified according to their contours as either smooth and rounded or irregular and microlobulated (Hoang et al., 2007). An ill-defined and irregular or microlobulated margin is suggestive of malignancy, but the sensitivity (48.3%–84.4%) and specificity (81%–97.6%) are variable (Kim et al., 2002; Papini et al., 2002; Cappelli et al., 2006; Hoang et al., 2007; Moon W.J. et al., 2008; Ahn et al., 2010). Some investigators have suggested an ill-defined margin as the criterion for the discrimination of malignant from benign nodules (Cappelli et al., 2006; Dighe et al., 2008), others have suggested an irregular or microlobulated margin as the criterion (Kim et al., 2002; Papini et al., 2002; Ahn et al., 2010). Poor interobserver agreement when assessing margins may account for these discordant findings. An irregular and microlobulated contour is thought to be the hallmark of thyroid papillary cancers as the neoplastic thyroid follicular epithelia undergo disorganized growth, resulting in an irregular or lobulated appearance. An ill-defined margin may be associated with minimal marginal tumor infiltration of malignancy. Both characteristics suggest malignant infiltration of adjacent thyroid parenchyma with no pseudocapsule formation (Kim et al., 2002; Reading et al., 2005; Hoang et al., 2007). In our study, a poorly-circumscribed, ill-defined or irregular and microlobulated margin (Figs. 5 and 6), was found in 91% of malignant nodules and 21% of benign nodules. The sensitivity increased to 93% in SNs and 89% in LNs, the specificity was 71% in SNs and 84% in LNs, and accuracy exceeded 80%. The frequency of this characteristic had no significant difference between malignant LNs and SNs, but it was less frequent in benign LNs than in benign SNs.
Fig. 5.
Papillary carcinoma in a 41-year-old man
Left: real-time elastogram of the nodule in the right lobe of the thyroid shows anelastic in the nodule and surrounding tissues (score 6). Right: gray-scale sonogram of the nodule shows marked hypoechoic and irregular, microlobulated margin
Fig. 6.
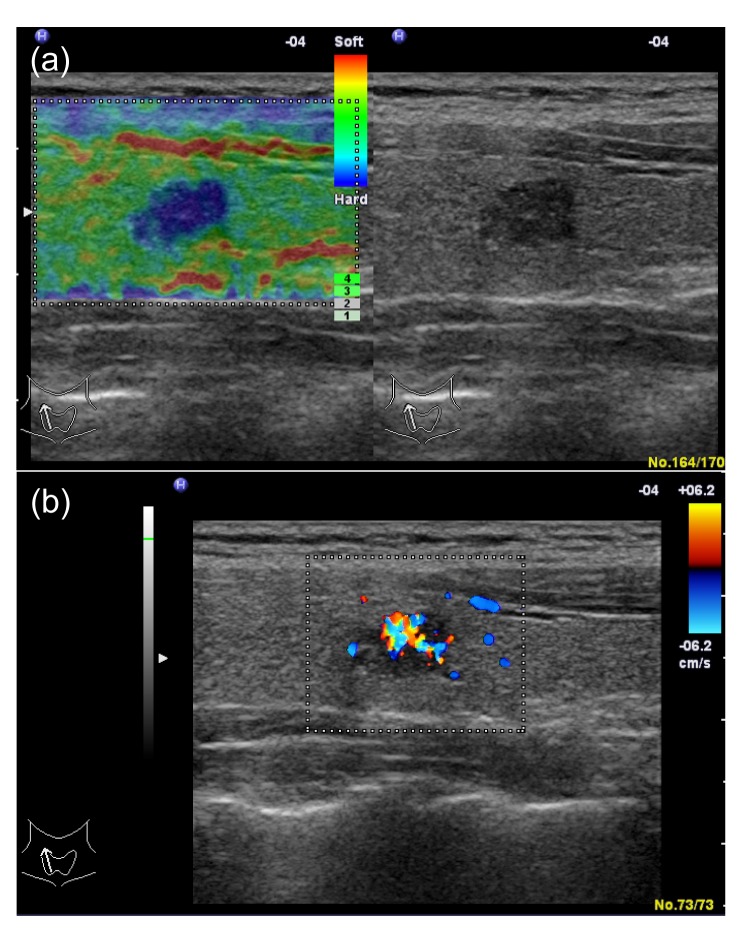
Papillary carcinoma in a 31-year-old woman
(a) Left: real-time elastogram of the nodule in the right lobe of the thyroid shows anelastic (score 5). Right: gray-scale sonogram of the nodule shows marked hypoechoic and poorly-circumscribed margin. (b) In color-Doppler ultrasound it shows marked intranodular vascularity
Malignant nodules are typically hypoechogenic when compared with normal thyroid parenchyma; however, nearly 50% of benign nodules also have this appearance. The hypoechogenicity of thyroid nodules is not a reliable sign of malignancy since the specificity and PPV are low (Kim et al., 2002; Wienke et al., 2003; Moon W.J. et al., 2008). Some studies have observed that marked hypoechogenicity was highly specific for diagnosing malignant nodules, but with low sensitivity. In this study, our findings are in accordance with previous studies. In addition, we also find that the predictive ability of marked hypoechogenicity was not relevant to nodular size.
Microcalcification is one of the most specific features of thyroid malignancy with a specificity of 71.0%–98.8% (Kakkos et al., 2000; Khoo et al., 2002; Kim et al., 2002; Papini et al., 2002; Reading et al., 2005; Cappelli et al., 2006; Hoang et al., 2007; Moon W.J. et al., 2008; Ahn et al., 2010). In histopathology, microcalcification is thought to represent psammoma bodies, which are 10–100 μm round laminar crystalline calcific deposits. Psammoma bodies are a typical finding in papillary carcinoma (Reading et al., 2005). In this study, microcalcifications were more commonly observed in malignant LNs than in malignant SNs. This result was similar to that of the Moon W.J. et al. (2008)’s study. However, in our study no significant difference was observed between benign LNs and SNs. Microcalcifications had a specificity of 87% and a sensitivity of 50% in SNs. In the LN group, the specificity increased to 95%, and the sensitivity increased to 70%. Therefore, microcalcifications may be more predictive of malignancy in LNs than in SNs.
The ratio of the nodular shape A/T≥1 is a reportedly characteristic and very specific feature of malignant thyroid nodules (Kim et al., 2002; Hoang et al., 2007; Moon W.J. et al., 2008; Ahn et al., 2010). This appearance may be due to the fact that malignant nodules grow across normal tissue planes, while benign nodules grow parallel to normal tissue planes (Kim et al., 2002; Hoang et al., 2007). In our study, we found that this feature was more sensitive in SNs than in LNs. Nearly 48% of malignant nodules with the maximal diameter not exceeding 10 mm had this feature, but only 8% of malignant nodules with the maximal diameter exceeding 10 mm had this feature.
There are many reports that have evaluated the diagnostic performance of Doppler ultrasound in the assessment of thyroid tumors. Some authors claimed that intranodular vascularity is useful for differentiating benign from malignant thyroid nodules (Papini et al., 2002; Chammas et al., 2005; Appetecchia and Solivetti, 2006), while others disagreed (Algin et al., 2010; Moon H.J. et al., 2010). Three main factors may account for this variability. First, lack of a standardized definition of vascularity patterns leads to a lack of objectivity. Some studies defined intranodular vascularity as blood flow within the nodule and neglected blood flow at the periphery (Papini et al., 2002; Moon H.J. et al., 2010), while other studies defined intranodular vascularity as more flow in the nodule than in the surrounding thyroid gland and more flow in the central part of the nodule than at the periphery (Chammas et al., 2005; Rago et al., 2007). Second, the sensitivity of Doppler ultrasound is affected by technical parameters such as settings of the wall filter, nodule depth, and pulse repetition frequency. Power Doppler imaging may be more sensitive than color-Doppler ultrasound for detecting the slow flow of small vessels (Moon W.J. et al., 2008). Finally, the participants were quite heterogeneous across studies. Some authors only investigated thyroid nodules larger than 10 mm (Brunese et al., 2008). In our study, we defined marked intranodular vascularity as more flow in the central part of the nodule than at the periphery (Fig. 6b), which resulted in a high specificity but a very low sensitivity. We found that the diagnostic accuracy was dependent on tumor size, in which marked intranodular vascularity was more commonly observed in LNs than in SNs in both malignant and benign nodules.
Recent studies demonstrated that ultrasound-based elastography could improve detection of malignant thyroid nodules with a high sensitivity and good specificity (Lyshchik et al., 2005; Rago et al., 2007; Asteria et al., 2008; Dighe et al., 2008; Rubaltelli et al., 2009; Bojunga et al., 2010). In our study, the NPV of sonoelastography was 91% in SNs and 96% in LNs, which could be useful in determining which nodules could be safely observed without biopsy. An elasticity score of 6 was observed exclusively in malignant nodules. If theses findings are confirmed in larger series, a score of 6 may be used as a reliable indicator for nodule biopsy. The A Z values of the sonoelastography in LNs and SNs were superior to those of other ultrasound features. As for nodule size, Rago et al. (2007) reported that the predictive ability of sonoelastographic measurement was independent of nodular size, with a sensitivity and specificity of 100% being observed in 9 nodules sizing from 8 to 10 mm. However, the sample size was too small to make an accurate conclusion. In our study, the distribution of elasticity scores showed no significant difference between malignant and benign in both LNs and SNs, and the predictive ability of sonoelastography was independent of nodular size.
As with any imaging technique, sonoelastography has its limitations. The elasticity of soft tissues depends to a large extent on their molecular building blocks (fat, collagen, etc.), and on the microscopic and macroscopic structural organization of these blocks (Ko et al., 2006). Pathologic changes are generally correlated with changes in tissue stiffness. Some benign nodules, such as subacute thyroiditis, nodules with coarse calcification or fibrosis, may have increased stiffness (Rago et al., 2007; Asteria et al., 2008; Hong et al., 2009; Rubaltelli et al., 2009; Bojunga et al., 2010). Thus, the false-positive results may increase, resulting in a specificity decrease. In the present study, the NPV was high (91% in SNs, 96% in LNs), but the PPV was moderate (79% in SNs, 69% in LNs). Second, not all nodules are amenable to sonoelastography. Sonoelastography cannot be performed on nodules with peripheral rim calcification, nodules with a large cystic component, nodules with a diameter of <5 mm and coalescent nodules (Lyshchik et al., 2005; Rago et al., 2007; Asteria et al., 2008; Dighe et al., 2008; Hong et al., 2009; Rubaltelli et al., 2009; Bojunga et al., 2010; Kagoya et al., 2010). Third, the overall quality of sonoelastography is dramatically affected by the decorrelation noise caused by the out-of-plane motion of the examined lesion under compression and the pulsation of the carotid artery (Lyshchik et al., 2005; Asteria et al., 2008; Rubaltelli et al., 2009; Bojunga et al., 2010). In addition, the neck contains a wide range of structures in relatively narrow compartments. Therefore, elastographic imaging of the thyroid gland will require more training to achieve optimal images for diagnosis (Hong et al., 2009; Kagoya et al., 2010).
There are several limitations in this study. First, since 116 of 121 (96%) malignancies were papillary thyroid carcinoma, this study predominantly reflects sonographic and sonoelastographic features of papillary thyroid carcinoma. Second, all sonographic evaluations were performed by one investigator, so we were unable to investigate interobserver agreement for the diagnosis of malignant thyroid nodules using conventional B-mode ultrasound and real-time freehand ultrasound elastography. Park et al. (2009) suggested that conventional ultrasound features such as echogenicity, margin, and elastography do not present reliable interobserver agreement for the diagnosis of malignant thyroid nodules. Third, the general applicability of this study is limited due to selection bias since not all nodules were FNAB. This study included patients referred for surgery and had a high percentage of malignant thyroid nodules (37%). Most studies show an incidence of malignancy of 2%–5% in nodules selected for biopsy, with a much lower incidence in unselected nodules (Cooper et al., 2006).
In conclusion, the predictive values of microcalcifications, nodular margins, A/T ratio, and marked intranodular vascularity depend on nodule size, but the predictive values of echogenicity and elastography do not.
References
- 1.Ahn SS, Kim EK, Kang DR, Lim SK, Kwak JY, Kim MJ. Biopsy of thyroid nodules: comparison of three sets of guidelines. Am J Roentgenol. 2010;194(1):31–37. doi: 10.2214/AJR.09.2822. [DOI] [PubMed] [Google Scholar]
- 2.Algin O, Algin E, Gokalp G, Ocakoğlu G, Erdoğan C, Saraydaroglu O, Tuncel E. Role of Duplex power Doppler ultrasound in differentiation between malignant and benign thyroid nodules. Korean J Radiol. 2010;11(6):594–602. doi: 10.3348/kjr.2010.11.6.594. [DOI] [PMC free article] [PubMed] [Google Scholar]
- 3.Appetecchia M, Solivetti FM. The association of colour flow Doppler sonography and conventional ultrasonography improves the diagnosis of thyroid carcinoma. Horm Res. 2006;66(5):249–256. doi: 10.1159/000096013. [DOI] [PubMed] [Google Scholar]
- 4.Asteria C, Giovanardi A, Pizzocaro A, Cozzaglio L, Morabito A, Somalvico F, Zoppo A. US-elastography in the differential diagnosis of benign and malignant thyroid nodules. Thyroid. 2008;18(5):523–531. doi: 10.1089/thy.2007.0323. [DOI] [PubMed] [Google Scholar]
- 5.Bojunga J, Herrmann E, Meyer G, Weber S, Zeuzem S, Friedrich-Rust M. Real-time elastography for the differentiation of benign and malignant thyroid nodules: a meta-analysis. Thyroid. 2010;20(10):1145–1150. doi: 10.1089/thy.2010.0079. [DOI] [PubMed] [Google Scholar]
- 6.Brunese L, Romeo A, Iorio S, Napolitano G, Fucili S, Biondi B, Vallone G, Sodano A. A new marker for diagnosis of thyroid papillary cancer: B-flow twinkling sign. J Ultrasound Med. 2008;27(8):1187–1194. doi: 10.7863/jum.2008.27.8.1187. [DOI] [PubMed] [Google Scholar]
- 7.Cappelli C, Castellano M, Pirola I, Gandossi E, de Martino E, Cumetti D, Agosti B, Rosei EA. Thyroid nodule shape suggests malignancy. Eur J Endocrinol. 2006;155(1):27–31. doi: 10.1530/eje.1.02177. [DOI] [PubMed] [Google Scholar]
- 8.Chammas MC, Gerhard R, de Oliveria IR, Widman A, de Barros N, Durazzo M, Ferraz A, Cerri GG. Thyroid nodules: evaluation with power Doppler and duplex Doppler ultrasound. Otolaryngol Head Neck Surg. 2005;132(6):874–882. doi: 10.1016/j.otohns.2005.02.003. [DOI] [PubMed] [Google Scholar]
- 9.Cooper DS, Doherty G, Haugen BR, Kloos RT, Lee SL, Mandel SJ, Mazzaferri EL, Mclver B, Sherman SI, Tuttle RM, et al. Management guidelines for patients with thyroid nodules and differentiated thyroid cancer. Thyroid. 2006;16(2):109–142. doi: 10.1089/thy.2006.16.109. [DOI] [PubMed] [Google Scholar]
- 10.Cooper DS, Doherty GM, Haugen BR, Kloos RT, Lee SL, Mandel SJ, Mazzaferri EL, McIver B, Pacini F, Schlumberger M, et al. Revised American thyroid association management guidelines for patients with thyroid nodules and differentiated thyroid cancer. Thyroid. 2009;19(11):1167–1214. doi: 10.1089/thy.2009.0110. [DOI] [PubMed] [Google Scholar]
- 11.Dighe M, Bae U, Richardson ML, Dubinsky TJ, Minoshima S, Kin Y. Differential diagnosis of thyroid nodules with US elastography using carotid artery pulsation. Radiology. 2008;248(2):662–668. doi: 10.1148/radiol.2482071758. [DOI] [PubMed] [Google Scholar]
- 12.Ezzat S, Sarti DA, Cain DR, Braunstein GD. Thyroid incidentalomas: prevalence by palpation and ultrasonography. Arch Intern Med. 1994;154(16):1838–1840. doi: 10.1001/archinte.154.16.1838. [DOI] [PubMed] [Google Scholar]
- 13.Frates MC, Benson CB, Doubilet PM, Kunreuther E, Contreras M, Cibas ES, Orcutt J, Moore FD, Jr, Larsen PR, Marqusee E, et al. Prevalence and distribution of carcinoma in patients with solitary and multiple thyroid nodules on sonography. J Clin Endocrinol Metab. 2006;91(9):3411–3417. doi: 10.1210/jc.2006-0690. [DOI] [PubMed] [Google Scholar]
- 14.Hoang JK, Lee WK, Lee M, Johnson D, Farrell S. US features of thyroid malignancy: pearls and pitfalls. Radiographics. 2007;27(3):847–860. doi: 10.1148/rg.273065038. [DOI] [PubMed] [Google Scholar]
- 15.Hong Y, Liu X, Li Z, Zhang X, Chen M, Luo Z. Real-time ultrasound elastography in the differential diagnosis of benign and malignant thyroid nodules. J Ultrasound Med. 2009;28(7):861–867. doi: 10.7863/jum.2009.28.7.861. [DOI] [PubMed] [Google Scholar]
- 16.Kagoya R, Monobe H, Tojima H. Utility of elastography for differential diagnosis of benign and malignant thyroid nodules. Otolaryngol Head Neck Surg. 2010;143(2):230–234. doi: 10.1016/j.otohns.2010.04.006. [DOI] [PubMed] [Google Scholar]
- 17.Kakkos SK, Scopa CD, Chalmoukis AK, Karachalios DA, Spiliotis JD, Harkoftakis JG, Karavias DD, Androulakis JA, Vagenakis AG. Relative risk of cancer in sonographically detected thyroid nodules with calcifications. J Clin Ultrasound. 2000;28(7):347–352. doi: 10.1002/1097-0096(200009)28:7<347::AID-JCU5>3.3.CO;2-F. [DOI] [PubMed] [Google Scholar]
- 18.Khaled W, Reichling S, Bruhns OT, Emert H. Ultrasonic strain imaging and reconstructive elastography for biological tissue. Ultrasonics. 2006;44(s1):e199–e202. doi: 10.1016/j.ultras.2006.06.007. [DOI] [PubMed] [Google Scholar]
- 19.Khoo ML, Asa SL, Witterick IJ, Freeman JL. Thyroid calcification and its association with thyroid carcinoma. Head Neck. 2002;24(7):651–655. doi: 10.1002/hed.10115. [DOI] [PubMed] [Google Scholar]
- 20.Kim EK, Park CS, Chung WY, Oh KK, Kim DI, Lee JT, Yoo HS. New sonographic criteria for recommending fine-needle aspiration biopsy of nonpalpable solid nodules of the thyroid. Am J Roentgenol. 2002;178(3):687–691. doi: 10.2214/ajr.178.3.1780687. [DOI] [PubMed] [Google Scholar]
- 21.Ko HJ, Tan W, Stack R, Boppart SA. Optical coherence elastography of engineered and developing tissue. Tissue Eng. 2006;12(1):63–73. doi: 10.1089/ten.2006.12.63. [DOI] [PubMed] [Google Scholar]
- 22.Lee TI, Yang HJ, Lin SY, Lee MT, Lin HD, Braverman LE, Tang KT. The accuracy of fine-needleaspiration biopsy and frozen section in patients with thyroid cancer. Thyroid. 2002;12(7):619–626. doi: 10.1089/105072502320288492. [DOI] [PubMed] [Google Scholar]
- 23.Lyshchik A, Higashi T, Asato R, Tanaka S, Ito J, Mai JJ, Pellot-Barakat C, Insana MF, Brill AB, Saga T, et al. Thyroid gland tumor diagnosis at US elastography. Radiology. 2005;237(1):202–211. doi: 10.1148/radiol.2363041248. [DOI] [PubMed] [Google Scholar]
- 24.Moon HC, Jung EJ, Park ST, Ha WS, Choi SK, Hong SC, Lee YJ, Joo YT, Jeong CY, Choi DS, et al. Role of ultrasonography in predicting malignancy in patients with thyroid nodules. World J Surg. 2007;31(7):1410–1416. doi: 10.1007/s00268-007-9013-7. [DOI] [PubMed] [Google Scholar]
- 25.Moon HJ, Kwak JY, Kim MJ, Son EJ, Kim EK. Can vascularity at Power Doppler US help predict thyroid malignancy? Radiology. 2010;255(1):260–269. doi: 10.1148/radiol.09091284. [DOI] [PubMed] [Google Scholar]
- 26.Moon WJ, Jung SL, Lee JH, Na DG, Baek JH, Lee YH, Kim J, Kim HS, Byun JS, Lee DH, et al. Benign and malignant thyroid nodules: US differentiation—multicenter retrospective study. Radiology. 2008;247(3):762–770. doi: 10.1148/radiol.2473070944. [DOI] [PubMed] [Google Scholar]
- 27.Papini E, Guglielmi R, Bianchini A, Crescenzi A, Taccogna S, Nardi F, Panunzi C, Rinaldi R, Toscano V, Pacella CM. Risk of malignancy in nonpalpable thyroid nodules: predictive value of ultrasound and color-Doppler features. J Clin Endocrinol Metab. 2002;87(5):1941–1946. doi: 10.1210/jc.87.5.1941. [DOI] [PubMed] [Google Scholar]
- 28.Park SH, Kim SJ, Kim EK, Kim MJ, Son EJ, Kwak JY. Interobserver agreement in assessing the sonographic and elastographic features of malignant thyroid nodules. Am J Roentgenol. 2009;193(5):W416–W423. doi: 10.2214/AJR.09.2541. [DOI] [PubMed] [Google Scholar]
- 29.Pelizzo MR, Boschin IM, Toniato A, Piotto A, Bernante P, Pagetta C, Rampin L, Rubello D. Papillary thyroid microcarcinoma (PTMC): prognostic factors, management and out come in 403 patients. Eur J Surg Oncol. 2006;32(10):1144–1148. doi: 10.1016/j.ejso.2006.07.001. [DOI] [PubMed] [Google Scholar]
- 30.Rago T, Santini F, Scutari M, Pinchera A, Vitti P. Elastography: new developments in ultrasound for predicting malignancy in thyroid nodules. J Clin Endocrinol Metab. 2007;92(8):2917–2922. doi: 10.1210/jc.2007-0641. [DOI] [PubMed] [Google Scholar]
- 31.Reading CC, Charboneau JW, Hay ID, Sebo TJ. Sonography of thyroid nodules: a “classic pattern” diagnostic approach. Ultrasound Q. 2005;21(3):157–165. doi: 10.1097/01.ruq.0000174750.27010.68. [DOI] [PubMed] [Google Scholar]
- 32.Rubaltelli L, Stramare R, Tregnahi A, Scagliori E, Cecchelero E, Mannucci M, Gallinaro E, Beltrame V. The role of sonoelastography in the differential diagnosis of neck nodules. J Ultrasound. 2009;12(3):93–100. doi: 10.1016/j.jus.2009.05.001. [DOI] [PMC free article] [PubMed] [Google Scholar]
- 33.Samaan NA, Schultz PN, Hickey RC, Goepfert H, Haynie TP, Johnston DA, Ordonz NG. The results of various modalities of treatment of well differentiated thyroid carcinomas: a retrospective review of 1559 patients. J Clin Endocrinol Metab. 1992;75(3):714–720. doi: 10.1210/jc.75.3.714. [DOI] [PubMed] [Google Scholar]
- 34.Wienke JR, Chong WK, Fielding JR, Zou KH, Mittelstaedt CA. Sonographic features of benign thyroid nodules: interobserver reliability and overlap with malignancy. J Ultrasound Med. 2003;22(10):1027–1031. doi: 10.7863/jum.2003.22.10.1027. [DOI] [PubMed] [Google Scholar]


