

Abstract
IrIII–porphyrins are a relatively new group of phosphorescent dyes that have potential for oxygen sensing and labeling of biomolecules. The requirement of two axial ligands for the IrIII ion permits simple linkage of biomolecules by a one-step ligand-exchange reaction, for example, using precursor carbonyl chloride complexes and peptides containing histidine residue(s). Using this approach, we produced three complexes of IrIII–octaethylporphyrin with cell-penetrating (Ir1 and Ir2) and tumor-targeting (Ir3) peptides and studied their photophysical properties. All of the complexes were stable and possessed bright, long-decay (unquenched lifetimes exceeding 45 μs) phosphorescence at around 650 nm, with moderate sensitivity to oxygen. The Ir1 and Ir2 complexes showed positive staining of a number of mammalian cell types, thus demonstrating localization similar to endoplasmic reticulum and ATP- and temperature-independent intracellular accumulation (direct translocation mechanism). Their low photo- and cytotoxicity allows intracellular oxygen to be probed.
Keywords: cell-penetrating peptide, cellular oxygen sensing, histidine ligands, Ir–porphyrin complexes, phosphorescence quenching
Introduction
Molecular oxygen (O2) is one of the key metabolites and functional parameters of live cells and tissues that reflects their respiration activity, mitochondrial function, and oxygenation state.1, 2 Numerous methods for direct and indirect assessment of O2 in the cell and tissue were proposed, which include Clark (micro)electrodes,3, 4 electron paramagnetic resonance (EPR),5, 6 optical sensing,4, 7, 8 and special “hypoxia” probes (HIF constructs, nitroimidazoles, etc.).9 In recent years, new methods for minimally invasive sensing of intracellular O2 (icO2) were introduced which use nitroxyl and esterified trityl (triarylmethyl) radicals,5, 6, 10, 11 O2-sensitive genetically encoded GFP constructs,12 endogenous mitochondrial protoporphyrin IX,13, 14 Ir-BTP, Ru–polypirydyl, or Pt– and Pd–porphyrin probes based on cell-penetrating peptide(s) or nanoparticles.15–27
Planar PtII and PdII complexes of porphyrin dyes exhibit strong phosphorescence at room temperature which is readily quenched by O2.28 Characteristic spectral properties of such compounds allow their use in different O2-sensing materials and detection modalities, including time-resolved fluorescence/phosphorescence,29 phosphorescence quenching microscopy/FLIM,30–32 or ratiometric detection.22, 33 With the development of cell-targeting vectors34–36 and nanoparticle technology,37, 38 intracellular delivery of such sensors has become possible. Thus, PtCP conjugates with oligoarginine or bactenecin 7 peptides, or PtTFPP and PtOEP dyes embedded in positively charged nanoparticles (with or without additional cell-penetrating coating) were found useful for biological and physiological studies.17–21, 24 At the same time, mechanisms of their transport into the cell and control of intracellular localization and fate remain poorly understood and require further investigation of structure–activity relationships.
IrIII–porphyrins represent a relatively new group of phosphorescent dyes39 which have not been explored in detail to date. The six-coordination geometry of the IrIII central atom makes these dyes attractive for synthesis of new supramolecular structures. The tetrapyrrole macrocycle occupies four coordination sites, while the remaining two axial sites can be used to introduce nitrogen-containing heterocycles such as pyridine and imidazole.39 This can be used to design new indicator dyes and supramolecular structures with attractive features and spectral properties similar to those of Pt–porphyrins.
In this study, we further develop this synthetic approach by attaching short peptide sequences to the Ir–octaethylporphyrin (Ir–OEP) via histidine residues (structural analogues of imidazoles). These complexes were then characterized spectroscopically and tested on a number of different cell lines with the aim of producing new phosphorescent probes with cell permeating and/or binding capabilities.
Results and Discussion
Synthesis of the conjugates
Previously, several complexes with nitrogen-containing heterocycles were prepared by using Ir–OEP–CO-Cl as a precursor dye and simple ligand-exchange reactions (Figure 1) in 2-ethoxyethanol, which at elevated temperature dissolves both the hydrophobic dye and polar ligands (e.g., carboxyimidazole).39 A similar strategy was applied to couple the Ir–OEP–CO-Cl with short peptide sequences via their histidine residues. This method also allows for synthesis of mono- and hetero-substituted IrIII–porphyrins; however, in this study, we mainly focused on symmetric disubstituted Ir–OEP derivatives (Table 1).
Figure 1.

Structures and electronic spectra of the new Ir–OEP complexes. Starting from Ir–OEP–CO-Cl, the complexes were obtained by treatment with histidine-containing peptides (top). Absorption and emission spectra of Ir1and a photographic image of the bright red emission in deoxygenated solution under 405 nm LED excitation.
Table 1.
Photophysical properties for the synthesized conjugates
| Conjugate | MW [g mol−1] | Charge | λabs max [nm] | λem max [nm] | Q.Y. | τ0 [μs] |
|---|---|---|---|---|---|---|
| Ir1 | 2282.8 | +9 | 386, 506, 540 | 654 | 0.13,[a] 0.16[b] | 58 |
| Ir2 | 2154.7 | +3 | 388, 508, 539 | 652 | 0.08,[a] 010[b] | 69 |
| Ir3 | 1804.1 | +1 | 386, 507, 540 | 654 | 0.13,[a] 0.15[b] | 47 |
In PBS.
In PBS with 10 % FBS.
Based on our recent studies with peptide conjugates of coproporphyrin dyes (PtCP, PdCP, CPK),17, 18 we decided to prepare Ir–OEP complexes with two peptide structures which were expected to provide cell-penetrating ability for the resulting complexes: 1) histidine-tetraarginine, HR4 (Ir1), and 2) a truncated fragment of cell-penetrating bactenecin 7 peptide, PRPLP (Ir2). In addition, a complex containing an RGD sequence (known for its ability to bind to tumor cell membranes40) was prepared (Ir3). Structures of these complexes are presented in Figure 1. Notably, all of the peptides were amidated at the C terminus in order to retain the positive charge of the complexes and were soluble in 2-ethoxyethanol.
The ligand-exchange reaction performed at elevated temperature produced a characteristic hypsochromic shift in the porphyrin absorption spectrum,39 thus indicating formation of the complexes, which were then purified by RP-HPLC. Confirmation of purity and molecular structure of the complexes by 1H NMR, HPLC, and MS can be found in Figures S1 and S2 in the Supporting Information. After purification, the conjugates were stored in DMSO or water in the dark at 4 °C and were stable for several months. Conversely, when a peptide without a histidine residue (R4) was used, no changes in the absorption of Ir—OEP–CO-Cl and no complex formation were observed, even after prolonged 48 h incubation (results not shown).
Spectral properties and O2 sensitivity
Absorption and emission spectra of the three peptide conjugates were found to be similar (Figure 1). High resemblance to Pt–porphyrins can be seen,18 with the Soret band at around 386 nm, Q-bands at 506 and 540 nm, and peptide absorption in the UV region. The conjugates were readily soluble in aqueous solutions; their phosphorescence was not affected by the common media, serum, and additives used in cell culture (Table 1), and quantum yields in deoxygenated solutions ranged from 8 to 16 %, which is comparable to Pt–porphyrins.28 Red, long-decay emission of these complexes allows for their sensitive detection by time-resolved fluorimetry (Figure S3). Thus, on a standard microplate TR-F reader (Victor 2), the conjugate Ir1 was detectable at concentrations as low as 1 nm in both deoxygenated and oxygenated solutions (Figure S4). Quenched lifetimes for the complexes in air-saturated solutions were at the lower end of instrument time resolution (limited by Xe flash lamp with a pulse duration of about 10 μs). However, reliable sensing of O2 on such instruments by using the rapid lifetime determination (RLD) method41 was still possible over the O2 range 0–250 μm (0–21 % atmospheric O2) (Figure S3 B). Interestingly, Ir2 showed the longest decay time (69 μs) but the lowest quantum yield.
The stability of Ir1 was assessed by exposing it to a competing ligand in aqueous solution. When Ir1 was incubated in PBS with a tenfold molar excess of free histidine for 24 h at 37 °C, no changes on the HPLC chromatogram (no additional peaks) were seen (not shown). This proves that under physiological conditions, dissociation or substitution of the peptide ligands in such complexes is insignificant.
Cell staining properties of the Ir conjugates
The cell-penetrating ability of Ir1 and Ir2 probes was tested using MEF cells as a model. At concentrations of 1–10 μm and incubation times from 6–16 h, both probes demonstrated efficient staining of the cells, accumulating in perinuclear regions and partially colocalizing with the marker for endoplasmic reticulum, ER Tracker Green (Figure 2). Such intracellular localization differs from that of similar peptides conjugated to PtCP dye via its peripheral propionic acid residues.17–19 Notably, Ir2 demonstrated a small degree of aggregation on the cell surface.
Figure 2.

Staining of cells with Ir1, Ir2, and Ir3 probes. A), C), E), and F) brightfield and fluorescent images of MEF, B) HeLa, and D) SH-SY5Y cells. Ir–OEP phosphorescence (red) was recorded by using a 390 nm excitation and 650 nm emission filter set, and ER Tracker Green fluorescence (green) using 490 nm excitation and 530 nm emission filters. Scale bars=50 μm.
Conjugates Ir1 and Ir2 were further tested in COS-7, HeLa, SH-SY5Y, and PC12 cell lines and with mixed cultures of primary neurons and astrocytes. Positive cytoplasmic staining was observed for all of these cell lines (Figure S5). Such cell specificity of Ir1 and Ir2 probes is significantly higher than for the other O2 probes, for which staining of SH-SY5Y and primary neuronal cells was low (RID, unpublished data). This also suggests that Ir1 and Ir2 employ different mechanisms of endocytosis or, perhaps, direct translocation through the plasma membrane (temperature- and ATP-independent35, 42–44).
To evaluate the cell entry mechanism as possible direct translocation, additional experiments were carried out. First, monitoring of kinetics of intracellular accumulation demonstrated that probe internalization was completed in about 3–6 h (see Ir1 data in Figure 3). This enables analysis of cell loading at low temperatures or upon ATP depletion. ATP depletion was induced by removing glucose from the medium and adding oligomycin (thus blocking both glycolysis and oxidative phosphorylation2). Under these conditions, we still saw efficient cell staining with Ir1 and Ir2, although cell appearance changed significantly (Figure S6). At low temperature (4 instead of 37 °C), when endocytosis occurs more slowly,45 we also observed faint intracellular staining with Ir1 and Ir2 (Figure S6). Based on these results, and considering that probe diffusion is also decreased at low temperature, we concluded that Ir1 and Ir2 utilize a direct translocation mechanism. Endocytosis-dependent cellular uptake is a commonly reported mechanism for oligoarginine and proline-rich peptide structures.44, 46–48 In this case, the internalized conjugate must undergo endosomal escape to reach the cytoplasm or other cellular organelles.49 We investigated cell loading in the presence of concanamycin A, an inhibitor of V-ATPase and lysosomal function, and observed a minor effect on Ir1 localization and a more profound effect on Ir2 (Figure S6). These data indicate that, even if these probes use endocytosis mechanism of cell entry, their escape from the endosomes is insignificant.
Figure 3.
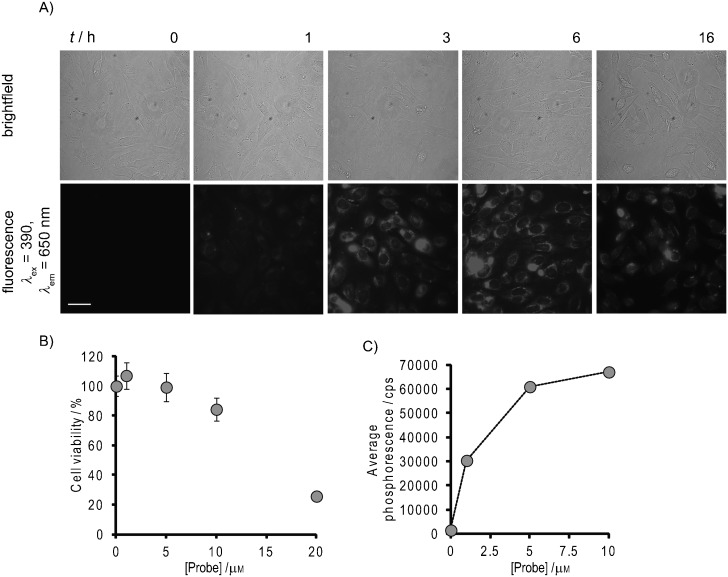
Time and concentration-dependence of cell staining and changes in cell viability for the Ir1 complex with MEF cells. A) Cells were incubated with the complex (10 μm) for the time indicated, washed, and analyzed by microscopy (brightfield and fluorescent images). Scale bars=50 μm. B) Changes in viability (total cellular ATP) measured after exposing the cells to Ir1 (0–20 μm) for 16 h. C) Average phosphorescence intensity signals from cells stained with Ir1 (0–10 μm).
The Ir3 probe, which contains tumor-cell-targeting vector (RGD peptide), was tested for interaction with two cancer cell lines, HeLa and SH-SY5Y. After 1 h incubation with 5 μm of Ir3, we observed no detectable staining of the cells (Figure 2). This lack of binding functionality of the RGD sequences attached to the Ir–OEP moiety could be due to a number of factors, including steric factors, the positive charge on the adjacent IrIII ion, or the hydrophobicity of the porphyrin core. On the other hand, the absence of cell staining by Ir3 confirms the essential role of cell-penetrating peptide moieties in intracellular delivery of the Ir1 and Ir2 probes.
Application of Ir1 to intracellular O2 sensing
Efficient uptake of Ir1 and Ir2 by the cells allows for their use in sensing intracellular O2 (icO2). Photostability of these Ir–OEP-based probes is moderate and similar to that of PtCP conjugates. Unlike the highly photostable PtPFPP-based probes,20 the Ir–OEP probes are not very suitable for luminescence microscopy and FLIM applications but look promising for icO2 sensing experiments in RLD mode performed on TR-F readers in a similar manner as to other O2 probes.17, 19, 50, 51
We first tested the Ir1 probe for possible toxic effects on MEF cells after 16 h of loading and found that at 20 μm its toxicity was high, but at 10 μm and below it was minimal (Figure 3 B). Figure 3 C shows that probe concentrations of 5–10 μm produce high phosphorescent signals with cells (50 000–60 000 cps at a delay time of 30 μs). The Ir1 probe was then calibrated with non-respiring MEF cells (at a staining concentration of 10 μm) with dissolved O2 ranging from 0 to 200 μm (Figure 4 C). The calibration data points (lifetimes ranging from ∼18–40 μs) were fitted with the following analytical function (R2=0.9865):
Figure 4.

Sensing of icO2 in MEF cells with Ir1 probe. A) Phosphorescence lifetime (τ) calibrations in non-respiring MEF cells (probe in solution without cells is also shown; 21 % O2 corresponds to 200 μm dissolved O2). B) Stern–Volmer plot for Ir1 with non-respiring MEF cells. C) Relative deoxygenation of respiring cells in samples exposed to various levels of external pO2. D) Profiles of icO2 in MEF cells stained with Ir1 at rest and upon metabolic stimulation. E) and F) Raw phosphorescence lifetime (τ) and intensity respiration profiles of (D). The long bar shows the first treatment with FCCP or DMSO, the short bar shows the second treatment with AntA.
| (1) |
where [O2] is expressed in μm and τ in μs. The Stern–Volmer plots showing clear non-linearity (Figure 4 B) were fitted with the two-site model (see ref. 52 and Equation (2)), from which the following model parameters were determined: F=0.6; KSV1=0.074; KSV2=0.00027 (r2>0.999). Generally, KSV2 is significantly smaller than KSV1 (KSV1>KSV2×100); this indicates that one fraction of the probe is more easily accessible by oxygen than the other. Such behavior is not unusual for biological samples.8, 53
| (2) |
Relative deoxygenation of cells at different levels of external (atmospheric) hypoxia was calculated from calibration Equation (1) (Figure 4 C). One can see that when dissolved O2 is ≤50 μm, the cells are almost completely (>90 %) deoxygenated. Compared to the data obtained by Fercher et al. for the PtPFPP–RL100 probe (undefined intracellular location),20 our data show lower cell deoxygenation at similar concentrations of dissolved O2. This may be explained by the differences in intracellular localization between the Ir1 and PtPFPP–RL100 probes (i.e., PtPFPP is located closer to the mitochondria) and the possible existence of an intracellular O2 gradient, or by lower respiration activity in MEF cells stained with the Ir1 conjugate. Indeed, with moderate toxicity at 10 μm concentration, the oxidative phosphorylation activity can be compromised.
We also monitored O2 in MEF cells loaded with 5 μm of Ir1 in glucose(−)/galactose(+) medium exposed to hypoxic conditions (8 % ambient O2) and stimulated with 2 μm FCCP (uncoupler) and 10 μm antimycin A (ETC inhibitor) (Figure 4 D). In this case, basal O2 in resting cells of about 8–5 μm was reduced to ∼0.5 μm upon FCCP stimulation and increased to 20 μm upon AntA treatment (reoxygenation due to stopped respiration). The addition of DMSO (carrier) did not produce a significant response. Raw oxygenation profiles (in phosphorescence lifetime and intensity scales) corresponding to cellular respiration are shown in Figure 4 E and F.
Conclusion
Overall, this study demonstrated that stable 1:2 complexes of Ir–porphyrins with peptides bearing histidine residues can be prepared by a simple and flexible ligand exchange procedure. With the examples of two cell-penetrating and one tumor-targeting peptides, we showed the flexibility of this methodology, which can be extended to other biologically relevant structures. The resulting complexes displayed good solubility in aqueous media, showing bright phosphorescence and unquenched lifetimes above 40 μs. The Ir1 and Ir2 probes showed cell-penetration ability that involves a direct translocation mechanism, broad cell specificity, and efficient staining of different cell lines. Their intracellular distribution was close to the endoplasmic reticulum. Such probes represent useful tools for O2 sensing and particularly for real-time monitoring of icO2, which can be realized on existing commercial TR-F readers or, with additional modifications, in ratiometric intensity-based detection formats. However, moderate photostability limits their use in O2 imaging.
Experimental Section
Materials: Luminescent cell viability kit CellTiter-Glo was from Promega (Madison, WI, USA), fluorescent probe ER Tracker Green was from Invitrogen (Bio Sciences, Dun Laoghaire, Ireland). Standard 96-well cell culture and white 96-well plates (for CellTiter Glo Kit) were purchased from Greiner Bio-One (Frickenhausen, Germany). Glass-bottom multi-well inserts were from Ibidi (Martinsried, Germany). All other reagents were from Sigma–Aldrich Ltd. (Dublin, Ireland). Peptides with C-terminal amidation and confirmed structure (MS) and purity (HPLC) were from GenScript (Piscataway, NJ, USA).
Synthesis and characterization of conjugates Ir1, Ir2 and Ir3: Ir–OEP–CO-Cl (2–3 μmol, produced as described in refs. 39, 54) and the peptide (4–5 equiv) were added to a screw-cap glass vial, dissolved in 2-ethoxyethanol (2 mL), incubated at 75 °C for 1 h, and then left to react overnight at 60 °C. After the absorption band corresponding to Ir–OEP–CO-Cl at 550 nm was no longer visible, the reaction was stopped and the solvent removed. Next, water (2 mL) was added to the dry red residue, and the solution was sonicated for 15 min, followed by removal of the insoluble fraction by centrifugation. The water-soluble fraction was purified by HPLC (Agilent 1100 Series) on a semi-preparative column VP 250/10 Nucleodur 100–5 RP-C18 using a 0.1 % aqueous acetic acid/MeOH gradient. Typical product yield after purification was 30±5 %. 1H NMR spectra were recorded in D2O on a 300 MHz spectrometer from Brucker. Mass spectrometric analysis was carried out on a triple quadrupole API 2000 mass spectrometer (Applied Biosystems/Sciex, Concord, Canada) equipped with a positive electrospray ionization (ESI) interface under full-scan mode (200–1800 amu).
Photophysics and phosphorescence lifetime measurements: Absorption spectra were recorded on an 8453 UV/Vis diode-array spectrophotometer (Agilent), and luminescence spectra were collected on a LS50B spectrometer (PerkinElmer). Absolute quantum yields of emission were measured on a Horiba FluoroLog3 (http://www.horiba.com) equipped with a Quanta-phi integrating sphere. Quantum yields in PBS containing 10 % fetal bovine serum were measured under oxygen-free conditions as described in ref. 17.
Phosphorescence lifetimes were assessed on a Cary Eclipse fluorescence spectrometer (Varian-Agilent) with 380 nm excitation, 650 emission, and 30 μs delay time. For rapid lifetime determination on a Victor 2 reader (PerkinElmer), the “time-resolved fluorescence” mode was used, with D340 excitation and D642 emission filters, measuring at two delay times (t1=30 μs and t2=40 μs) with a gate time of 100 μs and a total counting cycle of 1 s. Phosphorescence lifetime (τ) was calculated according to Equation (3)
| (3) |
where F1 and F2 correspond to TR-F readings at delay times t1 and t2.
Cell culture: Mouse embryonic fibroblasts (MEFs), African green monkey kidney (COS-7), human epithelial carcinoma (HeLa), human neuroblastoma (SH-SY5Y), and rat pheochromocytoma (PC12) cells from ATCC (Manassas, VA, USA) were cultured as described previously, using DMEM supplemented with 10 %FBS (for MEF, COS-7, HeLa, and SH-SY5Y cells) or RPMI1640 supplemented with horse serum and FBS (for PC12 cells) media and collagen-poly-D-lysine coated glass bottom minidishes (for microscopy analysis) or collagen IV-coated 96-well plates (for plate reader measurements). Primary neurons from rat brain were kindly provided by Dr. Y. Nolan (Anatomy Department, UCC). Cell viability was assessed by measuring total cellular ATP with a CellTiter-Glo luminescent kit (Promega), according to manufacturer's recommendations.
Live cell microscopy was performed on a fluorescent microscope Axiovert 200 (Carl Zeiss, Goettingen, Germany) equipped with an LED excitation module (LaVision GmbH, Goettingen, Germany). An UV LED (390 nm) and PtCP filter cube (λex=390/40 nm, λem=655/40 nm) were used for imaging the Ir–porphyrins. Cells were incubated with Ir1 and Ir2, typically for 6–16 h, then washed three times, counterstained with ER Tracker Green (1 μm, 30 min), washed again, and imaged. For ATP depletion experiments, cells were incubated in glucose-free DMEM supplemented with 10 % FBS, galactose (10 mm), sodium pyruvate (1 mm), and HEPES (20 mm), pH 7.2 for 1.5 h, then with oligomycin (10 μm) for 0.5 h, followed by staining with Ir1 and Ir2 (10 μm concentration) for 6 h in this medium and fluorescence microscopy imaging.
Phosphorescence lifetime measurements were conducted on a Victor 2 plate reader as described above. For probe calibration and monitoring of oxygenation under graded hypoxia, cells stained with Ir1 (10 μm, 16 h) were exposed to different levels of atmospheric O2 in a glove box (Coy Scientific), with 60 min pre-incubation and 30–60 min measurement at each O2 concentration in the presence of antimycin A (10 μm). To achieve 0 % O2, a solution containing glucose (100 mm) and glucose oxidase (50 μg mL−1, Sigma G7141) was added to the cells (1/10 of the volume) exposed to 1–2 % O2. For stimulation experiments, 10× stock solutions of effectors were added during measurement to produce the indicated final concentrations. Relative cell oxygenation was calculated as described previously55 using phosphorescence lifetime data obtained with respiring and non-respiring (antimycin A-treated) cells under the same ambient O2 concentrations.
Data assessment: The results of plate reader experiments were processed in Microsoft Excel and Origin 6.0 for fitting the calibration. The data represent average values with standard deviations shown as error bars. To ensure consistency, all experiments were performed in triplicate.
Acknowledgments
This work was supported by the Science Foundation Ireland, grant 07/IN.1/B1804 and the Austrian Science Fund (FWF; Research Project No. P21 192-N17). Authors thank Dr. Yvonne Nolan and Ian O'Brien (Anatomy Department, UCC) for the help with isolation of rat primary neurons, and Prof. Xinghua Guo, Tobias Burger, Jana Rentner and Stefan Gamper from the TU Graz for technical assistance.
Supplementary material
Detailed facts of importance to specialist readers are published as ”Supporting Information”. Such documents are peer-reviewed, but not copy-edited or typeset. They are made available as submitted by the authors.
References
- 1.Sanden T, Persson G, Thyberg P, Blom H, Widengren J. Anal. Chem. 2007;79:3330–3341. doi: 10.1021/ac0622680. [DOI] [PubMed] [Google Scholar]
- 2.Brand MD, Nicholls DG. Biochem. J. 2011;435:297–312. doi: 10.1042/BJ20110162. [DOI] [PMC free article] [PubMed] [Google Scholar]
- 3.Wu C-C, Luk H-N, Lin Y-TT, Yuan C-Y. Talanta. 2010;81:228–234. doi: 10.1016/j.talanta.2009.11.062. [DOI] [PubMed] [Google Scholar]
- 4.Foster KA, Galeffi F, Gerich FJ, Turner DA, Müller M. Prog. Neurobiol. 2006;79:136–171. doi: 10.1016/j.pneurobio.2006.07.001. [DOI] [PMC free article] [PubMed] [Google Scholar]
- 5.Liu Y, Villamena FA, Sun J, Wang T-y, Zweier JL. Free Radical Biol. Med. 2009;46:876–883. doi: 10.1016/j.freeradbiomed.2008.12.011. [DOI] [PMC free article] [PubMed] [Google Scholar]
- 6.Bobko AA, Dhimitruka I, Eubank TD, Marsh CB, Zweier JL, Khramtsov VV. Free Radical Biol. Med. 2009;47:654–658. doi: 10.1016/j.freeradbiomed.2009.06.007. [DOI] [PMC free article] [PubMed] [Google Scholar]
- 7.Wang X-d, Chen H-x, Zhao Y, Chen X, Wang X-r. Trends Anal.Chem. 2010;29:319–338. [Google Scholar]
- 8.Papkovsky DB. Methods Enzymol. 2004;381:715–735. doi: 10.1016/S0076-6879(04)81046-2. [DOI] [PubMed] [Google Scholar]
- 9.Carreau A, El Hafny-Rahbi B, Matejuk A, Grillon C, Kieda C. J. Cell. Mol. Med. 2011;15:1239–1253. doi: 10.1111/j.1582-4934.2011.01258.x. [DOI] [PMC free article] [PubMed] [Google Scholar]
- 10.Takahashi E, Bruley DF, Williams BB, Khan N, Zaki B, Hartford A, Ernstoff MS, Swartz HM. Clinical Electron Paramagnetic Resonance (EPR) Oximetry Using India Ink, Vol. 662. New York, NY: Springer; 2010. pp. 149–156. [DOI] [PMC free article] [PubMed] [Google Scholar]
- 11.Higaki S, Fujii H, Nagano M, Katagiri S, Takahashi Y. Biomed. Res. 2010;31:165–168. doi: 10.2220/biomedres.31.165. [DOI] [PubMed] [Google Scholar]
- 12.Takahashi E, Takano T, Nomura Y, Okano S, Nakajima O, Sato M. Am. J. Physiol. Cell Physiol. 2006;291:C781–787. doi: 10.1152/ajpcell.00067.2006. [DOI] [PubMed] [Google Scholar]
- 13.Mik EG, Ince C, Eerbeek O, Heinen A, Stap J, Hooibrink B, Schumacher CA, Balestra GM, Johannes T, Beek JF, Nieuwenhuis AF, van Horssen P, Spaan JA, Zuurbier CJ. J. Mol. Cell. Cardiol. 2009;46:943–951. doi: 10.1016/j.yjmcc.2009.02.002. [DOI] [PubMed] [Google Scholar]
- 14.Mik EG, Stap J, Sinaasappel M, Beek JF, Aten JA, van Leeuwen TG, Ince C. Nat. Methods. 2006;3:939–945. doi: 10.1038/nmeth940. [DOI] [PubMed] [Google Scholar]
- 15.Neugebauer U, Pellegrin Y, Devocelle M, Forster RJ, Signac W, Moran N, Keyes TE. Chem. Commun. 2008:5307–5309. doi: 10.1039/b810403d. [DOI] [PubMed] [Google Scholar]
- 16.Koo YE, Cao Y, Kopelman R, Koo SM, Brasuel M, Philbert MA. Anal. Chem. 2004;76:2498–2505. doi: 10.1021/ac035493f. [DOI] [PubMed] [Google Scholar]
- 17.Dmitriev RI, Ropiak H, Ponomarev G, Yashunsky DV, Papkovsky DB. Bioconjugate Chem. 2011;22:2507–2518. doi: 10.1021/bc200324q. [DOI] [PubMed] [Google Scholar]
- 18.Dmitriev RI, Ropiak HM, Yashunsky DV, Ponomarev GV, Zhdanov AV, Papkovsky DB. FEBS J. 2010;277:4651–4661. doi: 10.1111/j.1742-4658.2010.07872.x. [DOI] [PubMed] [Google Scholar]
- 19.Dmitriev RI, Zhdanov AV, Ponomarev GV, Yashunski DV, Papkovsky DB. Anal. Biochem. 2010;398:24–33. doi: 10.1016/j.ab.2009.10.048. [DOI] [PubMed] [Google Scholar]
- 20.Fercher A, Borisov SM, Zhdanov AV, Klimant I, Papkovsky DB. ACS Nano. 2011;5:5499–5508. doi: 10.1021/nn200807g. [DOI] [PubMed] [Google Scholar]
- 21.Wu C, Bull B, Christensen K, McNeill J. Angew. Chem. 2009;121:2779–2783. doi: 10.1002/anie.200805894. Angew. Chem. Int. Ed2009, 48, 2741–2745. [DOI] [PMC free article] [PubMed] [Google Scholar]
- 22.Wang X-d, Gorris HH, Stolwijk JA, Meier RJ, Groegel DBM, Wegener J, Wolfbeis OS. Chem. Sci. 2011;2:901–906. [Google Scholar]
- 23.Coogan MP, Court JB, Gray VL, Hayes AJ, Lloyd SH, Millet CO, Pope SJA, Lloyd D. Photochem. Photobiol. Sci. 2010;9:103–109. doi: 10.1039/b9pp00071b. [DOI] [PubMed] [Google Scholar]
- 24.Lee Y-EKoo, Ulbrich EE, Kim G, Hah H, Strollo C, Fan W, Gurjar R, Koo S, Kopelman R. Anal. Chem. 2010;82:8446–8455. doi: 10.1021/ac1015358. [DOI] [PMC free article] [PubMed] [Google Scholar]
- 25.Dmitriev RI, Papkovsky DB. Cell. Mol. Life Sci. 2012 doi: 10.1007/s00018-011-0914-0. DOI: 10.1007/s00018-011-0914-0. [DOI] [PMC free article] [PubMed] [Google Scholar]
- 26.Yoshihara T, Yamaguchi Y, Hosaka M, Takeuchi T, Tobita S. Angew. Chem. 2012;124:4224–4227. doi: 10.1002/anie.201107557. Angew. Chem. Int. Ed.2012, 51, 4148–4151. [DOI] [PubMed] [Google Scholar]
- 27.Zhang S, Hosaka M, Yoshihara T, Negishi K, Iida Y, Tobita S, Takeuchi T. Cancer Res. 2010;70:4490–4498. doi: 10.1158/0008-5472.CAN-09-3948. [DOI] [PubMed] [Google Scholar]
- 28.Papkovsky DB, O'Riordan TC. J. Fluoresc. 2005;15:569–584. doi: 10.1007/s10895-005-2830-x. [DOI] [PubMed] [Google Scholar]
- 29.O'Riordan TC, Zhdanov AV, Ponomarev GV, Papkovsky DB. Anal. Chem. 2007;79:9414–9419. doi: 10.1021/ac701770b. [DOI] [PubMed] [Google Scholar]
- 30.Fercher A, O'Riordan TC, Zhdanov AV, Dmitriev RI, Papkovsky DB. Methods Mol. Biol. 2010;591:257–273. doi: 10.1007/978-1-60761-404-3_16. [DOI] [PubMed] [Google Scholar]
- 31.Pittman RN, Golub AS, Carvalho H. In: Measurement of Oxygen in the Microcirculation Using Phosphorescence Quenching Microscopy Oxygen Transport to Tissue XXXI, Vol. 662. Takahashi E, Bruley DF, editors. New York, NY: Springer; 2010. pp. 157–162. [DOI] [PubMed] [Google Scholar]
- 32.Sakadzic S, Roussakis E, Yaseen MA, Mandeville ET, Srinivasan VJ, Arai K, Ruvinskaya S, Devor A, Lo EH, Vinogradov SA, Boas DA. Nat. Methods. 2010;7:755–759. doi: 10.1038/nmeth.1490. [DOI] [PMC free article] [PubMed] [Google Scholar]
- 33.Kellner K, Liebsch G, Klimant I, Wolfbeis OS, Blunk T, Schulz MB, Göpferich A. Biotechnol. Bioeng. 2002;80:73–83. doi: 10.1002/bit.10352. [DOI] [PubMed] [Google Scholar]
- 34.Schwarze SR, Ho A, Vocero-Akbani A, Dowdy SF. Science. 1999;285:1569–1572. doi: 10.1126/science.285.5433.1569. [DOI] [PubMed] [Google Scholar]
- 35.Futaki S, Nakase I, Tadokoro A, Takeuchi T, Jones AT. Biochem. Soc. Trans. 2007;35:784–787. doi: 10.1042/BST0350784. [DOI] [PubMed] [Google Scholar]
- 36.Gupta B, Levchenko TS, Torchilin VP. Adv. Drug Delivery Rev. 2005;57:637–651. doi: 10.1016/j.addr.2004.10.007. [DOI] [PubMed] [Google Scholar]
- 37.Lee Y-EKoo, Smith R, Kopelman R. Annu. Rev. Anal. Chem. 2009;2:57–76. doi: 10.1146/annurev.anchem.1.031207.112823. [DOI] [PMC free article] [PubMed] [Google Scholar]
- 38.Borisov SM, Mayr T, Mistlberger G, Waich K, Koren K, Chojnacki P, Klimant I. Talanta. 2009;79:1322–1330. doi: 10.1016/j.talanta.2009.05.041. [DOI] [PubMed] [Google Scholar]
- 39.Koren K, Borisov SM, Saf R, Klimant I. Eur. J. Inorg. Chem. 2011:1531–1534. doi: 10.1002/ejic.201100089. [DOI] [PMC free article] [PubMed] [Google Scholar]
- 40.Conway CL, Walker I, Bell A, Roberts DJH, Brown SB, Vernon DI. Photochem. Photobiol. Sci. 2008;7:290–298. doi: 10.1039/b715141a. [DOI] [PubMed] [Google Scholar]
- 41.Sharman KK, Periasamy A, Ashworth H, Demas JN. Anal. Chem. 1999;71:947–952. doi: 10.1021/ac981050d. [DOI] [PubMed] [Google Scholar]
- 42.Nakase I, Takeuchi T, Tanaka G, Futaki S. Adv. Drug Delivery Rev. 2008;60:598–607. doi: 10.1016/j.addr.2007.10.006. [DOI] [PubMed] [Google Scholar]
- 43.Ter-Avetisyan G, Tunnemann G, Nowak D, Nitschke M, Herrmann A, Drab M, Cardoso MC. J. Biol. Chem. 2009;284:3370–3378. doi: 10.1074/jbc.M805550200. [DOI] [PMC free article] [PubMed] [Google Scholar]
- 44.Duchardt F, Fotin-Mleczek M, Schwarz H, Fischer R, Brock R. Traffic. 2007;8:848–866. doi: 10.1111/j.1600-0854.2007.00572.x. [DOI] [PubMed] [Google Scholar]
- 45.Doherty GJ, McMahon HT. Annu. Rev. Biochem. 2009;78:857–902. doi: 10.1146/annurev.biochem.78.081307.110540. [DOI] [PubMed] [Google Scholar]
- 46.Kaplan IM, Wadia JS, Dowdy SF. J. Control Release. 2005;102:247–253. doi: 10.1016/j.jconrel.2004.10.018. [DOI] [PubMed] [Google Scholar]
- 47.Pujals S, Giralt E. Adv. Drug Delivery Rev. 2008;60:473–484. doi: 10.1016/j.addr.2007.09.012. [DOI] [PubMed] [Google Scholar]
- 48.Scocchi M, Tossi A, Gennaro R. Cell. Mol. Life Sci. 2011;68:2317–2330. doi: 10.1007/s00018-011-0721-7. [DOI] [PMC free article] [PubMed] [Google Scholar]
- 49.Fischer R, Kohler K, Fotin-Mleczek M, Brock R. J. Biol. Chem. 2004;279:12625–12635. doi: 10.1074/jbc.M311461200. [DOI] [PubMed] [Google Scholar]
- 50.O'Riordan TC, Fitzgerald K, Ponomarev GV, Mackrill J, Hynes J, Taylor C, Papkovsky DB. Am. J. Physiol. Regul. Integr. Comp. Physiol. 2007;292:R1613–1620. doi: 10.1152/ajpregu.00707.2006. [DOI] [PubMed] [Google Scholar]
- 51.Hynes J, Marroquin LD, Ogurtsov VI, Christiansen KN, Stevens GJ, Papkovsky DB, Will Y. Toxicol. Sci. 2006;92:186–200. doi: 10.1093/toxsci/kfj208. [DOI] [PubMed] [Google Scholar]
- 52.Carraway ER, Demas JN, DeGraff BA, Bacon JR. Anal. Chem. 1991;63:337–342. [Google Scholar]
- 53.Borisov SM, Nuss G, Klimant I. Anal. Chem. 2008;80:9435–9442. doi: 10.1021/ac801521v. [DOI] [PubMed] [Google Scholar]
- 54.Belleudi F, Scrofani C, Torrisi MR, Mancini P. PLoS One. 2011;6:e29159. doi: 10.1371/journal.pone.0029159. [DOI] [PMC free article] [PubMed] [Google Scholar]
- 55.Dmitriev RI, Zhdanov AV, Jasionek G, Papkovsky DB. Anal. Chem. 2012;84:2930–2938. doi: 10.1021/ac3000144. [DOI] [PubMed] [Google Scholar]
Associated Data
This section collects any data citations, data availability statements, or supplementary materials included in this article.