Abstract
Aberrant mutations of centrocytes in germinal centers (GC) can generate two completely different diseases: B-cell lymphomas and monoclonal gammopathy of undetermined significance (MGUS). In this article we use computational models to examine the evolutionary dynamics by which initial adaptation to survival in the GC allows naïve MGUS cells to proliferate in the bone marrow and initiate the evolutionary process that will lead to aggressive multiple myeloma (MM).
Our simulations show that MGUS cells may generate bone marrow tumors ranging from indolent to aggressive, depending on the original adaptation in the GC. All these tumors, however, are limited to approximately 15% of the marrow cellularity due to hypoxia-induced quiescence (this correlates with the cellularity that separates MGUS and MM, ~10%). Resistance to hypoxia-induced quiescence and cell death was one of the two major bone marrow adaptations that allowed continued tumor growth and establishment of paracrine cytokine loops, known to increase MM cell replication and de novo multidrug resistance. The second major adaptation was an increase in IL-6-independent growth rate, which correlates with the mutations observed in advanced stage patients. Even though there was an increase in the microvessel density in all simulations, the “angiogenic switch” was not due to a MM angiogenic phenotype, but rather the response of MM cells to the regional hypoxia caused by the increased tumor burden.
These results indicate that treatments targeting the adaptation to survival and proliferation in hypoxia, in conjunction with currently available therapies, may have synergistic effects, by delaying tumor growth and reducing cytokine paracrine loops mediated by angiogenic factors.
Keywords: Multiple Myeloma, Lymphoma, Germinal Center, Tumor Microenvironment, Somatic Evolution
INTRODUCTION
Multiple myeloma (MM) and B-cell lymphomas are two forms of cancer that emerge from the same hematopoietic cell lineage, B cells, which have undergone the process of somatic hyper mutation in germinal centers (GC). While MM cells grow in the bone marrow (BM), lymphoma cells grow mainly in lymph nodes, and in later stages in both diseases, the cancer cells can become intravascular and metastasize to other organs.
In this article we examine the evolutionary dynamics that promote adaptation to escape programmed cell death in the GC and subsequent adaptations of BM plasma cells that culminate with the development of MM.
MM is caused by malignant plasma cells that proliferate uncontrollably in the BM. Healthy plasma cells respond to inflammatory cytokines by secreting antibodies (immunoglobulin, Ig) to help the immune response 1-3. MM cells respond to inflammatory cytokines, such as IL-6, by proliferating faster without significantly increasing their level of secretion of antibodies 1. Nevertheless, one of the greatest morbidities from this disease is renal failure caused by the excess of antibody proteins secreted to the bloodstream by the staggering tumor burden, which may reach up to 90% of the marrow cellularity 4.
In some patients, MM is detected at the MGUS (monoclonal gammopathy of undetermined significance) stage, when the malignant plasma cells (<10% of the marrow) rarely replicate (~0.2%-0.5% labeling index, L.I.). Unfortunately, even these patients progresses to an aggressive disease at a rate of 1% per year 5, 6. MM is known for its broad genetic heterogeneity, with many genetic events (deletions, translocations, and aneuploidy) present in small fractions of the patient population, which makes it difficult to design drugs specific for this disease, and at the same time comprehensive for all observed genotypes 6.
We propose that although these diverse genetic events are important for the progression of MGUS to aggressive MM, they generate a smaller subset of phenotypes, which are the required adaptations for these malignant cells to survive the selection forces in the germinal center (GC) and BM. We propose that in order to understand the mechanisms behind the genetic events observed in MM, it is necessary to identify the environmental barriers to survival and proliferation imposed by these two organs and the phenotypic adaptations required to overcome these barriers.
The germinal centers (GC) of peripheral lymphoid organs are the main source of memory B cells and plasma cells that produce high-affinity antibodies, which are necessary to protect against invading microorganisms 7. The precursors of healthy plasma cells (centrocytes) mature and survive in the GC before they return to the BM. In the GC they must escape an antibody-affinity selection process, which induces apoptosis in cells that are auto-reactive or produce non-functional antibodies 7-10 (figure 1).
Figure 1.
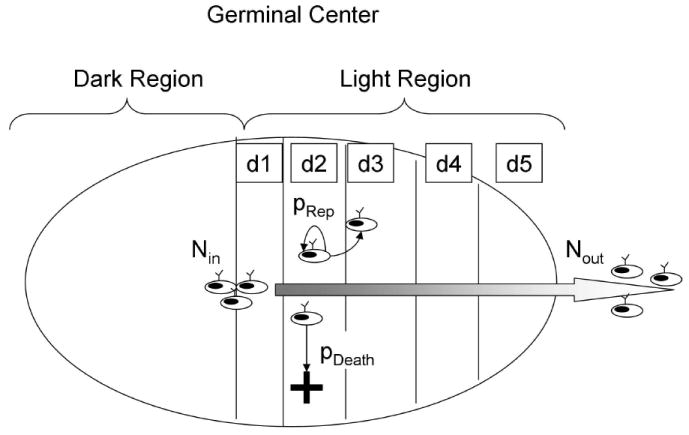
The germinal center model implemented in this article. When the B cell precursors enter the “light region” of the germinal center, they are called centrocytes and are capable of producing and presenting antibodies. At this stage these cells have survival signals (such as BCL-2) turned off, and can only survive if rescued by the interaction mediated by antibody-antigen affinity, or by an aberrant translocation, as is the case in many B-cell lymphomas. In this model the light region of the germinal center is divided in five compartments that the centrocytes cross during the five days of their journey outwards the germinal center. Centrocytes may move from one compartment to the next, replicate if they carry an aberrant translocation, or die.
Healthy centrocytes producing functional antibodies are rescued from death in the GC by adhesion to follicular dendritic cells (FDC) 11. Centrocytes produce antibodies when stimulated by cytokines, such as IL6 and IL10 12, 13.
B-cell lymphomas are tumors in which malignant centroblasts or centrocytes proliferate uncontrollably in the lymphoid organs due to aberrant genetic events during the somatic hypermutation process or class-switch recombination in the GC. In many cases this is caused by a chromosomal translocation that binds an immunoglobulin enhancer to an oncogene (IgH + Bcl2 = Follicular lymphoma, IgH + Myc = Burkitt lymphoma, IgH + PAX5 = lymphoplasmacytoid lymphoma, etc.) 7.
Such translocations are also observed in 40-50% of MGUS/MM patients6, however, MM cells only demonstrate their malignant phenotype when they return to the bone marrow and undergo a series of further genetic events that render them more aggressive.
In this work we propose that the primary chromosomal translocation normally found in MGUS and smoldering MM 14-17, serves not only to rescue MM cells from GC selection, but also confers a minimum proliferative potential in the BM required for them to adapt to and shape the microenvironment in their favor (figure 3).
Figure 3.
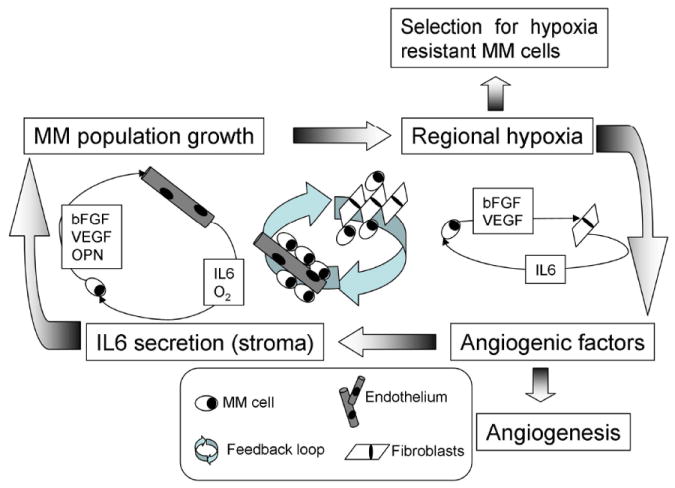
Vicious cycle in multiple myeloma. As the MM cell population grows, the oxygen levels decrease, inducing MM cells to secrete angiogenic cytokines (VEGF, bFGF). At long term, these cytokines increase the microvessel density, in the short term they induce secretion of inflammatory cytokines (IL-6) by stromal cells. IL-6 induces antibody production in normal plasma cells but promotes replication of MM cells. As this cycle progresses, cells with increased resistance to hypoxia and increased proliferative potential are selected, and the disease transitions from indolent to aggressive.
These primary translocations have in common the promoters/enhancers of two antibody producing genes that respond to inflammatory cytokines, which are present both at the germinal center and in the bone marrow 1. MM cells with these translocations will respond to inflammatory cytokines by over-expressing the translocated oncogene, instead of increasing their antibody production. The presence of these translocations in half of the MGUS/MM patients is a strong indicator that they contribute to the survival of these malignant cells and happen at an early stage of the malignancy, although not the only one. The monoclonal nature of MGUS/MM also indicates that the event that triggered malignancy in these cells must have happened during or after the somatic hypermutation process. When healthy terminally differentiated B cells return to the bone marrow, they may survive from months to years without proliferating6, what makes the rapid proliferating, genetically unstable period in the germinal center a more suggestive moment for occurrence of this initiation event than in the bone marrow.
In this work we use multiple compartment models to represent the GC and the BM. The first consists of an environment where immature centrocytes suffer somatic hyper mutation with a small probability of suffering a translocation, mutation or any form of aneuploidy that increases their proliferative potential in response to inflammatory cytokines. The BM model consists of MM cells, stromal cells, and endothelium, and was used to study whether the initial adaptation to the GC would allow MM cells any advantage in proliferating in the BM as well.
A recent theoretical evolutionary model 18 described how epithelial surfaces, more specifically colon crypts, are composed of at least two different microenvironments, each requiring a different phenotype for maximum fitness. Stem cells, maintained in a niche at the bottom of the crypt, are exposed to growth factors secreted from myoepithelial cells, while more differentiated daughter cells on the rest of the crypt are exposed to a different microenvironment, with growth factors produced by mesenchymal cells. For a cancer to develop in such a structure, at least two adaptations are required, one for each of these microenvironments: cancer cells born and adapted only to the stem cells niche would remain trapped there while those that become malignant and adapted to the upper sections of the lumen would eventually be pushed out of the crypt.
The model described in our current work proposes that the selection that occurs in the GC, before the plasma cells move back to the marrow, is responsible for creating a pre-malignant cell that abandons its original function of antibody secretion in favor of proliferation in response to inflammatory signals. These pre-malignant cells will then be selected by the bone marrow microenvironment to establish paracrine loops with the stromal cells in different niches, increasing proliferation. The side effects of this process are the symptoms of multiple myeloma (bone lesions, reduced hematopoiesis, renal failure and deficient immune system) and the environmentally-mediated resistance to therapy.
So, similar to the colon crypt model, cancer must adapt to two different microenvironments, however, unlike the colon crypt model, the adaptation to survival on the first microenvironment (GC) would confer a head start for proliferation in the secondary microenvironment, the bone marrow.
MATERIALS AND METHODS
In this work we built two computational models, one for the germinal center and the other for the bone marrow. The germinal center model consists of five compartments, corresponding to the volume of the light zone and the exit of the GC. A maximum number of centrocytes is allowed in this space, and they migrate from the first compartment to the exit at a speed of one compartment a day.
In the GC, centrocytes are rescued from apoptosis by affinity of their antibodies to antigens presented by follicular dendritic cells (FDC), in this model the rate of apoptosis in the light zone of the GC was estimated at 99% 19.
The details of the algorithm implementation are in the Appendix A, and a schematic description of the model is depicted in figure 1. In this model centrocytes are continuously produced in the dark region and selected in the light region of the GC. At a certain moment, a number of centrocytes with an aberrant translocation enter the light region. These aberrant centrocytes are resistant to apoptosis and replicate in response to inflammatory cytokines as described in figures 2 and figure 5.
Figure 2.
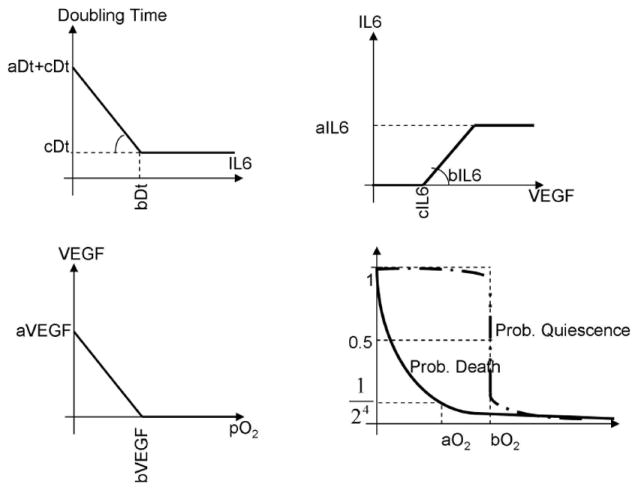
Implementation of the bone marrow model, with (top left) the dependence of MM cells on inflammatory cytokines (IL-6) for replication; (top right) the production of IL-6 by stromal cells in response to angiogenic cytokines; (bottom left) production of angiogenic cytokines by MM cells in response to hypoxia; (bottom right) the probability of MM cells of becoming quiescent or dying in hypoxia.
Figure 5.
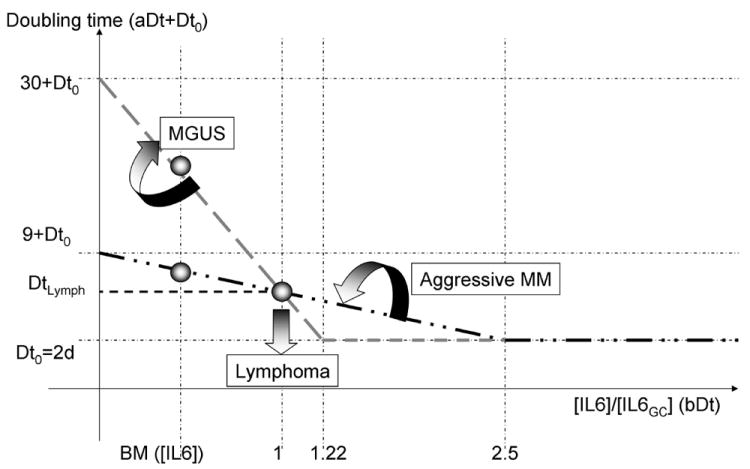
Dynamics of the interface between lymphoma and multiple myeloma. The figure above describes how the doubling time of a centrocyte with an aberrant translocation changes in response to the inflammatory cytokine IL-6, whose concentration in the light region of the germinal center is used as reference. Different combinations of the two parameters (aDt, doubling time in absence of IL-6, and bDt, minimum doubling time in presence of IL-6) create different curves; those with a doubling time lower than DtLymph for the germinal center IL-6 concentration will give rise to lymphomas. From this pivotal point (1, DtLymph) rotations clockwise will give rise to indolent forms of multiple myeloma, while rotations counter-clockwise will give rise to de novo multiple myeloma (see doubling time at lower IL-6 concentrations, in the bone marrow).
The BM model (figure 2) consists of MM cells, endothelial cells and bone marrow stromal cells (BMSC). MM cells originating from germinal centers increase their replication rate in response to the inflammatory cytokine IL-6. Inflammatory cytokines are secreted by stromal cells in response to VEGF and other angiogenic cytokines 20. MM cells secrete angiogenic cytokines in hypoxia, which results from the growth of the MM population 21.
In this model MM cells become quiescent in hypoxia and die when this condition reaches more severe levels. The model used here is a simplified version of the one published by Alarcon et al. 22.
Each cell in the BM model is an independent agent, with its own values for the phenotypic parameters described in figure 2. In the simulations where no mutations are allowed (figures 6 and 7) all MM cells from a same simulation share the same phenotypic values. However, when mutations are allowed (figures 8 and 9) every MM cells mutates independently, so that the final MM population is phenotypically heterogeneous.
Figure 6.
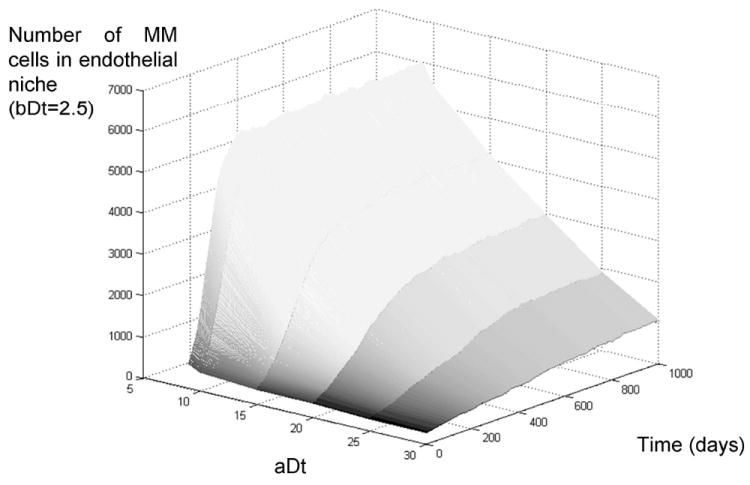
Growth rate of multiple myeloma in the bone marrow, effect of IL-6-independent replication rate. The figure above describes the growth rate of an initial MM tumor in the bone marrow for different values of doubling time in absence of IL-6 (11-32 days). The simulations show that germinal center translocations that lead to IL-6-independent cells generate tumors that grow much faster than those that are IL-6-dependent. Eventually the most aggressive tumors plateau due to hypoxia-induced quiescence, even though their growth continues to other niches of the marrow, there is an upper limit to the share of the marrow they may occupy (~15% for the parameters simulated).
Figure 7.
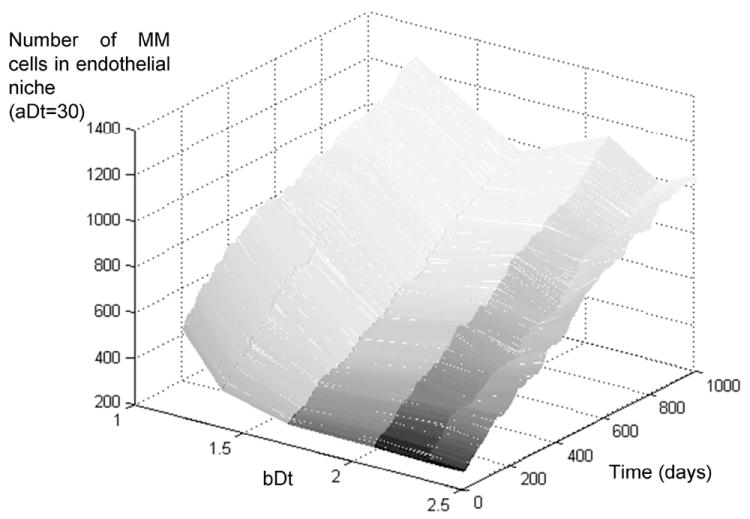
Growth rate of multiple myeloma in the bone marrow, effect of maximum replication rate. The figure above describes the growth rate of MM tumors that have a high doubling time in absence of IL-6 (32 days) but a variable level of response to IL-6, from least (bDt=2.5) to most responsive (bDt=1.22). The simulations show no significant difference among these different populations, indicating that the most important adaptation to growth in the bone marrow at this initial stage is not to IL-6-mediated growth.
Figure 8.
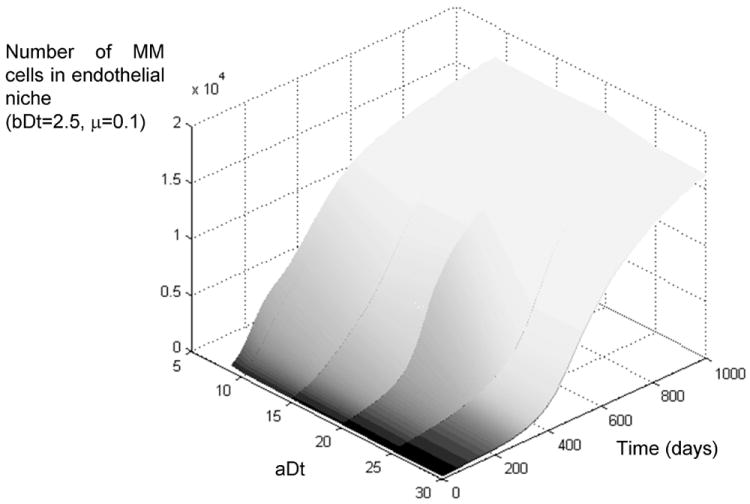
Growth rate of multiple myeloma in the bone marrow, effect of mutations in subpopulations of IL6 irresponsive cells. The simulation results depicted above indicate that the initial germinal center translocation determines the initial growth of the disease, but eventually all subpopulations adapt to the environmental barriers of the bone marrow and all transition to an aggressive form of the disease, with ~80% of the marrow occupied by MM cells.
Figure 9.

Growth rate of multiple myeloma in the bone marrow, effect of mutations in subpopulations of IL6-dependent cells. The figure above shows how at first all subpopulations have a modest growth, but as they adapt to the conditions of the bone marrow, they all transition to aggressive MM.
In this BM model, as is often observed in patients at advanced stages of the disease, a vicious cycle of tumor growth ⇒ hypoxia ⇒ angiogenic cytokines ⇒ inflammatory cytokines ⇒ further tumor growth, may lead to a paracrine loop that accelerates the MM burden growth, and eventually lead to evolution of more aggressive MM cells (figure 3). This vicious cycle, however, only occurs under specific conditions, as will be further described in this article.
RESULTS
Germinal Center model
Our simulations show that the development of B-cell lymphoma in Germinal Centers requires a minimum replication rate of centrocytes in the light zone in response to inflammatory cytokines, so that a critical mass of cancer cells will be produced and accumulate in the GC. The aberrant translocations that do not meet this requirement can still lead to multiple myeloma when these cells return to the bone marrow. Two parameters determine the transition between MM and lymphoma: the doubling time of cells in absence of inflammatory cytokines, and the cytokine levels that saturate the doubling rate of these cells (figure 4).
Figure 4.
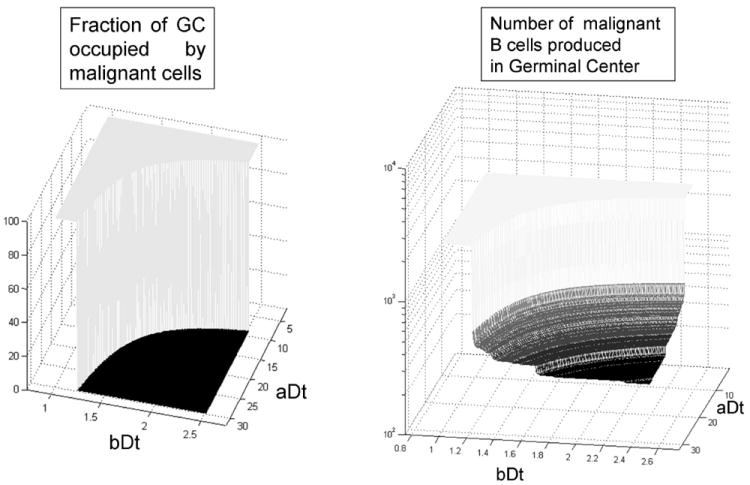
The transition between B-cell lymphoma and multiple myeloma is a discontinuity, the geometric place defined by the combination of the two model parameters which give a doubling time of 3.62 days in the germinal center. Among the non-lymphoma scenarios, the number of malignant cells produced before their migration to the bone marrow varies from 0 until approximately 600.
According to the parameters used in our model, the translocations that lead to a doubling time DtLymph of 3.62 days or less, at the GC cytokine concentration levels, will lead to B-cell lymphoma. This doubling time leads to an accumulation of malignant centrocytes at the exit of the GC, eventually leading to an expansion back to the light/dark zone frontier.
The geometric place of this transition is better depicted in figure 5, with the different forms of B-cell lymphoma developing when the IL-6 response curve crosses the vertical axis at the GC IL-6 concentration below the threshold value DtLymph.
The translocations that do not lead to B-cell lymphoma, but still produce malignant cells, have an upper and lower limit, which will produce aggressive or indolent forms of multiple myeloma. Those cells with high sensitivity and high dependence on IL6 will produce MGUS or indolent forms of myeloma (gray dashed line in figure 5). Cells with low dependence but also low sensitivity to IL6 will produce more aggressive forms of MGUS (dashed-dotted black line in figure 5).
Bone Marrow model
To understand how MM cells originated by the primary translocation in the GC will behave in the bone marrow, we simulated the growth of different subpopulations in the BM model described earlier in this article. The populations chosen for our simulations were those formed by the clockwise rotation of the black dash-dotted line and counterclockwise of the gray dashed line from figure 5. Both groups have phenotypes with a gradual transition from benign to malignant in the germinal center but, as will be further explained, this gradual transition is not equally reflected in the bone marrow.
When these cells are transported to the bone marrow model, the simulations with IL-6-insensitive MM cells (clockwise rotation of the black dash-dotted line) show that the doubling time in absence of cytokines is the main factor determining if the disease will be an indolent or aggressive form of MM. Figure 6 depicts how MM cells with high doubling time (32 days, aDt=30) produce slow growing tumors, while those with shorter doubling time (11 days, aDt=9) produce fast growing tumors. Even these, however, eventually plateau at ~15% of the total marrow population.
These simulations show that even though these tumors grow quicker than indolent forms of the disease, they cannot grow beyond a threshold, which is caused by quiescence-induced hypoxia.
Simulations with IL-6-dependent MM cells (counter-clockwise rotation of the gray dashed line) do not show any significant difference between IL-6-responsive or irresponsive cells, with all populations producing indolent forms of the disease (figure 7). This observation reflects the need of these cells to receive proliferation signals from the extracellular environment, and that the levels of inflammatory cytokines in the BM at low tumor burden levels are not sufficient to fuel the growth of these cells. As the results with high mutation rates will further detail, inflammatory cytokine levels will one contribute to tumor growth once the tumor burden grows enough to induce hypoxia and secretion of angiogenic cytokines by MM cells, initiating the vicious cycle depicted in figure 3.
The results from these two sets of simulations show that before patients develop aggressive MM, either the translocations in the GC must allow cytokine-independent growth, or a second evolutionary step is required during the progression of the disease in the bone marrow. Even in the case of cytokine-independent MM cells, a maximum tumor burden is imposed by hypoxia.
Our next goal was to identify which would be the second adaptive step that would finally allow this population of MM cells to initiate a cytokine paracrine loop, and reach tumor burdens of the order of 80-90%. We repeated our simulations with a high mutation rate (10%) for the following phenotypes: IL-6-independent doubling time (aDt), doubling time response to IL-6 (bDt), maximum production of angiogenic factors (aVEGF), hypoxia dependence of secretion of angiogenic factors (bVEGF), hypoxia induced death (aO2) and quiescence thresholds (bO2). These simulations showed that, given enough time, all patients will evolve to an aggressive form of the disease, with increased microvessel density, a low labeling index (1-2%) limited by the diffusion of MM cells, regional hypoxia (pO2~2%), and 75-80% of the marrow occupied by MM cells.
Figure 8 depicts the different growth curves of the subpopulations from figure 6, but with a high mutation rate. Even though the more aggressive cells show an initial faster growth, eventually the more indolent populations adapt to the bone marrow and “catch up” with the rest. All populations reach approximately 80% of the marrow cellularity.
Figure 9 depicts the evolution of the populations from figure 7 if a high mutation rate is allowed. The initial indolent disease remains dormant for many months before an adaptation allows these cells to grow uncontrollably in approximately one year. This recapitulates the transition between MGUS and MM, whose underlying mechanisms are still poorly understood 5. The model, however, consists of a small volume of the marrow (~15,000 cells or 0.3uL) and the actual transition from MGUS to MM in the whole marrow population will depend on the migration of these cells to other regions of the bone and other bones in the body.
Figure 10 exemplifies what we observed in all simulations: the MM population converges to the same set of phenotypes, which is accelerated IL-6 independent-growth, increase in IL-6 response, resistance to hypoxia-induced cell death and quiescence.
Figure 10.
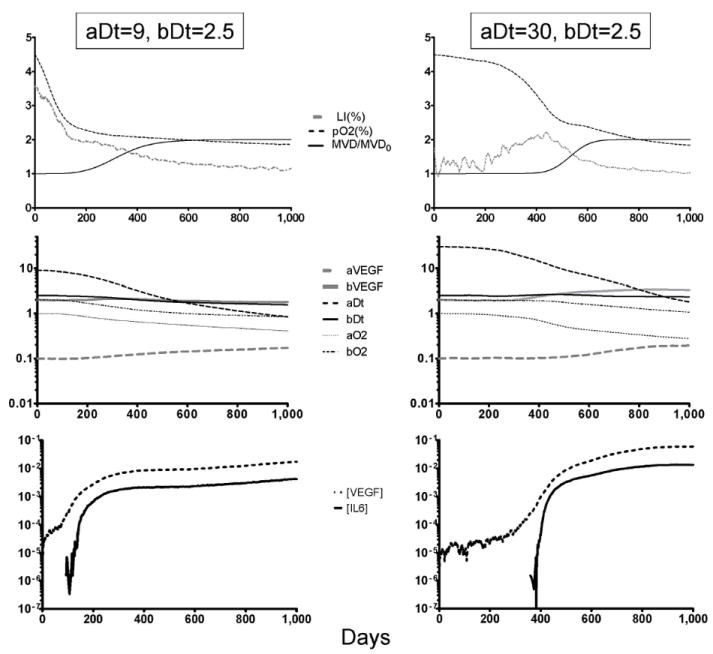
Adaptations required for MM growth in the bone marrow. The charts above describe the evolution of two different simulations (aggressive de novo MM on the left, indolent MGUS on the right) when mutations occur at a high rate. The top panels show how the share of replicating cells (labeling index, LI) decreases as the oxygen levels are reduced by the growing tumor burden. On de novo MM, hypoxia and angiogenesis (increase in microvessel density, MVD) occur much faster than in MGUS. The middle panel describes how the simulation parameters (described in figure 2) change as the MM population adapts to the bone marrow: cells become more IL-6-independent (aDt decreases), and resistant to hypoxia-induced cell death (aO2 decreases) and quiescence (bO2 decreases). The bottom panel shows the changes in the levels of VEGF and IL-6, showing how the IL-6 peak induced by angiogenic factors coincides with the acceleration in both growth and evolution in the two populations simulated.
The cytokine levels for both VEGF and IL-6 increase in all simulations, reinforcing tumor growth, angiogenesis and paving the way towards IL-6-mediated de novo drug resistance 23. This is in part due to mutations that increase VEGF secretion by MM cells, but mainly due to hypoxia, which induces MM cells to secrete more angiogenic factors.
Despite the simplicity of the model implemented in this article, these phenotypes are similar to the ones observed in patient samples, or the more aggressive human MM cell lines (HMCL) in vitro 24, 25. Previous experiments have shown that in average the addition of IL-6 to the growth media doubles (S.I. =1.7) the growth rate of MM cells and cell lines. In the 11 scenarios depicted in figures 8 and 9, the replication rate in presence of IL-6 was in average 1.8-fold faster (minimum of 1.45 and maximum of 2.8) than in absence of it.
DISCUSSION
Multiple myeloma is a complex disease. The observed genetic heterogeneity in MM cells limits separation of genetic events that are important (i.e. drive mutations) for disease progression from those that are not (i.e. passenger mutations). Furthermore, disease progression is dependent on a wide range of tumor-stroma interactions in the bone marrow. These dynamics will be difficult to understand or predict based on genetic analysis of the MM cells.
Our results show that the primary chromosomal translocation involving an oncogene and immunoglobulin enhancer, or equivalent genetic event conferring increased survival, in the GC creates a bimodal landscape, with an abrupt transition between MGUS and B-cell lymphomas. MGUS cells will create tumors ranging from indolent to aggressive, depending on the phenotype conferred by the GC translocation, but all eventually reach a maximum share of 15% of the bone marrow. This plateau is caused by hypoxia-induced quiescence and death. When mutations in the BM were allowed, the simulations showed that two adaptations emerge: (1) Survival and proliferation in hypoxia, and (2) IL6-independent proliferation. Given a high enough mutation rate and time, even the most indolent tumors became aggressive. This means that, even though the primary translocation in the GC is required for initiation of the disease, further adaptations to the BM microenvironment are the limiting factor in progression to aggressive MM. We did not observe adaptations to constitutive production of angiogenic factors by MM cells, what indicates that the “angiogenic switch” observed in patients 26, animal models 27, 28, and our simulations, is due to the “natural” angiogenic response of MM cells to the increasingly hypoxic bone marrow 29.
In this work we propose an evolutionary model that describes the environmental barriers imposed by the germinal center and bone marrow during the different stages of maturation and progression of B cells. Here we propose that these cells can give rise to B-cell lymphoma or multiple myeloma depending on the intensity of the enhancer/oncogene combination of aberrant translocations.
It is interesting to notice that the transition from B-cell lymphoma to MGUS is discontinuous, with the limiting factor being that lymphoma cells must replicate fast enough in the germinal center to block their own exit. This cell “jamming” eventually leads to the accumulation of B-cell lymphoma cells in the GC and onset of the disease. When the lymphoma tumors overgrow and disrupt the GC, they will be faced with a different microenvironment, to which they need to adapt as well. The initial translocation/mutation/deletion confers these cells different capabilities to adapt to this new microenvironment and determine their different growth rates and therapy resistance.
The primary enhancer/oncogene translocation is the necessary triggering event of indolent MGUS, but is not sufficient. Even the most aggressive forms of MGUS cells originated from the GC will eventually plateau at approximately 15% of the marrow population. A second set of adaptations is thus required for MGUS to become an aggressive disease.
These adaptations to the bone marrow are: (1) lower dependence on IL-6 for replication -while still responding to this cytokine with increased replicative rate-, and (2) increase in survival and proliferative potential in hypoxia. When MM cells acquire these phenotypes, they are capable of colonizing the bone marrow and establish paracrine loops with stromal cells that reinforce tumor growth and eventually cytokine-mediated drug resistance.
It is well known that patients at aggressive stages of MM carry activating mutations in RAS (NRAS and KRAS2) and FGFR3 genes that confer IL-6 independent growth 6. Not much, however, is known about the hypoxia adaptation of MM cells. The techniques currently available to measure pO2 in the bone marrow across the different niches are still not as well developed in patients as the ones available for animal models 21, and thus there is still much controversy about the existence hypoxia in patients’ marrows.
The in vitro adaptation of other cell lines to hypoxia have pointed different gene candidates, such as Bcl-XL 30, HIF1α and NF-κB 31, while other groups suggested more complex genetic signatures 32, 33. It is possible that the adaptation of MM cells to hypoxia be reached by such a complex genetic signature, what would make it even more difficult to detect this adaptation in vivo using genomic approaches. The selection of human MM cell lines (HMCL) in hypoxia in vitro would be an important first step in this direction.
One of the major events that mark the transition from MGUS to MM, in patients and in our simulations, is the increase in the microvessel density. A study of immunohistochemistry of BM biopsies from 106 MM patients showed that 40% had increased Hif1α, VEGF levels, and angiogenesis 34. Data from animal models 27, 28 and patient specimens 26 suggested an “angiogenic switch”, an adaptation that would increase the angiogenic potential of MM cells and be responsible for the transition from indolent to aggressive MM.
ELISA in vitro studies with HMCL showed that these cells produce VEGF and bFGF 35, 36, and can induce in vitro angiogenesis 37, 38. In all these studies, however, MM cells were cultured at high density (>106 cells/mL). Under these conditions hypoxia is established after a few hours, with levels of HIF1α noticeably higher after 2 hours of culture (Turner et al., unpublished studies).
In our simulations we did not observe a consistent selection for increased angiogenic potential on MM cells, nor evolution towards constitutive secretion of VEGF. Angiogenesis mainly occurred due to increased hypoxic conditions. A possible explanation is that cells that secrete angiogenic factors must share the benefits (increased oxygen levels and inflammatory cytokines) with their neighbors. Cells with this “altruistic” adaptation do not increase their share in the population, and thus are not fitter. Hence the preference for the more “selfish” adaptation of hypoxia resistance.
Taken together with the results from our simulations, we believe that the increased angiogenesis in advanced MM patients is a side-effect of the vicious paracrine cycle between MM and stromal cells, rather than a requirement for the progression of the disease. The angiogenic switch 39 would be in fact a result of hypoxia-induced VEGF secretion by hypoxia-resistant cells, rather than a constitutive expression. This hypothesis is reinforced by immunohistochemistry analyses showing that VEGF levels were higher in biopsies from patients with advanced stages of MM, when compared with MGUS, but the in vitro production of VEGF and bFGF of cells from these patients were not significantly different from the one of healthy plasma cells 40, 41. The main consequence of this conclusion is that the reduction of hypoxia in the myelomatous marrow (either by normalization of blood vessels or reduction of tumor burden) should decrease the VEGF/IL6 loop between MM and stroma, thus sensitizing these cells to therapy.
Our simulations show that at sufficiently high mutation rates, even the least aggressive forms of indolent MGUS will progress and catch up with de novo MM. This conclusion suggests that (1) treating MGUS and smoldering MM patients with therapies that increase mutation rate, like Melphalan or Doxorubicin, may have the disadvantage of accelerating progression to aggressive MM, and (2) treating MM patients with pro-drugs that focus on cells in hypoxic regions, previous to standard chemotherapy, will reduce the levels of angiogenic and inflammatory cytokines, decreasing cytokine-mediated drug resistance and sensitize these cells to conventional chemotherapy. These results are supported by recent work in animal models 42 in which the pro-drug TH302 was used in the MM animal model 5T33MM. This drug, which only is active in hypoxia (<1%) caused reduction of the tumor burden (32%-77%) and of microvessel density (19%-26%), even though it only targeted the hypoxic niche of MM cells.
Evolution selects phenotypes, not genotypes so that evolutionary adaptive strategies supervenes the underlying genetic. In other words, multiple genes typically govern a much smaller subset of phenotypic properties. This mapping of genes to a much smaller number of phenotypic properties explains the wide genetic heterogeneity observed in MM 43. The study of the environmental barriers that shape the evolution of multiple myeloma during “natural” progression allows the observed genetic changes to be organized into phenotypic strategies to overcome these barriers.
The results from this article suggest that the secondary genetic events (post-GC) in MM are adaptations to survival and growth in hypoxia and towards independence (but not insensitivity) to IL-6. These results suggest that the considerable genetic heterogeneity observed in MM patients is, in part, the result of the large number of genes that allow these adaptations through different mechanisms. In other words, the phenotypic adaptations that permit MM cells to survive in the GC and then the BM are governed by a wide range of pathways and, as a result, a large number of different mutations can confer a proliferative advantage. Thus, the low frequency genes that are not linked to these adaptations are probably passenger mutations, while those linked to these adaptations are strong candidates for a therapy aiming to reduce the fitness of MM cells, and slow the progression of the aggressive disease.
Supplementary Material
Acknowledgments
This work was funded by Moffitt Cancer Center PS-OC NIH/NCI 1U54CA143970-01 and International Myeloma Foundation Brian D. Novis Research Award Junior Grant.
Footnotes
SUPPORTING INFORMATION:
-
For this article, the following parameters were used:
-
1.1Number of days needed for a centrocyte to cross the light region of the germinal center, also the number of “compartments” of the light region of the germinal center: nD=5;
-
1.2Number of cells that can leave the germinal center per day: nOUT=200;
-
1.3Number of cells produced in the dark region of the germinal center and enter the light region per day: nIN=2,000;
-
1.4Maximum number of cells in each compartment of the light region of the germinal center: nMAX=2,000;
-
1.5Probability of survival of a centrocyte crossing the light zone of the germinal center: pSURV=1%;
-
1.6Initial number of centrocytes with aberrant translocation which enter the light zone of the germinal center: nMUT=10;
-
1.7Duration of a simulation step: 1 day;
-
1.8Number of simulations steps: 10 days;
-
1.9Doubling time of aberrant centrocytes: 2 days ≤ Dt ≤ 30 days;
-
1.1
-
For each simulation step, perform the tasks below:
-
2.1For each compartment in the GC light zone, do:
-
2.1.1If this is the last compartment, do:
-
2.1.1.1Number of cells to leave the germinal center = Min(nOUT, number of cells in the last compartment of the germinal center);
-
2.1.1.2Subtract from the last compartment the number of cells that leave the germinal center and update the number of cells produced by the GC;
-
2.1.1.1
-
2.1.2Else (this is not the last compartment) do:
-
2.1.2.1Number of cells to move to the next compartment = Min(number of cells in this compartment, nMAX-number of cells in the next compartment);
-
2.1.2.2Transfer the number of cells from the current compartment to the next;
-
2.1.2.1
-
2.1.3If this is the first compartment, do:
-
2.1.3.1Number of new cells to enter this compartment = Min(nIN, nMAX-number of cells in this compartment);
-
2.1.3.2Transfer the number of new cells to this compartment;
-
2.1.3.1
-
2.1.4For each cell in the compartment do:
-
2.1.4.1Test if cell dies:
-
2.1.4.1.1;
-
2.1.4.1.2If cell dies, remove it from the compartment;
-
2.1.4.1.1
-
2.1.4.2Test if cell replicates:
-
2.1.4.2.1;
-
2.1.4.2.2If replication test is successful, test if there is available space for a new cell in the current compartment or in the two adjacent ones;
-
2.1.4.2.3If there is available space, create a copy of the original cell in the corresponding compartment, if not, the cell does not replicate;
-
2.1.4.2.1
-
2.1.4.1
-
2.1.1
-
2.1
-
For this article, the following parameters were used in the model:
-
1.1Maximum number of cells in the BM niche simulated: nMAX=40,000;
-
1.2Number of stromal cells in the BM niche simulated: nFib=500;
-
1.3Number of hematopoietic cells and adipocytes: nHSC + nAdip=4,500;
-
1.4Initial number of MM cells: varies with the number of MM cells produced in the germinal center in each scenario, 275≤ nMM ≤582;
-
1.5Initial oxygen partial pressure (p0O2): 5%;
-
1.6Initial parameters for MM population:
-
1.6.1Minimum doubling time: cDt=2 days;
-
1.6.2Maximum VEGF production rate: aVEGF=0.1;
-
1.6.3Hypoxia threshold for VEGF production: bVEGF=2% pO2;
-
1.6.4Oxygen concentration that induces 50% of probability of quiescence: bO2=2%;
-
1.6.5Oxygen concentration that induces 6.25% of probability of cell death: aO2=1%;
-
1.6.1
-
1.7Parameters for stroma population:
-
1.7.1Maximum production rate of IL6: aIL6=1;
-
1.7.2Slope between IL6 production and VEGF concentration: bIL6=9;
-
1.7.3Minimum VEGF threshold for induction of IL6 production: cIL6=0.001;
-
1.7.1
-
1.8Duration of a simulation step: 1 day;
-
1.9Number of steps simulated: 1,000 (~2 years and 9 months);
-
1.10Mutation rate in simulations where mutation was allowed: μ=0.1;
-
1.11Maximum microvessel density: MVDMAX=2x initial microvessel density;
-
1.12Doubling time of microvessel density at VEGF concentration of 1: dMVD_Dt=5 days;
-
1.1
- Create two data structures, one for MM cells, the other for stromal cells;
- Populate the data structure of MM cells with the number of cells with aberrant translocations produced in the GC, with the corresponding vales for the parameters aDt and bDt;
-
For each simulation step do:
-
4.1Compute oxygen partial pressure (pO2) in the niche, which is a function of the microvessel density (MVD), the oxygen pressure at the nearest blood vessel (p0O2), and the number of cells consuming oxygen in this niche.
-
4.1.1
-
4.1.1
-
4.2For each MM cell in the niche, compute the VEGF production as a function of pO2 and the parameters aVEGF and bVEGF;
-
4.3Compute total concentration of VEGF by summing the production from each MM cell and dividing by the total number of cells in the niche;
-
4.4For each stromal cell in the niche, compute the IL6 production as a function of extracellular VEGF concentration and the parameters aIL6, bIL6 and cIL6;
-
4.5Compute the total IL6 concentration by summing the production from each stromal cell and dividing by the total number of cells in the niche;
-
4.6For each MM cell in the niche, compute its fate:
-
4.6.1Test if cell dies, in this model, cell death is caused by hypoxia:
-
4.6.1.1Probability of cell death:
-
4.6.1.2If cell is dead, remove it from the data structure;
-
4.6.1.1
-
4.6.2Test if cell is quiescent, which is also induced by hypoxia:
-
4.6.2.1Probability of cell becoming quiescent:
-
4.6.2.1
-
4.6.3If cell is not quiescent, test if it may replicate:
-
4.6.3.1The probability of duplication is a function of the extracellular IL6 concentration and the two parameters, aDt and bDt;
-
4.6.3.2Computer the cell doubling time based on aDt, bDt and [IL6];
-
4.6.3.3Probability of replication:
-
4.6.3.1
-
4.6.4If the cell succeeded in the replication test, verify if there is enough space for the daughter cell.
-
4.6.4.1Probability of available space for replication:
-
4.6.4.1
-
4.6.5If there is available space create a copy of the original cell and place it in the MM data structure;
-
4.6.6If the mutation rate is not zero, test if mutation occurs:
-
4.6.6.1Probability of mutation: pMut=μ;
-
4.6.6.2If mutation occurred, update the phenotypes of the daughter cell. For each parameter, do:
-
4.6.6.2.1New value=Old value ×(1+randGauss() ×μ), where randGauss() is a function that generates random numbers following a Gaussian distribution with average 0 and standard deviation 1;
-
4.6.6.2.1
-
4.6.6.1
-
4.6.7Update the microvessel density:
-
4.6.7.1
-
4.6.7.1
-
4.6.1
-
4.1
This information is available free of charge via the Internet at http://pubs.acs.org/.
References
- 1.Klein B, Zhang XG, Lu ZY, Bataille R. Interleukin-6 in human multiple myeloma. Blood. 1995;85(4):863–72. [PubMed] [Google Scholar]
- 2.Heinrich PC, Castell JV, Andus T. Interleukin-6 and the acute phase response. Biochem J. 1990;265(3):621–36. doi: 10.1042/bj2650621. [DOI] [PMC free article] [PubMed] [Google Scholar]
- 3.Hirano T, Yasukawa K, Harada H, Taga T, Watanabe Y, Matsuda T, Kashiwamura S, Nakajima K, Koyama K, Iwamatsu A, et al. Complementary DNA for a novel human interleukin (BSF-2) that induces B lymphocytes to produce immunoglobulin. Nature. 1986;324(6092):73–6. doi: 10.1038/324073a0. [DOI] [PubMed] [Google Scholar]
- 4.Symeonidis A, Kouraklis-Symeonidis A, Grouzi E, Zolota V, Melachrinou M, Kourea K, Fragopanagou E, Giannakoulas N, Seimeni U, Tiniakou M, Matsouka P, Zoumbos N. Determination of plasma cell secreting potential as an index of maturity of myelomatous cells and a strong prognostic factor. Leuk Lymphoma. 2002;43(8):1605–12. doi: 10.1080/1042819021000002938. [DOI] [PubMed] [Google Scholar]
- 5.Hallek M, Bergsagel PL, Anderson KC. Multiple myeloma: increasing evidence for a multistep transformation process. Blood. 1998;91(1):3–21. [PMC free article] [PubMed] [Google Scholar]
- 6.Kuehl WM, Bergsagel PL. Multiple myeloma: evolving genetic events and host interactions. Nat Rev Cancer. 2002;2(3):175–87. doi: 10.1038/nrc746. [DOI] [PubMed] [Google Scholar]
- 7.Klein U, Dalla-Favera R. Germinal centres: role in B-cell physiology and malignancy. Nat Rev Immunol. 2008;8(1):22–33. doi: 10.1038/nri2217. [DOI] [PubMed] [Google Scholar]
- 8.Guzman-Rojas L, Sims-Mourtada JC, Rangel R, Martinez-Valdez H. Life and death within germinal centres: a double-edged sword. Immunology. 2002;107(2):167–75. doi: 10.1046/j.1365-2567.2002.01494.x. [DOI] [PMC free article] [PubMed] [Google Scholar]
- 9.Alabyev B, Vuyyuru R, Manser T. Influence of Fas on the regulation of the response of an anti-nuclear antigen B cell clonotype to foreign antigen. Int Immunol. 2008;20(10):1279–87. doi: 10.1093/intimm/dxn087. [DOI] [PMC free article] [PubMed] [Google Scholar]
- 10.Korsmeyer SJ. Bcl-2 initiates a new category of oncogenes: regulators of cell death. Blood. 1992;80(4):879–86. [PubMed] [Google Scholar]
- 11.van Eijk M, Medema JP, de Groot C. Cutting edge: cellular Fas-associated death domain-like IL-1-converting enzyme-inhibitory protein protects germinal center B cells from apoptosis during germinal center reactions. J Immunol. 2001;166(11):6473–6. doi: 10.4049/jimmunol.166.11.6473. [DOI] [PubMed] [Google Scholar]
- 12.Toellner KM, Scheel-Toellner D, Sprenger R, Duchrow M, Trumper LH, Ernst M, Flad HD, Gerdes J. The human germinal centre cells, follicular dendritic cells and germinal centre T cells produce B cell-stimulating cytokines. Cytokine. 1995;7(4):344–54. doi: 10.1006/cyto.1995.0044. [DOI] [PubMed] [Google Scholar]
- 13.Wu Y, El Shikh ME, El Sayed RM, Best AM, Szakal AK, Tew JG. IL-6 produced by immune complex-activated follicular dendritic cells promotes germinal center reactions, IgG responses and somatic hypermutation. Int Immunol. 2009;21(6):745–56. doi: 10.1093/intimm/dxp041. [DOI] [PMC free article] [PubMed] [Google Scholar]
- 14.Fonseca R, Barlogie B, Bataille R, Bastard C, Bergsagel PL, Chesi M, Davies FE, Drach J, Greipp PR, Kirsch IR, Kuehl WM, Hernandez JM, Minvielle S, Pilarski LM, Shaughnessy JD, Jr, Stewart AK, Avet-Loiseau H. Genetics and cytogenetics of multiple myeloma: a workshop report. Cancer research. 2004;64(4):1546–58. doi: 10.1158/0008-5472.can-03-2876. [DOI] [PubMed] [Google Scholar]
- 15.Kuehl WM, Bergsagel PL. Early genetic events provide the basis for a clinical classification of multiple myeloma. Hematology Am Soc Hematol Educ Program. 2005:346–52. doi: 10.1182/asheducation-2005.1.346. [DOI] [PubMed] [Google Scholar]
- 16.Bergsagel PL, Kuehl WM. Molecular pathogenesis and a consequent classification of multiple myeloma. J Clin Oncol. 2005;23(26):6333–8. doi: 10.1200/JCO.2005.05.021. [DOI] [PubMed] [Google Scholar]
- 17.Bergsagel PL, Kuehl WM, Zhan F, Sawyer J, Barlogie B, Shaughnessy J., Jr Cyclin D dysregulation: an early and unifying pathogenic event in multiple myeloma. Blood. 2005;106(1):296–303. doi: 10.1182/blood-2005-01-0034. [DOI] [PMC free article] [PubMed] [Google Scholar]
- 18.Gatenby RA, Gillies RJ, Brown JS. Evolutionary dynamics of cancer prevention. Nat Rev Cancer. 10(8):526–7. doi: 10.1038/nrc2892. [DOI] [PMC free article] [PubMed] [Google Scholar]
- 19.Martinez-Valdez H, Guret C, de Bouteiller O, Fugier I, Banchereau J, Liu YJ. Human germinal center B cells express the apoptosis-inducing genes Fas, c-myc, P53, and Bax but not the survival gene bcl-2. J Exp Med. 1996;183(3):971–7. doi: 10.1084/jem.183.3.971. [DOI] [PMC free article] [PubMed] [Google Scholar]
- 20.Podar K, Tai YT, Davies FE, Lentzsch S, Sattler M, Hideshima T, Lin BK, Gupta D, Shima Y, Chauhan D, Mitsiades C, Raje N, Richardson P, Anderson KC. Vascular endothelial growth factor triggers signaling cascades mediating multiple myeloma cell growth and migration. Blood. 2001;98(2):428–35. doi: 10.1182/blood.v98.2.428. [DOI] [PubMed] [Google Scholar]
- 21.Colla S, Storti P, Donofrio G, Todoerti K, Bolzoni M, Lazzaretti M, Abeltino M, Ippolito L, Neri A, Ribatti D, Rizzoli V, Martella E, Giuliani N. Low bone marrow oxygen tension and hypoxia-inducible factor-1alpha overexpression characterize patients with multiple myeloma: role on the transcriptional and proangiogenic profiles of CD138(+) cells. Leukemia. 24(11):1967–70. doi: 10.1038/leu.2010.193. [DOI] [PubMed] [Google Scholar]
- 22.Alarcon T, Byrne HM, Maini PK. A mathematical model of the effects of hypoxia on the cell-cycle of normal and cancer cells. Journal of theoretical biology. 2004;229(3):395–411. doi: 10.1016/j.jtbi.2004.04.016. [DOI] [PubMed] [Google Scholar]
- 23.Meads MB, Hazlehurst LA, Dalton WS. The bone marrow microenvironment as a tumor sanctuary and contributor to drug resistance. Clin Cancer Res. 2008;14(9):2519–26. doi: 10.1158/1078-0432.CCR-07-2223. [DOI] [PubMed] [Google Scholar]
- 24.Ogata A, Chauhan D, Teoh G, Treon SP, Urashima M, Schlossman RL, Anderson KC. IL-6 triggers cell growth via the Ras-dependent mitogen-activated protein kinase cascade. J Immunol. 1997;159(5):2212–21. [PubMed] [Google Scholar]
- 25.Sonneveld P, Schoester M, de Leeuw K. In vitro Ig-synthesis and proliferative activity in multiple myeloma are stimulated by different growth factors. Br J Haematol. 1991;79(4):589–94. doi: 10.1111/j.1365-2141.1991.tb08086.x. [DOI] [PubMed] [Google Scholar]
- 26.Ribatti D, Vacca A, Nico B, Quondamatteo F, Ria R, Minischetti M, Marzullo A, Herken R, Roncali L, Dammacco F. Bone marrow angiogenesis and mast cell density increase simultaneously with progression of human multiple myeloma. Br J Cancer. 1999;79(3-4):451–5. doi: 10.1038/sj.bjc.6690070. [DOI] [PMC free article] [PubMed] [Google Scholar]
- 27.Asosingh K, De Raeve H, Menu E, Van Riet I, Van Marck E, Van Camp B, Vanderkerken K. Angiogenic switch during 5T2MM murine myeloma tumorigenesis: role of CD45 heterogeneity. Blood. 2004;103(8):3131–7. doi: 10.1182/blood-2003-08-2946. [DOI] [PubMed] [Google Scholar]
- 28.De Raeve HR, Asosingh K, Wisse E, Van Camp B, Van Marck E, Vanderkerken K. Part of the multiple myeloma-associated microvessels is functionally connected to the systemic circulation: a study in the murine 5T33MM model. Virchows Arch. 2004;445(4):389–95. doi: 10.1007/s00428-004-1064-7. [DOI] [PubMed] [Google Scholar]
- 29.Shweiki D, Itin A, Soffer D, Keshet E. Vascular endothelial growth factor induced by hypoxia may mediate hypoxia-initiated angiogenesis. Nature. 1992;359(6398):843–5. doi: 10.1038/359843a0. [DOI] [PubMed] [Google Scholar]
- 30.Dong Z, Wang J. Hypoxia selection of death-resistant cells. A role for Bcl-X(L) J Biol Chem. 2004;279(10):9215–21. doi: 10.1074/jbc.M312225200. [DOI] [PubMed] [Google Scholar]
- 31.Tafani M, Russo A, Di Vito M, Sale P, Pellegrini L, Schito L, Gentileschi S, Bracaglia R, Marandino F, Garaci E, Russo MA. Up-regulation of pro-inflammatory genes as adaptation to hypoxia in MCF-7 cells and in human mammary invasive carcinoma microenvironment. Cancer Sci. 101(4):1014–23. doi: 10.1111/j.1349-7006.2010.01493.x. [DOI] [PMC free article] [PubMed] [Google Scholar]
- 32.Brooks C, Wang J, Yang T, Dong Z. Characterization of cell clones isolated from hypoxia-selected renal proximal tubular cells. Am J Physiol Renal Physiol. 2007;292(1):F243–52. doi: 10.1152/ajprenal.00236.2006. [DOI] [PubMed] [Google Scholar]
- 33.Liu Y, Song X, Wang X, Wei L, Liu X, Yuan S, Lv L. Effect of chronic intermittent hypoxia on biological behavior and hypoxia-associated gene expression in lung cancer cells. J Cell Biochem. 111(3):554–63. doi: 10.1002/jcb.22739. [DOI] [PubMed] [Google Scholar]
- 34.Giatromanolaki A, Bai M, Margaritis D, Bourantas KL, Koukourakis MI, Sivridis E, Gatter KC. Hypoxia and activated VEGF/receptor pathway in multiple myeloma. Anticancer Res. 30(7):2831–6. [PubMed] [Google Scholar]
- 35.Dankbar B, Padro T, Leo R, Feldmann B, Kropff M, Mesters RM, Serve H, Berdel WE, Kienast J. Vascular endothelial growth factor and interleukin-6 in paracrine tumor-stromal cell interactions in multiple myeloma. Blood. 2000;95(8):2630–6. [PubMed] [Google Scholar]
- 36.Gupta D, Treon SP, Shima Y, Hideshima T, Podar K, Tai YT, Lin B, Lentzsch S, Davies FE, Chauhan D, Schlossman RL, Richardson P, Ralph P, Wu L, Payvandi F, Muller G, Stirling DI, Anderson KC. Adherence of multiple myeloma cells to bone marrow stromal cells upregulates vascular endothelial growth factor secretion: therapeutic applications. Leukemia. 2001;15(12):1950–61. doi: 10.1038/sj.leu.2402295. [DOI] [PubMed] [Google Scholar]
- 37.Tanaka Y, Abe M, Hiasa M, Oda A, Amou H, Nakano A, Takeuchi K, Kitazoe K, Kido S, Inoue D, Moriyama K, Hashimoto T, Ozaki S, Matsumoto T. Myeloma cell-osteoclast interaction enhances angiogenesis together with bone resorption: a role for vascular endothelial cell growth factor and osteopontin. Clin Cancer Res. 2007;13(3):816–23. doi: 10.1158/1078-0432.CCR-06-2258. [DOI] [PubMed] [Google Scholar]
- 38.Giuliani N, Colla S, Lazzaretti M, Sala R, Roti G, Mancini C, Bonomini S, Lunghi P, Hojden M, Genestreti G, Svaldi M, Coser P, Fattori PP, Sammarelli G, Gazzola GC, Bataille R, Almici C, Caramatti C, Mangoni L, Rizzoli V. Proangiogenic properties of human myeloma cells: production of angiopoietin-1 and its potential relationship to myeloma-induced angiogenesis. Blood. 2003;102(2):638–45. doi: 10.1182/blood-2002-10-3257. [DOI] [PubMed] [Google Scholar]
- 39.Vacca A, Ribatti D. Bone marrow angiogenesis in multiple myeloma. Leukemia. 2006;20(2):193–9. doi: 10.1038/sj.leu.2404067. [DOI] [PubMed] [Google Scholar]
- 40.Kumar S, Witzig TE, Timm M, Haug J, Wellik L, Kimlinger TK, Greipp PR, Rajkumar SV. Bone marrow angiogenic ability and expression of angiogenic cytokines in myeloma: evidence favoring loss of marrow angiogenesis inhibitory activity with disease progression. Blood. 2004;104(4):1159–65. doi: 10.1182/blood-2003-11-3811. [DOI] [PubMed] [Google Scholar]
- 41.Hose D, Moreaux J, Meissner T, Seckinger A, Goldschmidt H, Benner A, Mahtouk K, Hillengass J, Reme T, De Vos J, Hundemer M, Condomines M, Bertsch U, Rossi JF, Jauch A, Klein B, Mohler T. Induction of angiogenesis by normal and malignant plasma cells. Blood. 2009;114(1):128–43. doi: 10.1182/blood-2008-10-184226. [DOI] [PubMed] [Google Scholar]
- 42.Hu J, Handisides DR, Van Valckenborgh E, De Raeve H, Menu E, Vande Broek I, Liu Q, Sun JD, Van Camp B, Hart CP, Vanderkerken K. Targeting the multiple myeloma hypoxic niche with TH-302, a hypoxia-activated prodrug. Blood. 116(9):1524–7. doi: 10.1182/blood-2010-02-269126. [DOI] [PubMed] [Google Scholar]
- 43.Chapman MA, Lawrence MS, Keats JJ, Cibulskis K, Sougnez C, Schinzel AC, Harview CL, Brunet JP, Ahmann GJ, Adli M, Anderson KC, Ardlie KG, Auclair D, Baker A, Bergsagel PL, Bernstein BE, Drier Y, Fonseca R, Gabriel SB, Hofmeister CC, Jagannath S, Jakubowiak AJ, Krishnan A, Levy J, Liefeld T, Lonial S, Mahan S, Mfuko B, Monti S, Perkins LM, Onofrio R, Pugh TJ, Rajkumar SV, Ramos AH, Siegel DS, Sivachenko A, Stewart AK, Trudel S, Vij R, Voet D, Winckler W, Zimmerman T, Carpten J, Trent J, Hahn WC, Garraway LA, Meyerson M, Lander ES, Getz G, Golub TR. Initial genome sequencing and analysis of multiple myeloma. Nature. 471(7339):467–72. doi: 10.1038/nature09837. [DOI] [PMC free article] [PubMed] [Google Scholar]
Associated Data
This section collects any data citations, data availability statements, or supplementary materials included in this article.


