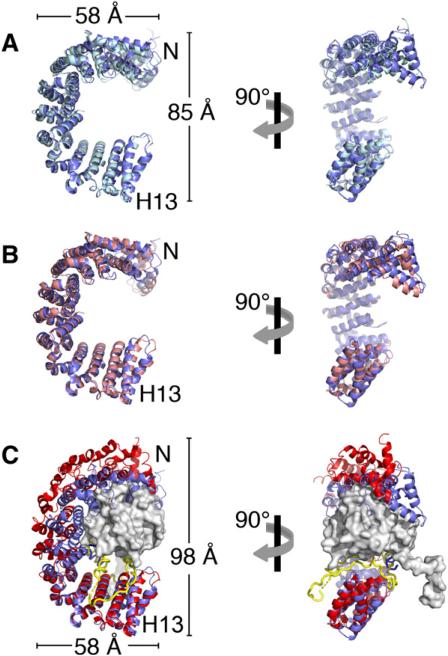
Figure 4. Conformational Change in the Kapβ2 N-Terminal Arch.
(A) Ribbon diagram of the N-terminal arches of chains A (blue) and C (light blue) of unliganded Kapβ2, superimposed at H9–H13.
(B) Same as (A), except that chain A of unliganded Kapβ2 is superimposed on substrate-bound Kapβ2 (pink).
(C) Same as (A), except that chain A of Kapβ2 is superimposed on Ran-bound Kapβ2 (red). Ran is shown as a surface representation in gray and the H8 loop of the Ran complex is in yellow.

