Abstract
Receptive field organization of cone-driven bipolar cells was investigated by intracellular recording in the intact light-adapted retina of the tiger salamander (Ambystoma tigrinum). Centered spots and concentric annuli of optimum dimensions were used to selectively stimulate the receptive field center and surround with sinusoidal modulations of contrast at 3 Hz. At low contrasts, responses of both the center and surround of both ON and OFF bipolar cells were linear, showing high gain and thus contrast enhancement relative to cones. The contrast/response curves for the fundamental response, measured by a Fast Fourier Transform, reached half maximum amplitude quickly at 13% contrast followed by saturation at high contrasts. The variation of the normalized amplitude of the center and surround responses was remarkably similar, showing linear regression over the entire response range with very high correlations, r2 = 0.97 for both ON and OFF cells. The contrast/response curves of both center and surround for both ON and OFF cells were well fit (r2 = 0.98) by an equation for single-site binding. In about half the cells studied, the nonlinear waveforms of center and surround could be brought into coincidence by scaling and shifting the surround response in time. This implies that a nonlinearity, common to both center and surround, occurs after polarity inversion at the cone feedback synapse. Evidence from paired whole-cell recordings between single cones and OFF bipolar cells suggests that substantial nonlinearity is not due to transmission at the cone synapse but instead arises from intrinsic bipolar cell and network mechanisms. When sinusoidal contrast modulations were applied to the center and surround simultaneously, clear additivity was observed for small responses in both ON and OFF cells, whereas the interaction was strikingly nonadditive for large responses. The contribution of the surround was then greatly reduced, suggesting attenuation at the cone feedback synapse.
Keywords: Retinal bipolar cells, Center/surround receptive field, Contrast responses
Introduction
Center/surround receptive field organization in the retinal network is widely recognized as a fundamental feature of visual processing (Dowling, 1987; Nelson & Kolb, 2004; Sterling, 2004; Wu, 2010). First discovered more than 50 years ago in ganglion cells (Kuffler, 1953), it has since been studied extensively. It is now known to be established by circuitry earlier in the retinal pathway involving the interaction of horizontal, photoreceptor, and bipolar cells (Werblin & Dowling, 1968; Burkhardt, 1974; Wunk & Werblin, 1979; Witkovsky & Stone, 1987; Hare & Owen, 1996; Dacey et al., 2000; Fahey & Burkhardt, 2003; Miller, 2008; Wu, 2010). In part due to technical difficulties in intracellular recording from bipolar cells, some fundamental aspects of the circuitry and functional properties of surround antagonism in the outer retina remain unknown.
In this report, we provide new findings on center/surround antagonism in bipolar cells by working in the retina of the tiger salamander (Ambystoma tigrinum). This extensively studied animal model has somewhat larger bipolar cells than most vertebrates and thereby provides a favorable preparation for intracellular recording from bipolar cells. Sinusoidal modulation of contrast is used to selectively activate the center or surround of the receptive field via spots and annuli of optimal dimensions. By quantitative analysis of the fundamental component of the Fourier spectra, we provide evidence for a remarkably high correlation (r2 = 0.97) in the response of the center and surround mechanisms of both ON and OFF bipolar cells. The contrast/modulation curves of center and surround in both ON and OFF bipolar cells are linear with high gain for low modulations and rise steeply, and are subsequently nonlinear, showing strong saturation along with the emergence of harmonic components. All curves for both center and surround of both ON and OFF cells are well fit by the classic equation for single-site binding. Analysis of response waveforms and paired cone bipolar cell recordings provide some evidence for possible sites and mechanisms of nonlinearity in the center and surround. When center and surround are stimulated at the same time, we show that the responses interact by algebraic addition at low contrasts, whereas the influence of the surround is greatly attenuated by the center for large amplitude responses evoked by high contrasts.
Materials and methods
Preparation and intracellular recording
Intracellular recordings were made at the University of Minnesota from flat-mounted sections of the eyecup of the aquatic tiger salamander (A. tigrinum), as described previously in detail (Burkhardt & Fahey, 1998; Burkhardt et al., 2004). Animals were anesthetized with a 1% solution of MS222 (tricaine methansulfate) for 15 min prior to decapitation and pithing in accordance with a protocol approved by the Institutional Care and Use Committee of the University of Minnesota. The retina was superfused at about 1 ml/min with a Ringer solution at room temperature (20–23°C.) composed of (in millimolar): 111 NaCl, 22 NaHCO3, 2.5 KCl, 1.5 MgCl2, 1.5 CaCl2, and 9 dextrose. The pH was regulated at about 7.5 by bubbling the superfusate with 98% O2 and 2% CO2. Intracellular recordings were made with glass micropipettes whose resistances ranged from 600 to 900 MΩ when filled with 0.25 m KAcetate. Cell types were identified by functional criteria established in past work in the tiger salamander (Hare et al., 1986; Burkhardt & Fahey, 1998). Several subtypes of bipolar cells have been described from studies of responses to flashes in the dark in retinal slice preparations (Awatramani & Slaughter, 2000; Wu et al., 2000). About half of these subtypes were rod-dominant bipolars. The present report deals exclusively with contrast responses under background illumination that isolates cone-driven bipolar cells (Burkhardt & Fahey, 1998; Fahey & Burkhardt, 2001). Thus, these cells presumably include at least some of the cone-driven subtypes described in retinal slice preparations, but no finer distinctions are evident at present, in part due to the very different conditions of stimuli and adaptation used in the studies in question.
Light-evoked responses were permanently recorded on videotape and later digitized (0–5000 Hz bandwidth) for analysis. Responses to sinusoidal light modulation were analyzed by a Fast Fourier Transform (FFT) and by signal averaging with the aid of commercial software (Superscope™, GWI Instruments, Medford, Mass). The FFT analysis was carried out with 0.25 Hz bins and a sample of 8 s. Signal-averaged responses were typically based on 10–20 individual responses. Low-pass digital filtering was also used to achieve the optimal reduction of noise without producing detectable distortion of response amplitude and waveform. The maximum response to high sinusoidal modulation ranged from about 8 to 24 mV across our sample of cells. Measurements were made from a total of 31 bipolar cells and 17 were held for long periods necessary to complete a full series of detailed quantitative measurements (see Table 2). Differences in electrode seal from one cell to the next may lead to spurious and unknown differences in absolute amplitude in intracellular recordings. Moreover, no striking correlations between absolute amplitudes and the features of contrast processing analyzed here were apparent. Therefore, this report focuses on analysis of normalized amplitudes as discussed in detail in “Results.” An active matrix liquid crystal display (LCD) (MagnaByte m2x; Telex Communications, Minneapolis, MN), controlled by custom software, was used to apply contrast steps and sinusoidal modulation to the retina. Stimuli were calibrated with a linear photodiode at the plane of the retina. They were found to closely approximate pure sine waves at a frequency of 3 Hz, the frequency used in all our experiments. At modulations in the 80–92% range, small distortions in the stimulus were detected as higher harmonics in the FFT spectrum. In this range, the sum of the second to fifth higher harmonics amounted to ≤6% of the 3 Hz fundamental. The values for the harmonic components of cellular responses shown in “Results” have been corrected for the harmonics in the light stimulus.
Table 2.
Summary of the of the single-site binding equation, R/Rmax=Bmax × M/(M + Kd), for the semisaturation constant (Kd), the maximum binding coeffcient (Bmax), and the percent variance explained (r2)
| Kd | Bmax | r2 | |
|---|---|---|---|
| Center OFF | 17.1 (±2.4) | 118.8 (±3.23) | 99.0 (±0.3) |
| Surround OFF | 17.0 (±2.2) | 118.3 (±4.62) | 98.7 (±0.3) |
| Center ON | 15.5 (±3.2) | 118.3 (±5.39) | 98.2 (±0.4) |
| Surround ON | 15.5 (±4.7) | 117.5 (±3.37) | 97.8 (±0.8) |
The retina was held in a steady state of light adaptation by a continuously present background of 20 cd/m2. After penetrating a bipolar cell, the center of the receptive field was determined by flashing a 100-µm spot at various positions on the retina. The diameter of the centered spot was then varied in fixed steps to find the optimal diameter for stimulating the central receptive field mechanism. The optimum diameter ranged from about 100 to 500 µm, depending on the cell. To find the optimum dimensions of the receptive field surround, the outer diameter of a concentric annulus was fixed at 2000 µm, while the inner diameter (I.D.) was varied in discrete steps from 1400 to 100 µm. The fixed steps were: 100, 240, 382, 496, 609, 750, 1000, and 1490 µm. The same values were used for the diameter of centered spots with the addition of 2000 µm. Our software provided discrete steps in the above spatial values so intermediate values were not tested. Thus, we cannot exclude the possibility that intermediate values might have yielded slightly better isolation of the center and surround.
To analyze responses to sinusoidal illumination, contrast is specified, as is the convention, as percent Michelson contrast: Contrast = (Lmax − Lmin)/(Lmax − Lmin) × 100, where Lmax and Lmin are the luminance at the peak and trough of the sine wave, respectively.
Whole-cell recordings
Whole-cell recordings from retinal slices were performed at the University of Nebraska Medical Center using techniques similar to those described previously (Thoreson & Miller, 1996; Cadetti et al., 2005). Aquatic tiger salamanders (A. tigrinum; Kons Scientific, Germantown, WI) 18–25 cm in length were handled according to protocols approved by the Institutional Animal Care and Use Committee at the University of Nebraska Medical Center. The salamander was decapitated with heavy shears, the cranium hemisected, and the spinal cord rapidly pithed. Animals were kept on a 12 h light/dark cycle and sacrificed 1–2 h after the beginning of subjective night. After enucleation, the front of the eye was removed and the resulting eyecup was cut into thirds. A section of eyecup was then placed vitreal side down on a piece of filter paper (2 × 5 mm, Type AAWP, 0.8-µm pores; Millipore, Bedford, MA). After adhering to the filter paper, the retina was isolated under chilled amphibian superfusate. The retina and filter paper were cut into 125-µm slices using a razor blade tissue chopper. Retinal slices were rotated 90 deg to view the retinal layers under a water immersion objective (60X, 1.0 NA) on an upright fixed-stage microscope (Nikon E600FN, Tokyo, Japan). Slices were superfused at ~1 ml/min with an oxygenated solution containing (in millimolar): 111 NaCl, 2.5 KCl, 2 CaCl2, 0.5 MgCl2, 10 N-2-hydroxyethylpiperazine-N′ 2-ethanesulfonic acid (HEPES), and 5 glucose (pH 7.8).
Cones were voltage clamped simultaneously with adjacent postsynaptic horizontal or OFF bipolar cells using Multiclamp (Molecular Devices, Sunnyvale, CA), Axopatch 200B (Molecular Devices), and Optopatch (Cairn Research, Faversham, UK) patch-clamp amplifiers. Currents were low pass filtered at 2 kHz and acquired using a Digidata 1322 interface and pClamp 9.2 software (Molecular Devices). Acceptable access resistances were considered to be <50 MΩ. Charging curves in cone and bipolar cells can be fit by single exponentials consistent with a compact electrotonic structure amenable to voltage clamp (Thoreson & Miller, 1996; Cadetti et al., 2005). Bipolar cells were voltage clamped at −60 mV. Cones were stimulated with a sinusoidal voltage-clamp waveform (3 Hz) of 4 (−35 to −39 mV) or 20 mV (−30 to −50 mV) lasting for 9.9 s. With the 4-mV amplitude waveform, 16 trials were averaged for each cell. Between trials, cones were held at −70 mV. FFT analysis (described above) was initiated after the initial burst of release had subsided, and steady state conditions had been achieved (~100 ms into the trial).
Patch pipettes were pulled on a PP-830 vertical puller (Narishige USA, East Meadow, NY) from borosilicate glass pipettes (1.2 mm outer diameter (O.D.) and 0.9 mm inner diameter (I.D.) and had tips of ~2 µm O.D., with resistance values of 10–15 MΩ. Cone recording pipettes were filled with a solution containing (in millimolar): 40 CsGlutamate, 50 CsGluconate, 9.4 TEACl, 3.5 NaCl, 1 CaCl2, 1 MgCl2, 9.4 MgATP, 0.5 GTP, 5 EGTA, and 10 HEPES (pH 7.2). In paired recordings, bipolar cell pipettes were filled with (in millimolar): 48 CsGluconate, 42 CsCl, 9.4 TEACl, 3.5 NaCl, 1.9 MgCl2, 9.4 MgATP, 0.5 GTP, 5 EGTA, and 10 HEPES (pH 7.2). For current-clamp recordings from bipolar cells, pipettes were filled with (in millimolar): 55 KCH3SO4, 40 KCl, 3.5 NaCl, 1.9 MgCl2, 9.4 MgATP, 0.5 GTP, 5 EGTA, and 10 HEPES (pH 7.2).
Results
Responses of center and surround to sinusoidal modulation of contrast
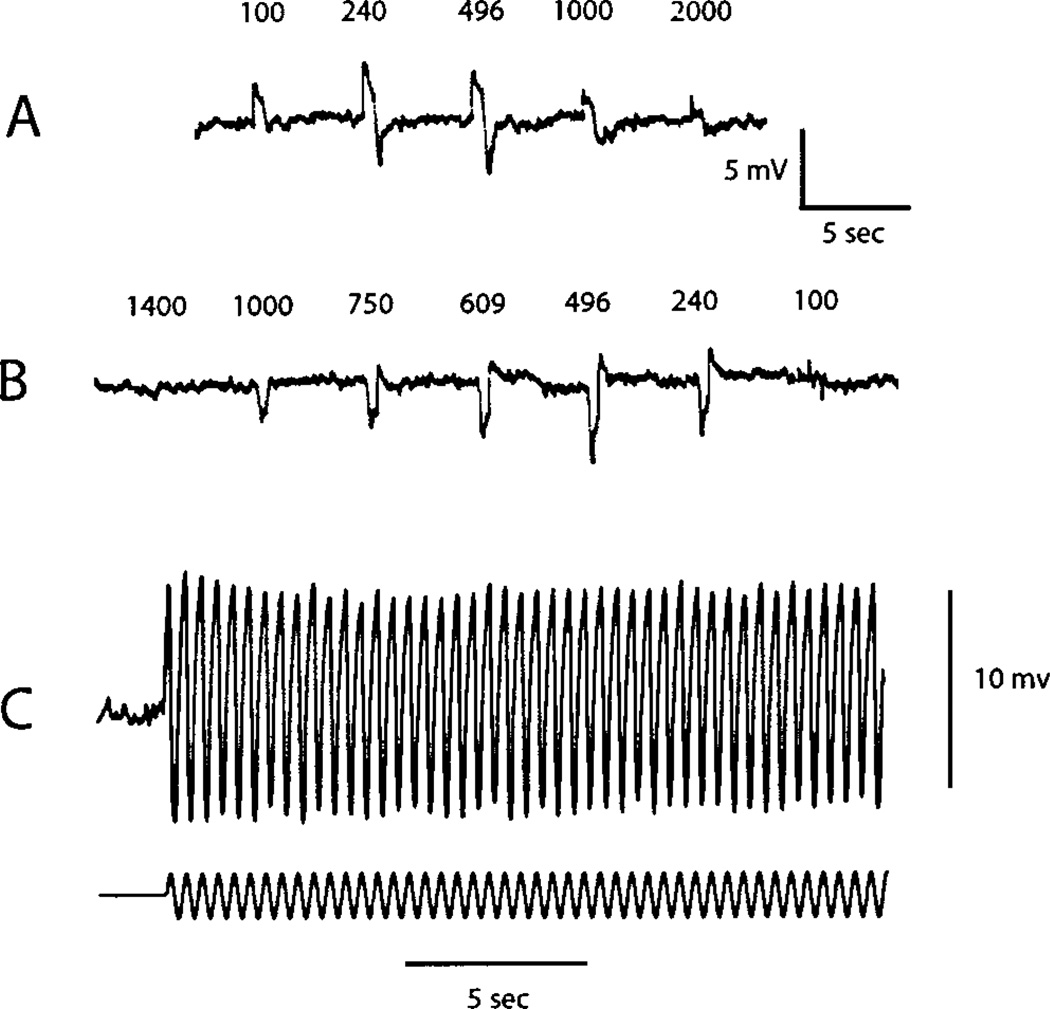
Fig. 1A shows the responses of an ONbipolar cell to centered spots of fixed contrast and variable diameter. The response is maximal at a diameter of 240 µm and then decreases progressively for all larger spots. Thus, 240 µm is the optimal diameter for stimulating the center. In Fig. 1B, a concentric annulus at the same contrast as used for the spot in Fig. 1A, is flashed to stimulate the receptive field surround. The outer diameter is fixed at 2000 µm, while the inner diameter is varied from 1400 to 100 µm. The cell hyperpolarizes with a maximal response for an inner diameter at 496 µm and then decreases. Thus, the optimal stimulus for activating the surround mechanism is an annulus of an inner diameter of 496 µm and an outer diameter of 2000 µm. In Fig. 1C, a centered spot set at a diameter of 240 µm is modulated sinusoidally at 3 Hz at a modulation depth of 80%. The peak-to-peak amplitude declines slightly in about 1–2 s to reach an apparent steady state. The decline in amplitude is consistent with that expected for the effect known as contrast adaptation or contrast gain control, that is, the sensitivity declines over several seconds following an increase from low to high contrast (Rieke, 2001; Baccus & Meister, 2002). In our preparation and stimulus conditions, the decline was typically rapid and small, as in Fig. 1C. Thus, in all the results described below, average responses were initiated about 2 s after the onset of the modulation for a period of about 15 s. The optimum dimensions for stimulating the center and surround were determined for each cell in the manner shown in Fig. 1A. Over our sample of cells, the optimum size of the center varied from 100 to 496 µm, with 240 µm being most typical. For the annulus, the optimum inner diameter varied from100 to 496 µm, with most typical values of 240 or 382 µm. The outer diameter was always set at 2000 µm. As discussed in “Materials and methods,” our software did not allow continuous variation in spatial stimulus dimensions. Thus, we cannot exclude the possibility that intermediate values might have yielded slightly better isolation of the center and surround.
Fig. 1.
Response of an ON bipolar cell to a contrast step of variable diameter (A) and variable inner diameter of a concentric annulus (B). Dimensions in microns are shown above each response. The 100-µm spot and all other stimuli are centered in the receptive field. The contrast step is 0.3 log unit, that is, two times greater than the steady background of 20 cd/m2. (C) Response to a sinusoidal modulation of 80% at a frequency of 3 Hz and diameter of 240 µm.
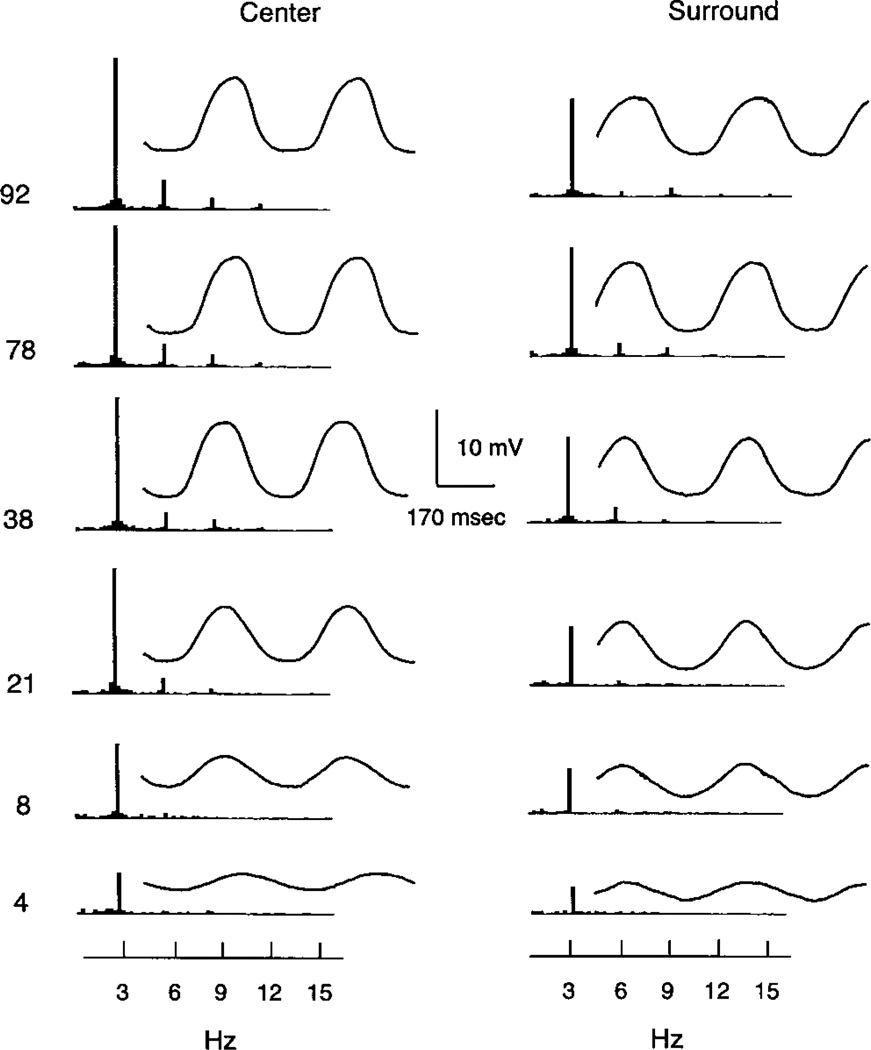
Fig. 2 shows signal-averaged waveforms and the FFT for an ON bipolar cell in response to 3 Hz modulation in the center and surround of the receptive field. The responses for center and surround are similar, while the waveforms differ by about 180 deg in phase, consistent with the opposite polarity of their responses evoked by light flashes. In both cases, the waveforms are approximately sinusoidal for low contrast modulations. The amplitude increases linearly for modulations of 4 and 8% but then tends to saturate at about 38% modulation and higher. The amplitude of the fundamental and the average response waveforms vary in parallel. However, all quantitative measurements in this report are based on the fundamental. Limitations of our LCD stimulator have not allowed us to examine responses to sinusoidal stimulation above 3 Hz.
Fig. 2.
Signal averaged waveforms and Fourier spectra (FFT) for an ON bipolar cell to contrast modulations from 4 to 92%. The FFT is to the left of the average response waveform. The left column shows responses to a centered spot of 240 µm. The right column shows responses to a concentric annulus with an inner diameter of 382 µm and an outer diameter of 2000 µm.
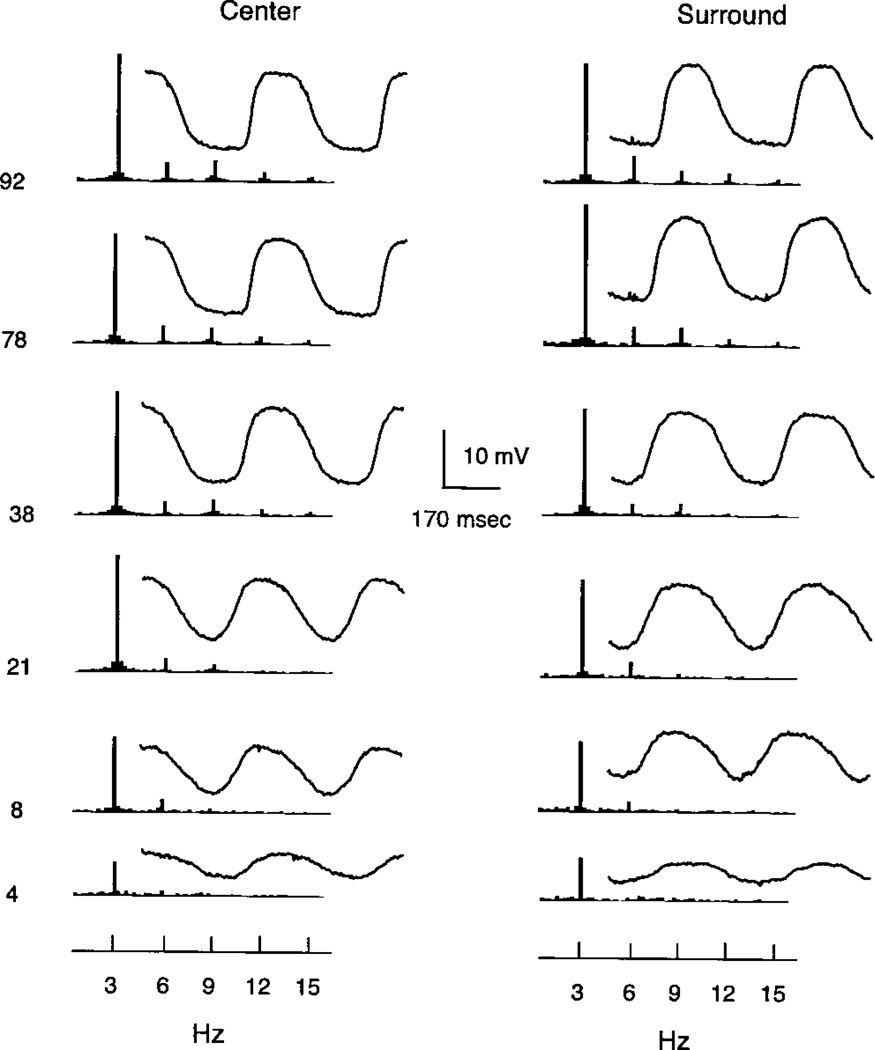
Fig. 3 shows average waveforms and the FFT for an OFF bipolar cell to modulation in the center and surround of the receptive field. The responses for center and surround are remarkably similar and in essence and show all the general features noted above for the ON bipolar of Fig. 2.
Fig. 3.
Signal averaged waveforms and Fourier spectra (FFT) for an OFF bipolar cell to contrast modulations from 4 to 92%. The FFT is to the left of the average response waveform. The left column shows responses to a centered spot of 240 µm. The right column shows responses to a concentric annulus with an inner diameter of 496 µm and an outer diameter of 2000 µm.
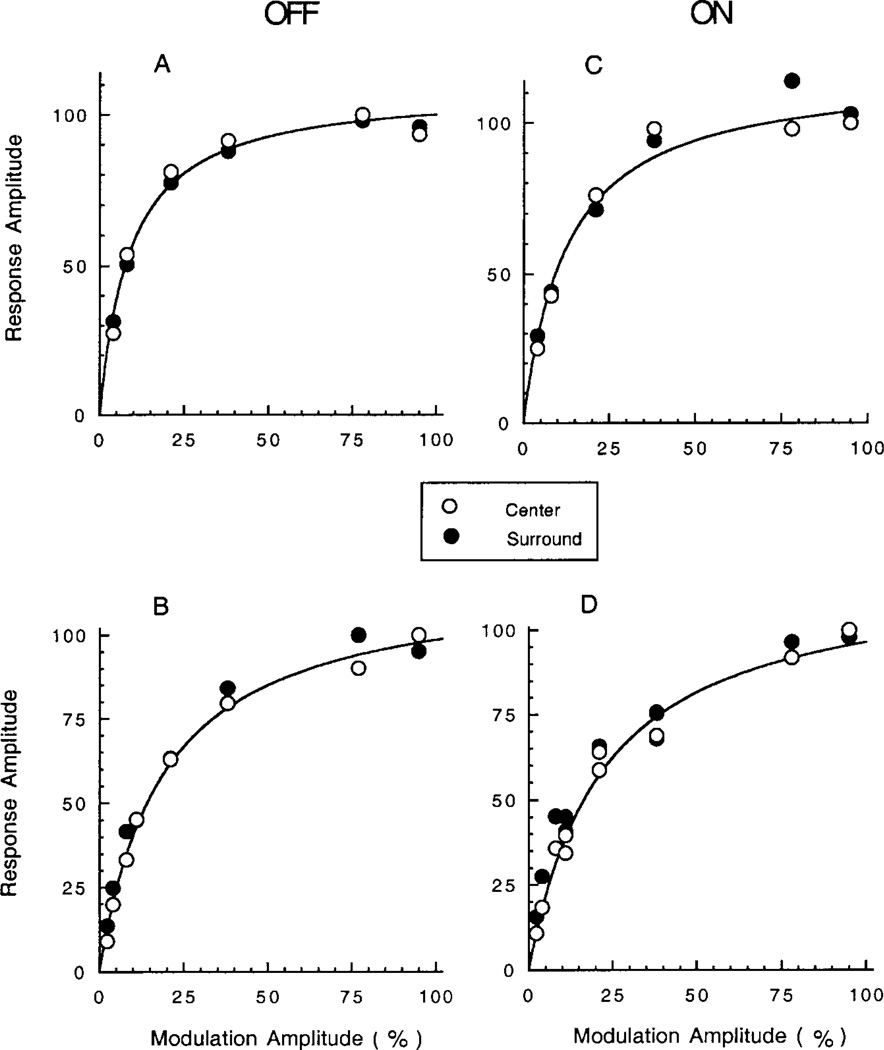
Fig. 4 shows the amplitude of the FFT 3 Hz fundamental as a function of the modulation depth of the stimulus. Across our sample of cells, the maximum amplitude of the surround was typically about 80% of the maximum response of the center [89% ± 4 standard error of the mean (s.e.m.) for OFF cells and 78% ± 4 (s.e.m.) for ON cells]. To further compare the center and surround response, the amplitude measurements were normalized, as in Fig. 4. The plots for center and surround are remarkably similar. The basic form of the modulation/response relation shows a linear region of high slope (thus high contrast gain) for small contrasts followed by saturation at high contrasts. The data were quantified by measuring the modulation producing a half-maximal response, m50, and calculating the contrast gain for small contrasts based on the slope in the linear range. As shown in Table 1, the contrast gain was about 6–7, on average. In both ON and OFF cells, the values for center and surround are remarkably similar. All the differences between cell types in Table 1 are statistically insignificant. Despite variation in contrast gain and m50 from cell to cell, in any given cell, the response of the center and surround remained highly correlated. The results in Fig. 4 have been selected to show a range for cells with steeper curves and thus higher values of contrast gain (A and C) as opposed to cells with shallower curves and lower contrast gain cells (B and D). Fig. 4A and 4B are OFF cells, whereas Fig. 4C and 4D is ON cells.
Fig. 4.
Contrast modulation/response measurements for the fundamental component of the FFT for two OFF bipolar cells (A and B, left column) and two ON bipolar cells (C and D, right column). The open and filled circles show results for centered spots and concentric annuli, respectively. Reponses are normalized with respect to the maximum response evoked by the spot. The smooth curves show the best-fitting equation for the single-site binding equation (see text). The percent of variance explained (r2) is 98% for the cell in (B) and 97% for the other three cells. All stimuli were of optimal dimensions for stimulating the center or surround mechanism, as determined from the basic procedure described for Fig. 1.
Table 1.
Contrast gain and m50 for center and surround (±S.E.M.) of ON and OFF cells (see text for details)
| Contrast gain | m50 | |
|---|---|---|
| Center OFF (n = 10) | 6.8 (± 2.3) | 12.93 (±1.50) |
| Surround OFF (n = 10) | 7.4 (±1.1) | 12.90 (±1.62) |
| Center ON (n = 7) | 5.8 (±0.8) | 13.79 (±2.01) |
| Surround ON (n = 7) | 6.0 (±1.4) | 12.91 (±2.47) |
As shown by the smooth curves in Fig. 4, the modulation/response curves are well described by a version of the classic equation for single-site binding: R = Bmax × M/(M + Kd), where R is the normalized amplitude of the fundamental of the FFT, M is the contrast modulation depth, Kd is the semisaturation for half-maximal binding, and Bmax is the coefficient for maximal binding. The best-fit equations of the modulation/response curves and, thus, Kd varied somewhat across our sample for both ON and OFF bipolars. However, in all cases, the fit for the center and surround curves remained very similar. Table 2 gives summary statistics for the fit of the single-site binding equation. All parameters are given in percent.
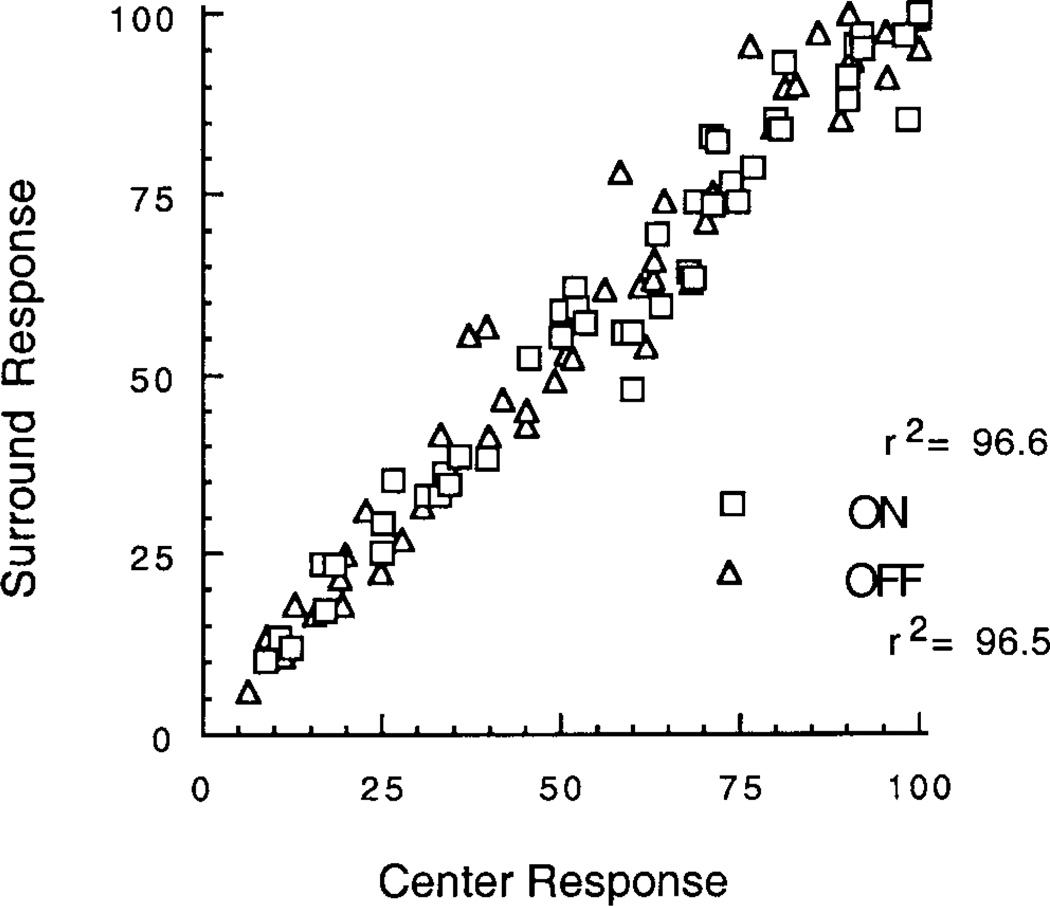
Fig. 5 shows a plot of the normalized amplitudes of the center and surround FFT fundamental response for all responses in all cells measured at all stimulus contrasts in our sample. The agreement between center and surround is very close. The best-fit linear regression for center and surround gives values for the percent of variance explained (r2) of 96.6 and 96.5%, respectively, for ON and OFF cells. Many points in the figure are not evident due to overlap. The total number of measurements is n = 67 for OFF cells and n = 56 for ON cells.
Fig. 5.
Plot of the response of the center and surround for all measurements of the normalized fundamental component of the FFT. Squares and diamonds are for ON and OFF bipolar cells, respectively. Many points are not evident due to overlap. The total number of measurements is n = 67 for OFF cells and n = 56 for ON cells. The percent of variance explained (r2) of the linear best-fit regression lines (not shown for clarity since they overlap closely) are 96.6 and 96.5% for ON and OFF cells, respectively.
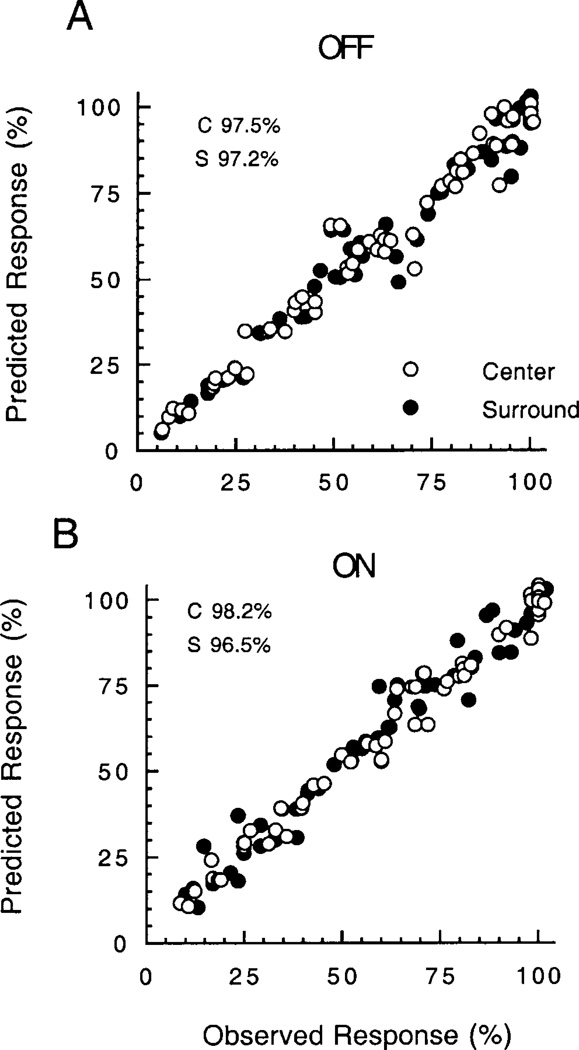
The plot in Fig. 6 summarizes the ability of the single-site binding equation to describe the relation between the center and surround for OFF cells (top) and ON cells (below). For the center and surround responses of each cell, the amplitude was normalized (see Fig. 4) and expressed in percent of the maximum response. These values are plotted on the x-axis against the normalized amplitude predicted from the best-fitting single-site binding equation for each cell on the y-axis. The correlations are very high. The percent of variance explained (r2) is: OFF center, 97.5; OFF surround, 97.2; ON center, 98.2; OFF surround, 96.5. Many of the points are not evident due to overlap. The total number of measurements is n = 67 for OFF cells and n = 56 for ON cells.
Fig. 6.
Plot of the observed amplitude of the fundamental component of the FFT versus the amplitude predicted from the best-fitting equation for single-site binding (see text for details). Many points are not evident due to overlap. The total number of measurements is n = 67 for OFF cells and n = 56 for ON cells. The percent of variance explained (r2) is: OFF center, 97.5; OFF surround, 97.2; ON center, 98.2; and OFF surround, 96.5.
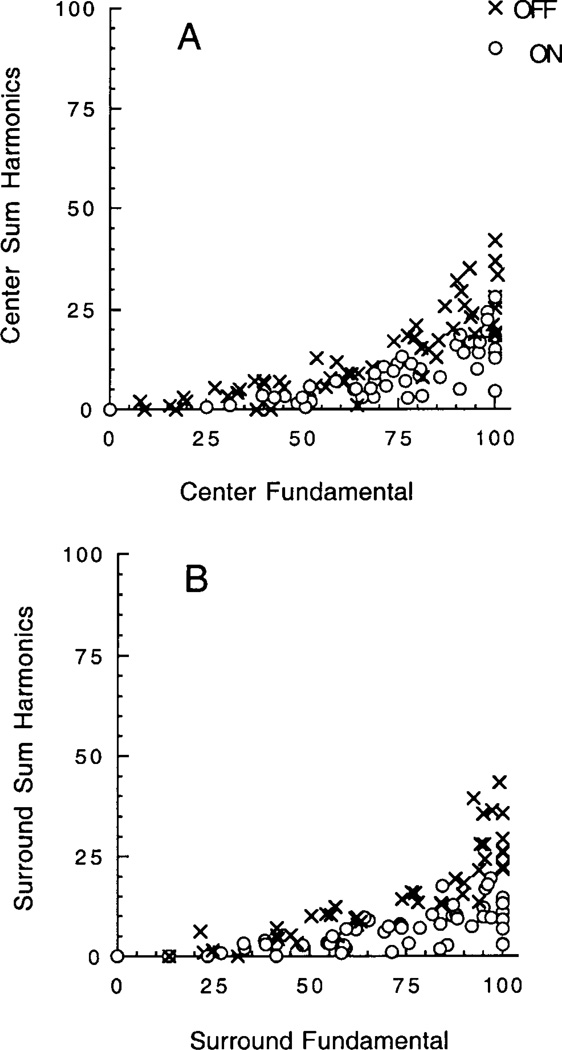
Figs. 4–6 are based on measurements of the fundamental component of 3 Hz for the FFT. However, inspection of Figs. 2 and 3 shows that harmonic distortion is evident at the higher modulations. This is shown in more detail in Fig. 7, where the amplitude of the 3 Hz fundamental is plotted against the total harmonic distortion, that is, the sum of all harmonics at 6, 9, 12, and 15 Hz. The summed harmonics are normalized relative to the maximum fundamental. The harmonics are insignificant at low modulations, consistent with the approximately linear responses in this range, whereas they emerge at higher modulations and may reach some 20–40% of the fundamental. On average, the harmonics tend to be larger for OFF than ON cells. Nevertheless, in both cases, the growth of the harmonics is similar for center (Fig. 7A) and surround (Fig. 7B). This provides a further instance in which center and surround vary in parallel.
Fig. 7.
Plot of the amplitude of the fundamental response (3 Hz) of the FFT and the total amplitude of the harmonics at 6, 9, 12, and 15 Hz. (A) and (B) show results for the center and surround, respectively. The symbols shown as X and open circles are for OFF and ON cells, respectively.
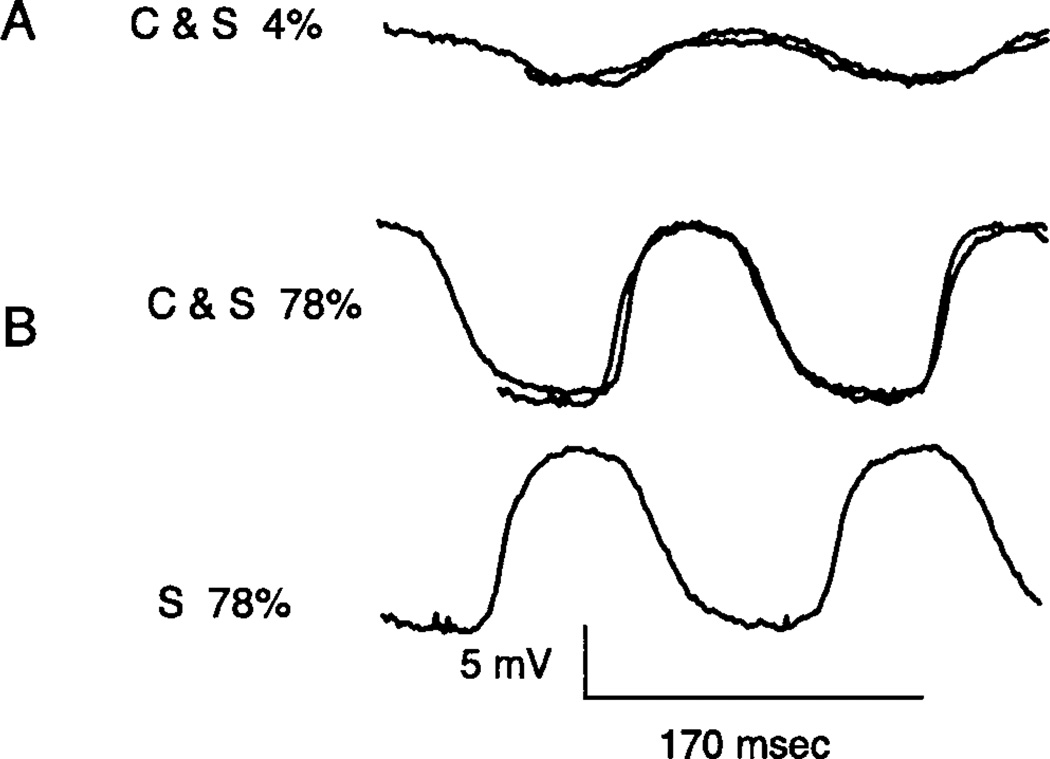
The waveform of the center and surround responses could often be superimposed by offsetting one from the other in time. This was invariably the case for small amplitude responses as shown in Fig. 8A. In about half of both ON (n = 4) and OFF (n = 5) cells, close superimposition was also found for large amplitude responses in the nonlinear range. An example is shown in Fig. 8B. The results with small amplitude responses in Fig. 8A are consistent with a simple mechanism that introduces a delay and polarity inversion of the surround signal relative to that of the center. The result in Fig. 8B is consistent with a delay and polarity inversion followed by a common nonlinearity in the overall pathway for both the center and surround, as will be elaborated in the “Discussion.” Close superimposition of nonlinear responses of large amplitude was not found in about half of the cells in our sample.
Fig. 8.
Response of an OFF bipolar cell for stimuli applied to the center (C) or the surround (S) at contrast modulation of 4% in (A) and 78% in (B). The response of the surround has been normalized and shifted laterally to yield a best fit with the response of the center. The bottom trace in (B) (S 78%) shows the response of the surround without a lateral shift. Note that the waveforms in (B), although distorted sine waves and in the nonlinear range, can still be brought into close registration. The diameter for the centered spot is 240 µm. The i.d. of the annulus used to stimulate the surround is 382 µm.
Responses of OFF bipolar cells to injection of sinusoidal current in cones
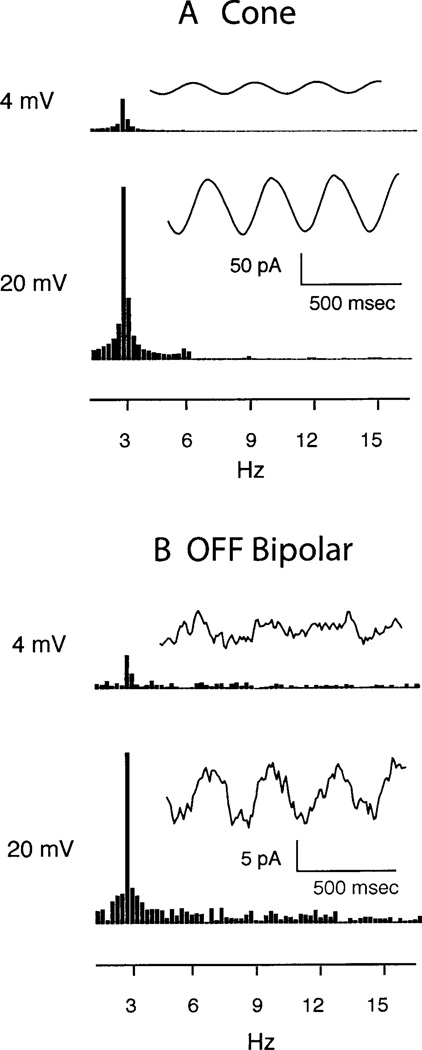
To gain insights into the mechanisms responsible for nonlinearity in the pathway, we obtained whole-cell voltage-clamp recordings simultaneously from cones and OFF bipolar cells using a retinal slice preparation. For these experiments, feedback from horizontal cells was inhibited by HEPES (10 mM) (Hirasawa & Kaneko, 2003). Cone membrane potential was varied sinusoidally using 3 Hz voltage-clamp waveforms of 4 (−35 to −39 mV) or 20 mV (−30 to −50 mV) in amplitude. The smaller sine wave simulates the cone voltage response to a sinusoid of low modulation depth, and the larger sine wave approximates the cone voltage response to high modulation. For the smaller waveform, responses from each cell were averaged over 16 trials. Fig. 9A shows the average membrane currents from 12 cones stimulated with large and small sinusoids. Responses of individual cones were similar to the average. Cone membrane currents followed the large and small sinusoidal voltage stimuli in a nearly linear fashion. The ratio of the peak amplitudes of the FFT for the 4- and 20-mV stimuli is about 4.7 in Fig. 9A, which is very close to the ratio of 5.0 expected for exact linearity. Very small harmonics were observed at 6, 9, and 12 Hz when using the 20-mV sine wave stimulus.
Fig. 9.
Synaptic transmission does not contribute substantial nonlinearities to OFF bipolar cell responses. (A) Cone membrane currents evoked by sinusoidal modulation of the cone membrane potential using 3 Hz waveforms of 4 (−35 to −39 mV, top) and 20 mV (−30 to −50 mV, bottom). Current segments (right) and FFTs (left) are illustrated for both stimulus protocols. Note the very small harmonic evident at 6, 9, and 12 Hz in the responses to 20 mV sinusoids. (B) Postsynaptic currents evoked in OFF bipolar cells by sinusoidal modulation of cones by 3 Hz waveforms of 4 (top) and 20 mV (bottom). Synaptic current waveforms (right) and FFTs (left) are illustrated for both stimulus protocols. For both cone and OFF bipolar cells, responses with 20 mV waveforms were averaged from single trials across 12 cells. For the 4-mV waveform, responses were averaged from 16 trials across 12 cells.
By modulating synaptic release of glutamate, sinusoidal modulation of the presynaptic cone membrane potential caused a sinusoidal change in postsynaptic glutamatergic currents recorded from OFF bipolar cells. We analyzed OFF bipolar cells because ON bipolar cell responses exhibited rapid rundown in the whole-cell recording configuration. Fig. 9B shows synaptic currents averaged from 12 OFF bipolar cells. Responses of individual cells were similar but noisier. Within measurement error, synaptic currents evoked by glutamate release from cones followed the cone command waveform nearly linearly with both small and large sinusoids. The ratio of the peak amplitudes of the FFT for the 4- and 20-mV stimuli is about 5.1 in Fig. 9B, which is very close to the ratio of 5.0 expected for exact linearity. Very small harmonics were observed at 6, 9, or 12 Hz (Fig. 9B).
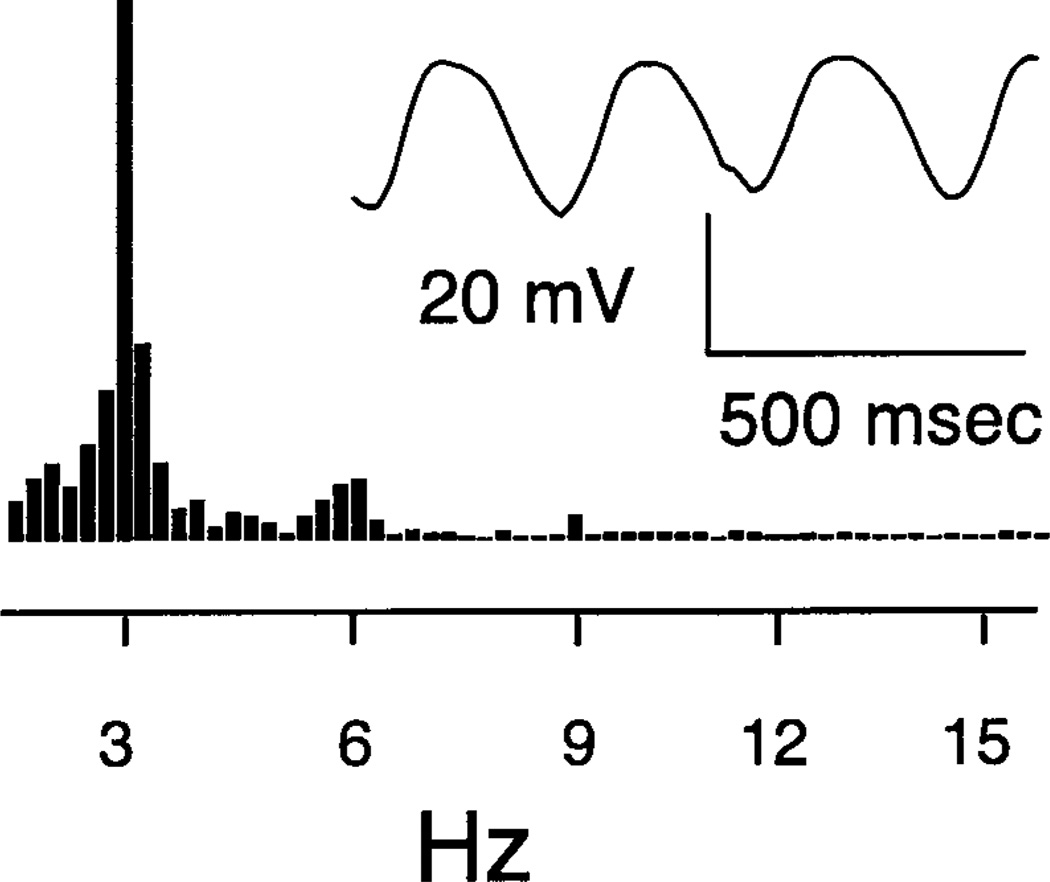
We tested whether nonlinearities might be introduced by voltage-dependent conductances in OFF bipolar cells by directly injecting sinusoidal current to modulate bipolar cell membrane potential. We approximated strong sinusoidal light modulation by using currents (12.9 ± 1.8 pA) that produced peak-to-peak voltage excursions of 22.6 ± 1.4 mV (N = 7) around a mean of −47.0 ± 1.3 mV. As shown by the example in Fig. 10, sinusoidal current produced modest nonlinearities, with harmonics of 7–10% of the fundamental. Larger voltage excursions which enter more strongly nonlinear regions of the current/voltage relationship produced greater nonlinearity. Conversely, smaller voltage excursions produced more linear behavior. These data suggest that voltage-dependent conductances may contribute to nonlinearities in the OFF bipolar light response but are insufficient by themselves to wholly account for the nonlinearities observed in the voltage responses of OFF bipolar cells evoked by sinusoidally modulated light stimuli.
Fig. 10.
Injection of 3 Hz sinusoidal current (15 pA) into an OFF bipolar cell produced only modest nonlinearities in the resulting voltage change. Note the small harmonics at 6 and 9 Hz in the FFT (left). The FFT was calculated from the average of eight trials. A segment of the average voltage waveform is also shown (right). Mean membrane potential was −48.6 mV.
Interaction between center and surround responses
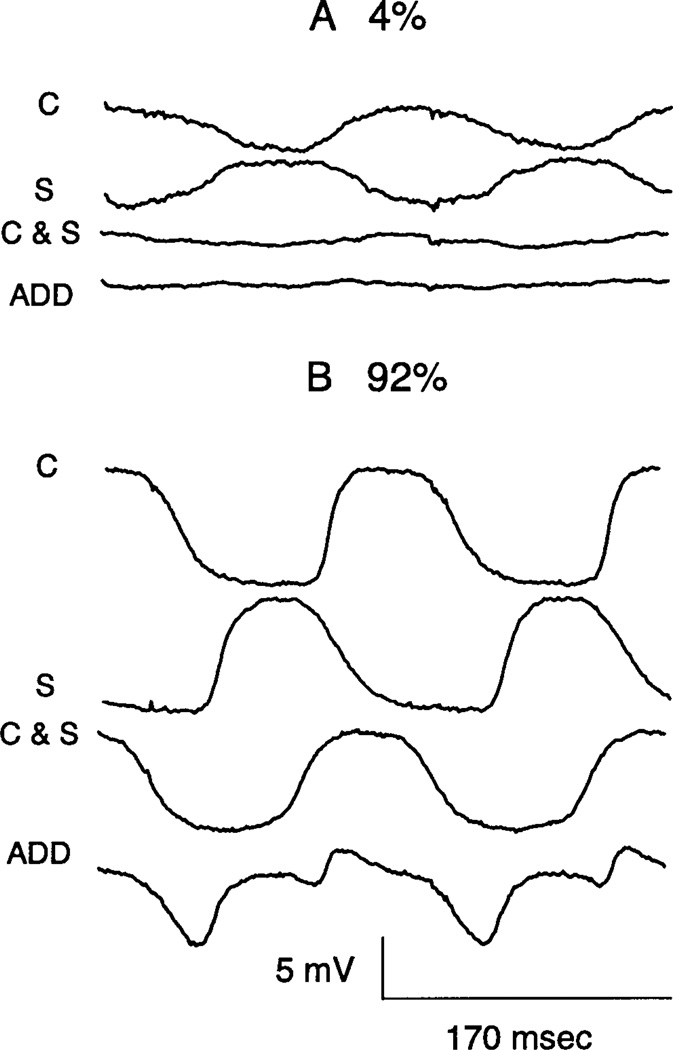
Interaction between center and surround was analyzed by comparing responses evoked by spots and annuli when applied separately or together. Additivity was found for small amplitude responses. Thus, when both center and surround were activated simultaneously, the resultant response was close to the algebraic sum of the individual responses, as shown in Fig. 11A. In further experiments, a minimum, that is, approximate null response, was found when the surround was advanced about 33–66 ms relative to the center, consistent with the well-known generalization that the surround tends to have a longer latency than the center. For large amplitude responses, marked departures from additivity were found. An example is shown in Fig. 11B for modulations of 92%. C and S show the center and surround response evoked separately, whereas C&S shows the response when the same stimuli are applied simultaneously. ADD shows the results of the addition of the C and S traces. Thus, it is very clear that the center and surround responses do not sum in Fig. 11B. In fact, the recorded response is heavily weighted toward the center response. This was a robust finding that held independent of the polarity of the center response. Thus, for both ON and OFF cells, the center response dominated the surround for large amplitude responses. The transition from additivity for small responses to center dominance for large responses was found to be progressive in further tests (not shown), where the relative contrasts of the spot and annulus were systematically varied in magnitude.
Fig. 11.
Intracellular recordings of responses of an OFF cell to stimulation of the center (C) or surround (S) separately or together (C&S) at 4 (A) and 92% (B) modulations. ADD shows the results of the addition of the C and S traces. The diameter for the centered spot is 240 µm. The i.d. of the annulus used to stimulate the surround is 382 µm.
Discussion
The approach of this report of comparing the response of the center and surround of bipolar cells to sinusoidal modulation of contrast has, to our knowledge, not been reported heretofore. With light adaptation set by background illumination of 20 cd/m2 used here, responses of the bipolar cells are known to be driven by long-wave cones (Burkhardt & Fahey, 1998; Fahey & Burkhardt, 2001). Quantitative analysis of the contrast modulation curves for the fundamental component of the Fourier spectra has revealed a remarkable similarity in the response of center and surround. This holds equally well for both ON and OFF cells (Figs. 4 and 5). The correlation between the normalized responses of center and surround are very high with an r2 of 96.6 and 96.5%, respectively, for ON and OFF cells. Previous results with contrast steps revealed an apparent symmetry between center and surround when comparisons were made between responses of the same polarity evoked by steps of opposite contrast polarity (Fahey & Burkhardt, 2003). These results seem qualitatively consistent with the findings in the present report.
The contrast gain of the surround is virtually identical to that of the center and thus shows a contrast enhancement of about 6 relative to that previously measured for cones (Burkhardt & Fahey, 1998; Fahey & Burkhardt, 2001; Burkhardt, 2010). The entire form of the contrast/response curves is very well fit by the single-site binding equation (Figs. 4 and 6) that shows high gain followed by saturation. Despite secondary variations from cell to cell, it is important to stress that all the bipolar cells in our sample show marked nonlinearity for both center and surround (Fig. 4 and Table 2). On the other hand, the cone voltage is known to be low gain and nearly linear (Burkhardt & Fahey, 1998; Fahey & Burkhardt, 2001). Hence, it is possible that single-site binding reflects a basic cellular mechanism shaping the fundamental response of both ON and OFF bipolar cells. On the other hand, the fit may only reflect the net of several underlying and potentially diverse mechanisms. At minimum, however, it should provide a basic constraint on future quantitative models of the overall response of bipolar cells. The present findings apply only to the fundamental component of the FFT. It is of interest that the parameter, Bmax, as shown in Table 2, typically has a value of about 120%. Mechanistically, this implies that all the binding sites are not filled for sinusoidal modulations of 100%. This is compatible with two further observations: 1) Harmonics are significant at higher modulations (Fig. 7), whereas the binding equation only applies to our measurements of the fundamental component. 2) Past results clearly show that the maximum voltage range evoked by 100% sinusoidal modulation is about 20% less than that evoked by contrast steps (Burkhardt et al., 2004, Fig. 10).
The analysis of the response waveforms has revealed two basic findings: 1) For low modulations, the waveforms are approximately sinusoidal, as required for responses in the linear range (Figs. 2, 3, and 8A). 2) For high modulations and large responses, the amplitude tends to saturate, harmonics emerge, and the waveforms are clearly distorted (Figs. 2, 3, and 8B). In about half of our sample of ON and OFF cells, the distortion of the waveforms of the center and surround was found to be very similar and virtually identical when the surround was scaled and shifted in time, as shown in Fig. 8B. The responses then superimpose. This result is consistent with the existence of a common nonlinearity in the overall pathway for both center and surround. In this model, the common nonlinearity must occur after, not before, the polarity inversion of the surround for superimposition to hold. It is generally believed that the polarity inversion is due to feedback from horizontal cells to cones. Thus, it follows that the common nonlinearity must occur proximal to the feedback synapse. Although beyond the scope of the present report, it will be of interest in the future to investigate the effects of HEPES buffer in the intact eyecup under our stimulus conditions since there is evidence that HEPES attenuates the influence of feedback from horizontal cells to cones (Hirasawa & Kaneko, 2003; Cadetti & Thoreson, 2006; Packer et al., 2010).
In the other half of our cells, the center and surround waveforms were similar but not completely superimposeable when scaled and shifted in time. Hence, mechanisms in addition to, or other than, a common nonlinearity seem involved for these cells; a suggestion compatible with evidence that the surround of some bipolar cells may be shaped by several mechanisms in addition to cone feedback (Fahey & Burkhardt, 2003; Zhang & Wu, 2009; Burkhardt, 2010). Zhang and Wu (2009) conclude that there are four different pathways and mechanisms in addition to horizontal-cone feedback in the salamander retina: horizontal to bipolar (chemical), horizontal to bipolar (electrical), feedback from ON amacrine cells, and feedback from OFF amacrine cells. Moreover, there are differences in the contributions of these pathways to ON and OFF bipolar cells and whether the latter are driven by rods, cones, or mixed input. The relative influence of these pathways, relative to each other and to horizontal-cone feedback, remains to be quantified. Thus, at present, it is uncertain to what degree these pathways may contribute to the resultant surround responses observed in the present report.
Direct sinusoidal modulation of voltage-clamped cones produced nearly linear cone membrane currents and nearly linear postsynaptic currents in voltage-clamped OFF bipolar cells. These data indicate that substantial nonlinearity is not introduced by cone membrane currents or the synaptic mechanisms, which connect cones to OFF bipolar cells. Direct modulation of bipolar cell membrane potential by injection of sinusoidal current produced modest nonlinearities, suggesting that activation of voltage-dependent conductances in OFF bipolar cells may contribute to nonlinearities but cannot fully account for them. Sinusoidally varying illumination modulates many cones and bipolar cells simultaneously even when using small spots as stimuli. Nonlinearities might therefore also arise from network interactions among these cells.
The main findings for intracellular recordings summarized to this point come from stimulating the center or surround separately. In further experiments, we have stimulated the surround and center simultaneously and obtained evidence for their interaction. For low modulations in both ON and OFF cells, center and surround responses tend to combine by simple linear addition (Fig. 11A). This result was robust and implies that the direct response to light and the feedback mechanism of the cone interact in a linear fashion for small responses. The results were radically different for large responses evoked by high modulations. Additivity failed dramatically and the resulting waveform appeared to be dominated by the center mechanism, as shown in Fig. 11B. This implies that the effect of the feedback synapse is greatly reduced when both center and surround are simultaneously and strongly activated. The effect cannot be simulated by mere scaling of the surround as would occur due to shunting. This dominance of the center for sinusoidal stimuli differs from the well-known finding when both center and surround are stimulated by light flashes of large diameter. After some delay, the surround then seems to strongly attenuate the center response (Fig. 1A this report; Werblin & Dowling, 1968; Hare & Owen, 1990; Fahey & Burkhardt, 2001; Zhang & Wu, 2009). This apparent difference in the interaction between center and surround remains to be resolved in the future.
Acknowledgments
This research was supported by NIH grant EY00406 to D.A.B., NIH grant EY10542 to W.B.T., and Research to Prevent Blindness.
References
- Awatramani G, Slaughter MM. Origin of transient and sustained responses in ganglion cells of the retina. The Journal of Neuroscience. 2000;15:7087–7095. doi: 10.1523/JNEUROSCI.20-18-07087.2000. [DOI] [PMC free article] [PubMed] [Google Scholar]
- Baccus SA, Meister M. Fast and slow contrast adaptation in retinal circuitry. Neuron. 2002;36:909–919. doi: 10.1016/s0896-6273(02)01050-4. [DOI] [PubMed] [Google Scholar]
- Burkhardt DA. Sensitization and center-surround antagonism in Necturus retina. The Journal of Physiology. 1974;236:593–610. doi: 10.1113/jphysiol.1974.sp010454. [DOI] [PMC free article] [PubMed] [Google Scholar]
- Burkhardt DA. Contrast processing by ONand OFF bipolar cells. Visual Neuroscience. 2010;28:69–75. doi: 10.1017/S0952523810000313. [DOI] [PubMed] [Google Scholar]
- Burkhardt DA, Fahey PK. Contrast enhancement and distributed encoding by bipolar cells in the retina. Journal of Neurophysiology. 1998;80:1070–1081. doi: 10.1152/jn.1998.80.3.1070. [DOI] [PubMed] [Google Scholar]
- Burkhardt DA, Fahey PK, Sikora MA. Retinal bipolar cells: Contrast encoding for sinusoidal modulation and steps of luminance contrast. Visual Neuroscience. 2004;21:883–893. doi: 10.1017/S095252380421608X. [DOI] [PubMed] [Google Scholar]
- Cadetti L, Tranchina D, Thoreson WB. A comparison of release kinetics and glutamate receptor properties in shaping rod-cone differences in EPSP kinetics in the salamander retina. Journal of Physiology (London) 2005;569:773–788. doi: 10.1113/jphysiol.2005.096545. [DOI] [PMC free article] [PubMed] [Google Scholar]
- Cadetti L, Thoreson WB. Feedback effects of horizontal cell membrane potential on cone calcium currents studied with simultaneous recordings. Journal of Neurophysiology. 2006;95:1992–1995. doi: 10.1152/jn.01042.2005. [DOI] [PMC free article] [PubMed] [Google Scholar]
- Dacey D, Packer OS, Diller L, Brainard D, Peterson B, Lee B. Center surround receptive field structure of cone bipolar cells in primate retina. Vision Research. 2000;40:1801–1811. doi: 10.1016/s0042-6989(00)00039-0. [DOI] [PubMed] [Google Scholar]
- Dowling JE. The Retina: An Approachable Part of the Brain. Cambridge, MA: Belknap Press; 1987. [Google Scholar]
- Fahey PK, Burkhardt DA. Effects of light adaptation on contrast processing in bipolar cells in the retina. Visual Neuroscience. 2001;18:581–597. doi: 10.1017/s0952523801184087. [DOI] [PubMed] [Google Scholar]
- Fahey PK, Burkhardt DA. Center-surround organization in bipolar cells: Symmetry for opposing contrasts. Visual Neuroscience. 2003;20:1–10. doi: 10.1017/s0952523803201012. [DOI] [PubMed] [Google Scholar]
- Hare WA, Lowe JS, Owen G. Morphology of physiologically identified bipolar cells in the retina of the tiger salamander, Ambystoma tigrinum. The Journal of Comparative Neurology. 1986;252:130–138. doi: 10.1002/cne.902520108. [DOI] [PubMed] [Google Scholar]
- Hare WA, Owen WG. Spatial organization of the bipolar cell’s receptive field in the retina of the tiger salamander. The Journal of Physiology. 1990;421:223–245. doi: 10.1113/jphysiol.1990.sp017942. [DOI] [PMC free article] [PubMed] [Google Scholar]
- Hare WA, Owen WG. Receptive field of the retinal bipolar cell: A pharmacological study in the tiger salamander. Journal of Neurophysiology. 1996;76:2005–2019. doi: 10.1152/jn.1996.76.3.2005. [DOI] [PubMed] [Google Scholar]
- Hirasawa H, Kaneko A. pH changes in the invaginating synaptic cleft mediate feedback from horizontal cells to cone photoreceptors by modulating Ca2+ channels. The Journal of General Physiology. 2003;122:657–671. doi: 10.1085/jgp.200308863. [DOI] [PMC free article] [PubMed] [Google Scholar]
- Kuffler SW. Discharge patterns and functional organization of mammalian retina. Journal of Neurophysiology. 1953;16:37–68. doi: 10.1152/jn.1953.16.1.37. [DOI] [PubMed] [Google Scholar]
- Miller RF. Cell communication mechanisms in the vertebrate retina. Investigative Ophthalmology & Visual Science. 2008;49:5184–5198. doi: 10.1167/iovs.08-2456. [DOI] [PubMed] [Google Scholar]
- Nelson R, Kolb H. ON and OFF pathways in the vertebrate retina and visual system. In: Chalupa LM, Werner JS, editors. The Visual Neurosciences. Vol. 1. Cambridge, MA: MIT Press; 2004. pp. 260–278. [Google Scholar]
- Packer S, Verweij J, Li P, Schnapf JL, Dacey DM. Blue-yellow opponency in primate S cone photoreceptors. The Journal of Neuroscience. 2010;30:568–572. doi: 10.1523/JNEUROSCI.4738-09.2010. [DOI] [PMC free article] [PubMed] [Google Scholar]
- Rieke F. Temporal contrast adaptation in salamander bipolar cells. The Journal of Neuroscience. 2001;21:9445–9454. doi: 10.1523/JNEUROSCI.21-23-09445.2001. [DOI] [PMC free article] [PubMed] [Google Scholar]
- Sterling P. How retinal circuits optimize the transfer of visual information. In: Chalupa LM, Werner JS, editors. The Visual Neurosciences. Vol. 1. Cambridge, MA: MIT Press; 2004. pp. 234–259. [Google Scholar]
- Thoreson WB, Miller RF. Removal of intracellular chloride suppresses transmitter release from photoreceptor terminals. The Journal of General Physiology. 1996;107:631–642. doi: 10.1085/jgp.107.5.631. [DOI] [PMC free article] [PubMed] [Google Scholar]
- Werblin FS, Dowling JE. Organization of the retina of the mudpuppy, Necturus maculosus. II. Intracellular recording. Journal of Neurophysiology. 1968;32:339–355. doi: 10.1152/jn.1969.32.3.339. [DOI] [PubMed] [Google Scholar]
- Witkovsky P, Stone S. Center-surround organization and its modification by gamma-aminobutyric acid and strontium. Experimental Biology. 1987;1:1–12. [PubMed] [Google Scholar]
- Wu SM. Synaptic organization of the vertebrate retina: General principles and species-specific variations. Investigative Ophthalmology & Visual Science. 2010;51:1264–1274. doi: 10.1167/iovs.09-4396. [DOI] [PMC free article] [PubMed] [Google Scholar]
- Wu SM, Gao F, Maple BR. Functional architecture of synapses in the inner retina: Segregation of visual signals by stratification of bipolar cell axon terminals. The Journal of Neuroscience. 2000;20:4462–4470. doi: 10.1523/JNEUROSCI.20-12-04462.2000. [DOI] [PMC free article] [PubMed] [Google Scholar]
- Wunk DF, Werblin FS. Synaptic inputs to ganglion cells in the tiger salamander retina. The Journal of General Physiology. 1979;73:265–286. doi: 10.1085/jgp.73.3.265. [DOI] [PMC free article] [PubMed] [Google Scholar]
- Zhang AJ, Wu SM. Receptive fields of retinal bipolar cells are mediated by heterogeneous synaptic activity. The Journal of Neuroscience. 2009;29:787–797. doi: 10.1523/JNEUROSCI.4984-08.2009. [DOI] [PMC free article] [PubMed] [Google Scholar]


