Abstract
In this report, we introduce a chip-capillary hybrid device to integrate capillary isoelectric focusing (CIEF) with parallel capillary sodium dodecyl sulfate – polyacrylamide gel electrophoresis (SDS-PAGE) or capillary gel electrophoresis (CGE) toward automating two-dimensional (2D) protein separations. The hybrid device consists of three chips that are butted together. The middle chip can be moved between two positions to re-route the fluidic paths, which enables the performance of CIEF and injection of proteins partially resolved by CIEF to CGE capillaries for parallel CGE separations in a continuous and automated fashion. Capillaries are attached to the other two chips to facilitate CIEF and CGE separations and to extend the effective lengths of CGE columns. Specifically, we illustrate the working principle of the hybrid device, develop protocols for producing and preparing the hybrid device, and demonstrate the feasibility of using this hybrid device for automated injection of CIEF-separated sample to parallel CGE for 2D protein separations. Potentials and problems associated with the hybrid device are also discussed.
INTRODUCTION
Two-dimensional gel electrophoresis is a powerful tool for resolving proteins and polypeptides in complex protein mixtures. The first 2D separations can be attributed to the work of Smithies and Paulik1 for combining paper and starch gel electrophoresis for serum protein separation. Subsequent development in electrophoretic technology, such as the use of polyacrylamide as a sieving matrix and the use of acrylamide polymers with various concentration gradients have been rapidly applied to 2D separations. In particular, the application of isoelectric focusing (IEF) techniques developed by O’Farrell2 to 2D separations has made it possible for the 1st-D separation to be based on the charge properties of proteins. The coupling of IEF with SDS-PAGE in the 2nd-D has resulted in a 2D electrophoresis (2DE) method that separates proteins according to two orthogonal parameters – isoelectric point and molecular weight.
In 2DE, the 1st-D separation is usually performed in a gel medium containing ampholytes or on a strip with immobilized ampholytes. After the 1st-D separation is complete, the IEF buffer is exchanged with SDS-PAGE buffer. The partially resolved proteins from the 1st-D are then transferred to a slab-gel for the 2nd-D separation. At the end of the 2nd-D separation, the separated proteins are stained and detected. This methodology has been applied to the analysis of various protein samples.3–5
Due to many manual steps involved in the separation process, automating conventional 2DE come is challenging. Recently, several research groups have attempted to couple IEF with SDS-PAGE on microchip devices.6–15 A poly(dimethylsiloxane) (PDMS) chip approach was developed for 2DE protein separations.11 Proteins were first separated by IEF on a reconfigurable single-channel PDMS chip. The chip was then dissembled, and the IEF channel with partially-resolved proteins was reassembled into another PDMS chip for SDS-PAGE. Automating these operations is difficult.
In a separate report, IEF and SDS-poly(ethylene oxide) (PEO) were integrated on a polycarbonate chip.14 In this chip, one horizontal channel was intersected by eight parallel channels. The IEF was performed in the horizontal channel, and SDS-PEO gel electrophoresis was performed in the parallel channels. Ideally, the SDS-PEO gel would be filled in the 2nd-D channels before IEF was performed. However, the device as designed had a major limitation in this regard. Because the 1st-D and the 2nd-D channels were directly connected, the SDS in the SDS-PEO gel in the 2nd-D channels would bleed into the 1st-D channel due to molecular diffusion and electric distortion at the channel intersections. The SDS in the 1st-D channel would bind to proteins (which would add negative charges on the proteins), and therefore ruin the IEF. To circumvent this problem, the authors14 filled the 2nd-D channels with a PEO gel containing no SDS. The SDS required for the 2nd-D separation was electrokinetically introduced to the gel after IEF was complete.
In another report, an “integrated” polymer chip was described for 2DE.16 IEF was performed using an immobilized pH gradient (IPG) strip. The IPG strip was then transferred to a parallel channel polymer chip for the 2nd-D separation. As can be seen, the 2D separations were not really integrated. Nevertheless, the authors made an excellent point in this report: “the most challenging task in the development of a miniaturized 2D electrophoresis system is the sample transfer from the first to the second dimensions.”
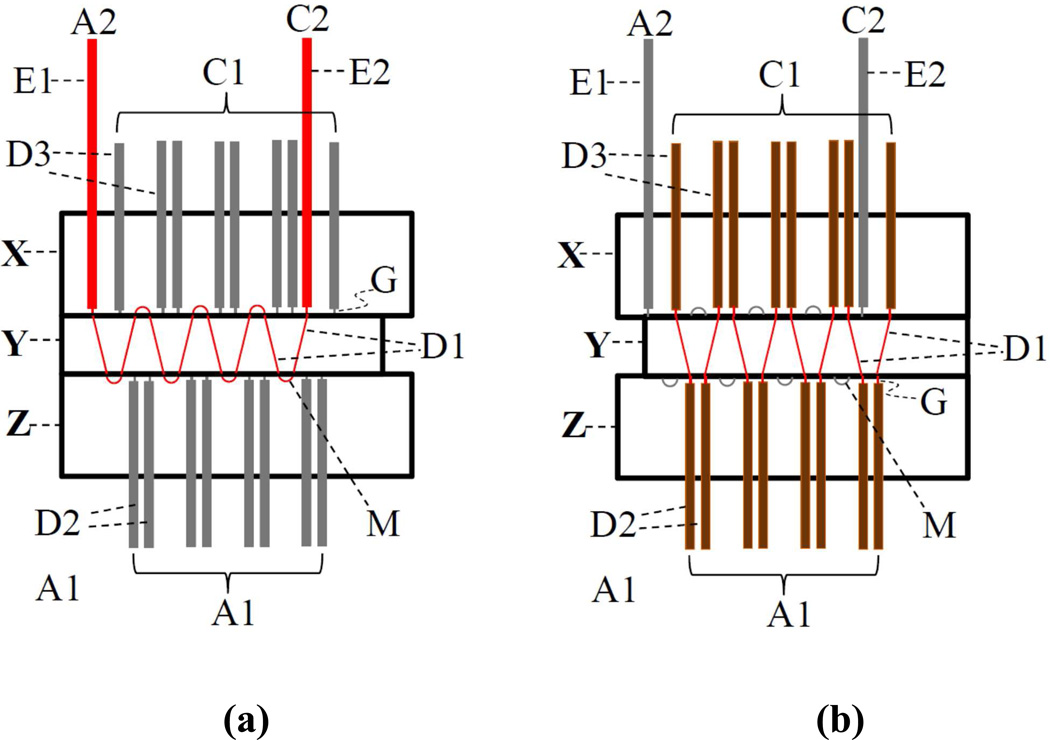
In this work, we develop a chip-capillary (microfabricated-channels and capillaries combined) hybrid device to transfer sample from capillary isoelectric focusing (CIEF, the first separation dimension) to parallel Capillary SDS-PAGE (CGE, the second separation dimensions). Fig. 1 presents a schematic diagram to illustrate the working principle of this approach. The hybrid device consists of three chips, X, Y and Z that are butted together. Normally, Chips X and Z are fixed, while Chip Y can be shifted back and forth between two positions as indicated in Fig. 1a and 1b. Referring to the thin (red) lines in Fig. 1a, capillaries E1 and E2 and channels D1 and M are joined together forming a single continuous channel (E1-D1-M-D1-M-D1⋯⋯M-D1-E2) from A2 to C2. CIEF is performed in this channel. After CIEF is complete, Chip Y is shifted to another position as shown in Fig. 1b, the continuous channel is segmented into many smaller channels (D1) that are inserted between capillaries D2 and D3. The CIEF separated bands in channels D1 are thus injected into parallel capillaries D2 for CGE separations. A1 and A2 are anode reservoirs, and C1 and C2 are cathode reservoirs to hold buffers and electrodes to facilitate the 2D separations. The free-ends of capillaries D2 and D3 can be bundled together to use common reservoirs A1 and C1. In this paper, we report the preparation of the hybrid device and demonstrate the feasibility of this device for automated transfer of the 1st-D separated sample to the 2nd-D, a critical step toward automating 2DE.
Figure 1. Working principle of hybrid device.
(a) hybrid device at the 1st-D separation position, and (b) hybrid device at the 2nd-D separation position.
Experimental
Reagents and Materials
Acrylamide, cross-linker (Bis, N,N'-Methylene Bisacrylamide), bi-functional reagent [(3-Methacryloxypropyl)-Trimethoxysilane], TEMED (N,N,N',N'-Tetramethylethylenediamine), APS (ammonium persulfate), and the broad molecular weight (MW) protein marker were obtained from Bio-Rad Laboratories (Hercules, CA). Individual proteins that include trypsinogen, β-Lactoglobulin, ovalbumin and bovine serum albumin (BSA) were purchased from Sigma (St. Louis, MO) and green fluorescent protein (GFP) was purchased from Clontech (Mountain View, CA). An IEF ampholyte solution (pH 3–10) was purchased from Bio-Rad (Hercules, CA). A fluorescent labeling dye, Chromeo™ P503, was purchased from Active Motif (Carlsbad, CA). A fifty-µm-thick polytetrafluoroethylene (PTFE) membrane was purchase from Goodfellow Cambridge Limited (Huntingdon, England), Teflon AF was obtained from DuPont (Wilmington, DE) and FluoroSyl FSM 660-1-52 was received as a sample form Cytonix, Corp. (Beltsville, MD). Microposit® S1818 photoresist and Microposit® MF-319 developer used for microfabrication were purchased from Shipley Company (Marlborough, Massachusetts). Fused silica capillaries were bought from Molex Inc. (Phoenix, AZ). All solutions were prepared with ultra-pure water purified by a NANO pure infinity ultrapure water system (Barnstead, Newton, WA).
Microchip Fabrication
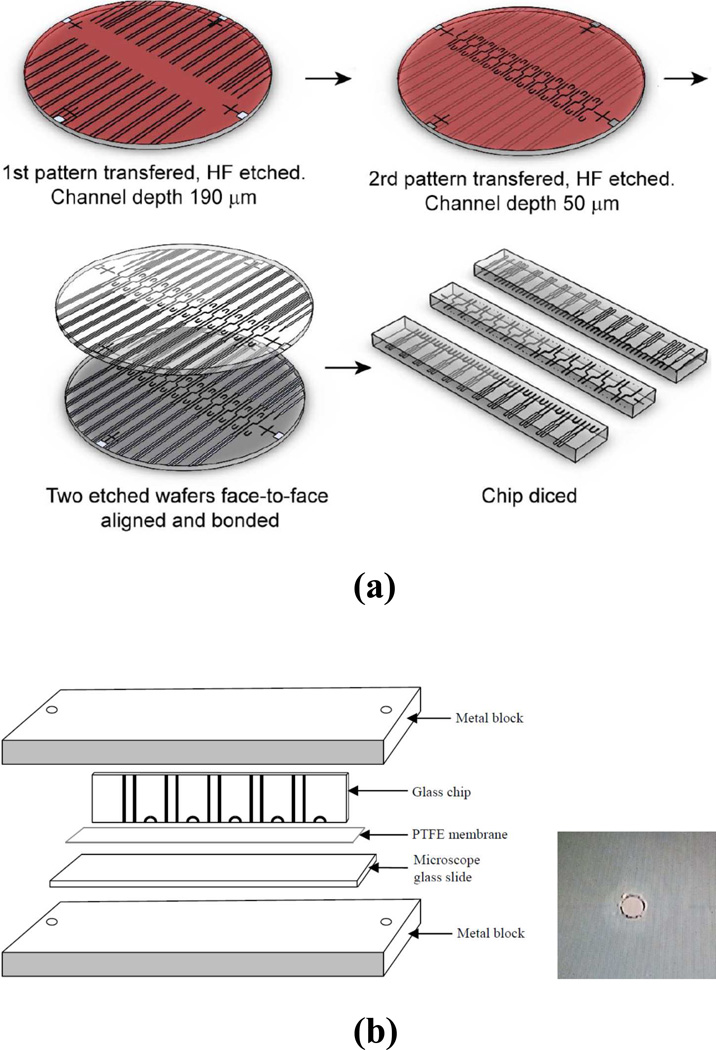
Standard photolithographic processes and two photomasks (with a pattern linewidth of 10 µm) were used to produce chips for the hybrid device. The first photomask was used to fabricate channels used to incorporate capillaries D2, D3, E1 and E2. The second photomask was used to make channels D1, M, and G (see Fig. 1). The diameter of these channels was ~100 µm, which matched the diameter of the parallel CGE capillaries D2. The exact lengths of these channels depended on where the chip was diced, but they were usually ~8 mm, ~2.5 mm, and ~1.5 mm for channels D1, M, and G, respectively. In the actual chip, there were 24 D1 channels (and 24 D2, 24 D3, 1 E1 and 1 E2 capillaries, accordingly). Fig. 2a presents the major steps of the fabrication. The channel arrangement shown on each wafer in this figure reflected the actual photomask patterns. On a 10-cm-diameter glass wafer, 190-µm-deep grooves were produced using the first photomask. Because HF etching was isotropic, the cross-section of resultant grooves had semi-circular profiles. The remaining Cr/Au film was used again as an etching mask for the 2nd pattern transfer (using the second photomask). A detailed illustration of the microfabrication process can be seen in Fig. S1. These channels had a depth of 50 µm. After the structured wafers were cleaned, two such wafers were face-to-face aligned and bonded. The bonded chip was then diced into Chips X, Y, and Z (as depicted in Fig. 1). Chips X and Z had a width of ~15 mm, while Chip Y had a width of ~8 mm. Chip Y was 3-mm shorter than that (~90 mm) of Chips X and Z after its left edge was lapped off.
Figure 2. Chip fabrication and preparation.
(a) major steps of chip fabrication, and (b) device for attaching PTFE membrane to chip surface (the inset shows an image of a channel opening after the PTFE membrane covering the opening was removed).
PTFE-Membrane Attachment
A 50-µm-thick PTFE membrane was attached to the interfacial surfaces between chips to prevent liquid leaking. Each interfacial surface was coated (via a spin-coating process) first with 15% Teflon AF, and then 10% Teflon AF and 20% FluoroSyl FSM 660-1-52, both in Perfluoro-compound FC-75. The PTFE membrane was subsequently attached to the surface by pressing the membrane against the surface via a clamp device (see Fig. 2b) and heating it at 300 °C for 20 min. The PTFE membrane covering the channel-openings was cut and removed using a 25G BD disposable needle. The inset of Fig. 2b exhibits an image of the opening after the PTFE membrane was removed.
Chip Holder
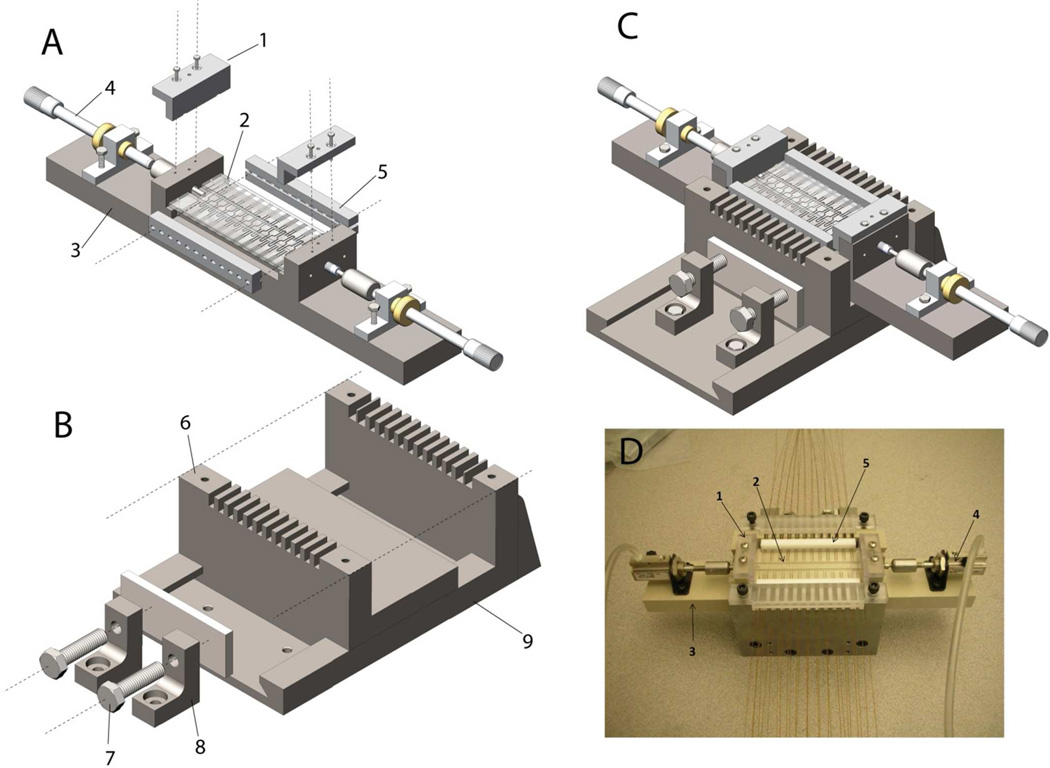
Fig. 3 presents the design of the chip holder used in this work. Referring to Fig. 3A, Chips X, Y and Z (Part #2) were tightly-fitted into the space in the middle of Part #3, and held down to the flat bottom surface of Part #3 by two L-shaped clamps (Part #1). Fig. 3B shows a vise in which Part #8 were bolted down on the base of Part #9, while Part #6 could slide along the rail on Part #9. This vise, in combination with Part #5 (one in the front and another in the back of the chips), was used to butt Chips X, Y and Z tightly to prevent solution leaking. Two micrometers (Part #4) were used to switch Chip Y between the 1st-D and 2nd-D separation positions. Fig. 3C presents the Chip Holder as all parts were assembled, and Fig. 3D shows a picture of the actual Chip Holder with all chips and capillaries.
Figure 3. Chip holder.
A – Chips X, Y and Z were held down to the flat bottom surface of Part #3, with Chips X and Z being secured at fixed horizontal positions; B – all components in A were housed by the vise so that a pressure could be applied to butt Chips X, Y and Z tightly; C – the assembly when components in A and B were held together (without capillaries); and D – an image of the actual assembly (with capillaries attached to Chips X and Z).
Capillary and Microchip-Channel Coating
All capillaries attached to Chips X and Z were coated with 4%T and 0.60%C (%T stands for acrylamide concentration and %C represents the Bis concentration relative to the acrylamide) polyacrylamide.17,18 Briefly, a capillary was first flushed with a 1.0 M NaOH solution for ~1 h to activate its surface, and then rinsed with water for 20 min and acetonitrile for 10 min. After being dried with helium, the activated surface was reacted with a 1.0% bi-functional reagent for ~1 h, rinsed with acetonitrile and dried with helium. The capillary was then flushed with a degassed solution containing 4%T and 0.6%C, 0.1% (v/v) TEMED, and 0.025% APS at ~0 °C for 4 min. The capillary was ready for being attached to a chip after the residual solution was rinsed out.
To coat channels D1 and M, two uncoated capillaries (E1 and E2) were inserted into their designated channels in Chip X and secured in position with adhesive. Then Chips X, Y and Z were assembled in the above chip holder and aligned in the 1st-D separation position as shown in Fig. 1a. DI water was pressurized into the continuous (1st-D) channel from both ends to ensure that no water leaked out. Then, the 1st-D channel and capillaries E1 and E2 were coated with 4%T and 0.6%C polyacrylamide, following the same procedure as described in the preceding paragraph. After the coated chip pieces were disassembled, coated capillaries D2 and D3 (for CGE separations) were inserted into the 380-µm-I.D. (inner diameter) channels in Chips X and Z and secured in position with adhesive. In this paper, the lengths and I.D. were 10 cm and 100 µm for capillaries E1 and E2, 15 cm and 180 µm for capillaries D3, and 55 cm and 100 µm for capillaries D2, respectively. About 25 cm from the free-end of each D2 capillary, ~5 mm of polyimide coating was removed using a razor blade for laser-induced fluorescence scanning detection. Chips X, Y and Z were reassembled (as shown in Fig. 3D) protein separations. Channels G (~1.5 mm in length) were not coated.
Protein Labeling with Chromeo P503 Dye
Proteins were labeled with a fluorescent dye (Chromeo P503) following the published protocols19–22 with minor modifications. Briefly, 20 µl of protein stock solution at 5 mg/ml in 0.2% Tween 80 was mixed with 1 µl of 0.1 M borax solution and equilibrated on an ice bath. Then, 0.5 µl of Chrome P503 at a concentration of 1 µg/µl in anhydrous dimethylformamide (DMF) was added to the protein solution and mixed by vertex. The reaction was allowed to proceed inside the ice bath for one hour and stopped by adding 5 µl of 0.3 M acetic acid solution into the reaction solution. The labeled proteins were stored at 4 °C in a refrigerator for future use.
Laser-Induced Fluorescence Scanner
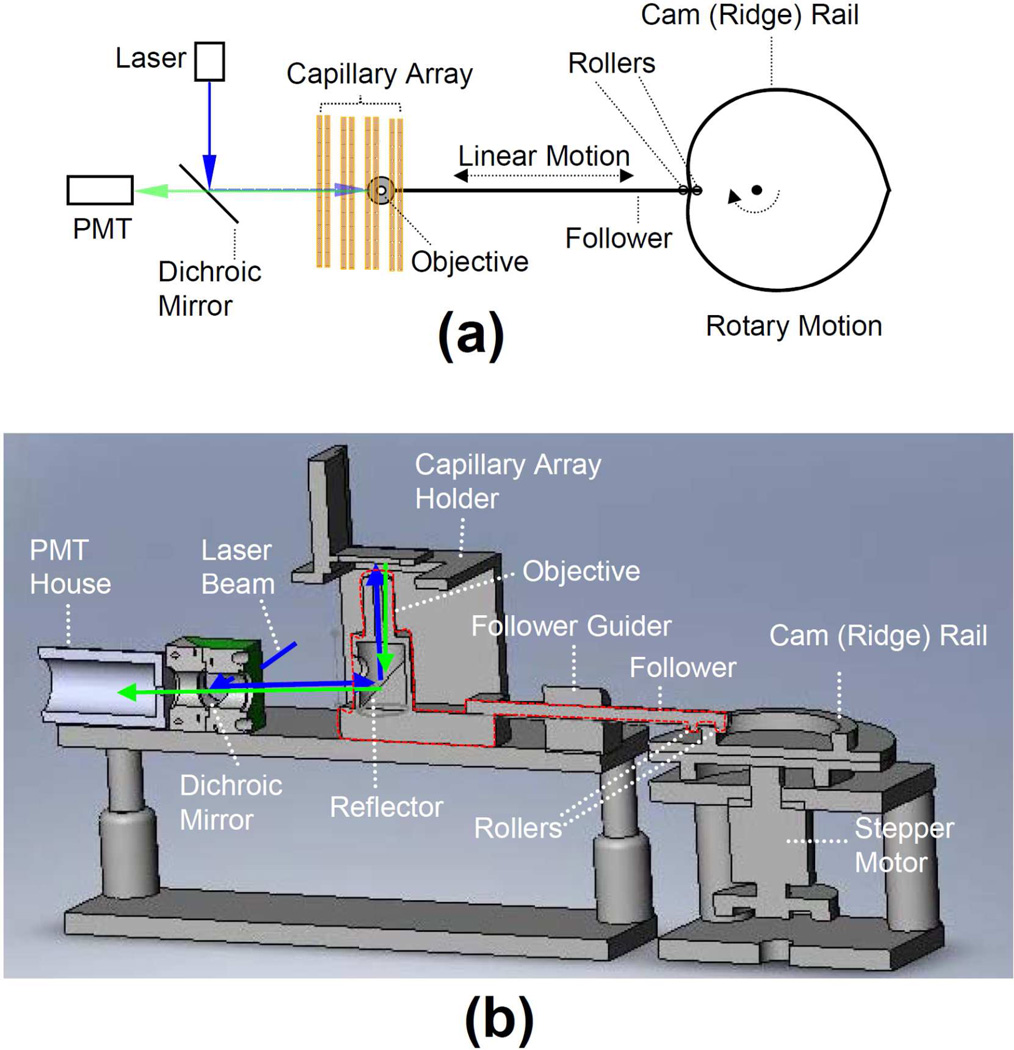
Fig. 4a presents a schematic diagram of the scanner (a top-view), and Fig. 4b presents a cross-section front-view of the scanner. The follower was held in position via a flower-guider. The objective and the reflector as an entity was placed on a linear translation stage and attached to one end of the follower. Two rollers (bearings) were affixed to the other end of the follower, and the cam rail or ridge was sandwiched by the two rollers. The 488-nm laser beam from the back of the scanner was reflected first by the dichroic mirror and then by the reflector to the objective which focused the beam onto the capillaries (not shown) on the capillary holder. As the cam (driven by the stepper motor) rotated, the objective and the reflector moved linearly scanning across the capillaries, and fluorescence from the capillaries was collected by the objective and directed by the reflector through the dichroic mirror to the photomultiplier tube (PMT) (not shown) in the PMT house. Software for stepper motor control, signal pattern recognition, data processing and time sequencing was develop in-house using National Instrument LabVIEW®. The speed of the stepper motor was set at 3 revolutions per second (3 Hz). A National Instrument PCI 5105 data acquisition card was used for data acquisition.
Figure 4. Schematic diagrams depicting the LIF scanner configuration.
The components inside the red-line circled region were moved linearly.
One-Dimension Separation on Hybrid Device
To run CIEF, Chip Y was moved to the 1st-D separation position (see Fig. 1a), a 5 µg/mL GFP solution containing 0.45% ampholyte and 0.2% Tween 80 was aspirated into into the 1st-D under vacuum. With 20 mM NaOH as anolyte and 10 mM H3PO4 as catholyte, CIEF was carried out by applying 6 kV across the channel. [Caution must be taken when high voltages are used. It can be hazardous to people and to electronics of the instrument.] To run parallel CGE, Chips Y was aligned at the 2nd-D separation position, and replaceable matrix matrix18,23 (6% polyacrylamide with 0.018% Bis) in 0.5% SDS and 150 mM tricine-tris buffer (pH 6.65) was pressurized into the 2nd-D capillaries at ~100 psi. A running buffer (150 mM tricine-tris buffer in 0.5% SDS aqueous solution, pH 6.75) was used for both cathode and anode ends of the capillaries. Chip Y was then switched to the 1st-D position, and replaceable matrix and SDS in the 1st-D channel were washed out. After a protein solution containing β-Lactoglobulin, Trypsinogen, Ovalbumin, and BSA was aspirated into the 1st-D channel, Chip Y was switched to the 2nd-D separation position, and the parallel 2nd-D separations were executed by applying 10 kV across the capillaries.
Two-Dimension Separation on Hybrid Device
To perform 2DE separation, Chips X, Y and Z were first aligned at the 2nd-D separation position (see Fig. 1b) where channels D1 were aligned with capillaries D2 and D3. Replaceable CGE matrix was pressurized into these capillaries using a pressure chamber. Chip Y was then switched to the 1st-D separation position (see Fig. 1a) in which channels D1 and capillaries E1 and E2 were connected together into a continuous channel. After the gel and SDS in this channel was washed out, a protein-ampholyte mixture (0.45% ampholyte, 0.5% tween 80 and 2~10 µg/mL proteins) was aspirated into this channel under vacuum. CIEF was carried out by applying 6 kV across the CIEF channel for ~60 min. After CIEF was complete, Chip Y was switched to the 2nd-D separation position for parallel CGE. CGE was carried out by applying 10 kV across the CGE capillaries. These separations were complete in ~30 min. The separated proteins were monitored by the laser-induced fluorescence scanner.
Results and discussion
Design Consideration of Hybrid Device
Capillaries E1 and E2 were used to facilitate CIEF on the hybrid device. Since the CIEF-focused proteins in these capillaries were not analyzed by CGE, their volumes should be as small as possible. In this experiment, these capillaries had a uniform length of 10 cm and diameter of 100 µm. Further shortening these capillaries made it problematic connecting them to anolyte and cathode reservoirs properly. Narrower capillaries could also reduce their bore volumes, but this would increase the portion of the total voltage distributed on them (leading to longer focusing times). The samples in channels M were also lost (not analyzed by CGE), so their volumes should be minimized. In this proof-of-concept demonstration work, however, this parameter was not optimized. The diameter of channels D1, M, and G should match the diameter of capillaries D2 to minimize the dead-volumes for parallel CGE. The dimensions of capillaries D3 were not critical, because they employed primarily to facilitate the application of an electric field to channels D1 and capillaries D2 for CGE. In this experiment, these capillaries were short (15 cm) and wide (180 µm) to reduce the portion of total voltage dropped on them. The length of channels G should be short because they were not coated and would contribute to resolution reduction. The accuracy of chip dicing was a main factor that limited how short channels G could be.
Prevention of Solution Leaking
Solution leaking at the chip interfaces was one of the major concerns of this project. To address this concern, we tried (1) lapping the interfacial surfaces and (2) coating these surfaces with Teflon AF, following a published procedure.24 No satisfactory results were obtained. Recognizing that the Teflon AF coating was too thin to be sufficiently deformable to seal the interfacial gaps, we developed an effective means by attaching a 50-µm-thick PTFE membrane to the interfacial surfaces to solve this problem. Because PTFE membranes do not adhere to a glass surface easily, a clamp device (see Fig. 3a) was employed. All pieces were held together using two bolts and nuts (finger-tightened). Final thickness of the attached membrane was ~30 µm, because the pressure and heat thinned the membrane.
Channel Alignment
Another concern was whether channels in Chips X, Y and Z could be aligned properly, which turned out to be less problematic than we had anticipated. Because these chips were produced from one mother-chip (see Fig. 2), they had the same thickness. When these chips were pressed down onto a flat surface (see Figure 3A), channels were aligned well in the vertical direction. Aligning chips in the horizontal orientation was also achieved using the chip holder. Because the right and left edges of Chips X, Y and Z were created by two parallel cuts, when the right edges were pushed against a flat surface, channels D1, D2 and D3 should be aligned well. The left edge of Chip Y was lapped by 3 mm (the distance from Chip Y at the 1st-D separation position to the chip at the 2nd-D separation position) on a PM5 Auto Precision Lapping and Polishing Machine (Logitech Ltd., Glasgow, Scotland). When the left edges of Chips X, Y and Z were pushed against a flat surface, channels D1 and M were aligned properly. The chip holder was designed to perform these alignments. Fig. S2 presents images of the hybrid device when channels D1 were aligned with channels M, and capillaries D2 and D3. The alignment errors were estimated to be ~10 µm using a Nikon Eclipse 50i Microscope.
Before running separations on the hybrid device, we still needed to examine whether Chips X, Y and Z were properly sealed and aligned. We set the device at the 1st-D separation position (see Fig. 1a) and pressurized DI water through the 1st-D channel to check if water leaked out. We also set the device at the 2nd-D separation position (see Fig. 1b) and pressurized DI water through all capillaries to check if water leaked out. If water leaked, Chips X, Y and Z were further tightened by pressing Part #6 via two screws (Part #7) in Fig. 3B so that the flexible PTFE membrane could be adequately deformed until the leaking stopped. Caution must be taken not too press the chips too tight because Chip Y needs to slide back and forth between Chips X and Z.
Ampholyte-SDS precipitation
When CIEF and CGE were initially combined, we encountered a problem – precipitates formed when ampholyte was mixed with SDS. Precipitation also occurred when CHAPS was mixed with SDS. The precipitates interfered with the CGE separations seriously. To alleviate this problem, we took two approaches: (a) we reduced ampholyte concentration from 1.8% to 0.45% and changed the pH of the CGE matrix from 7.6 to 6.7, and (b) we replaced 4% CHAPS (a zwitterionic surfactant) with 0.2% Tween 80 (a nonionic surfactant) in the CIEF sample. After these changes, proteins could be separated smoothly without precipitation, although some peak broadening was observed.
Separations on Hybrid Device
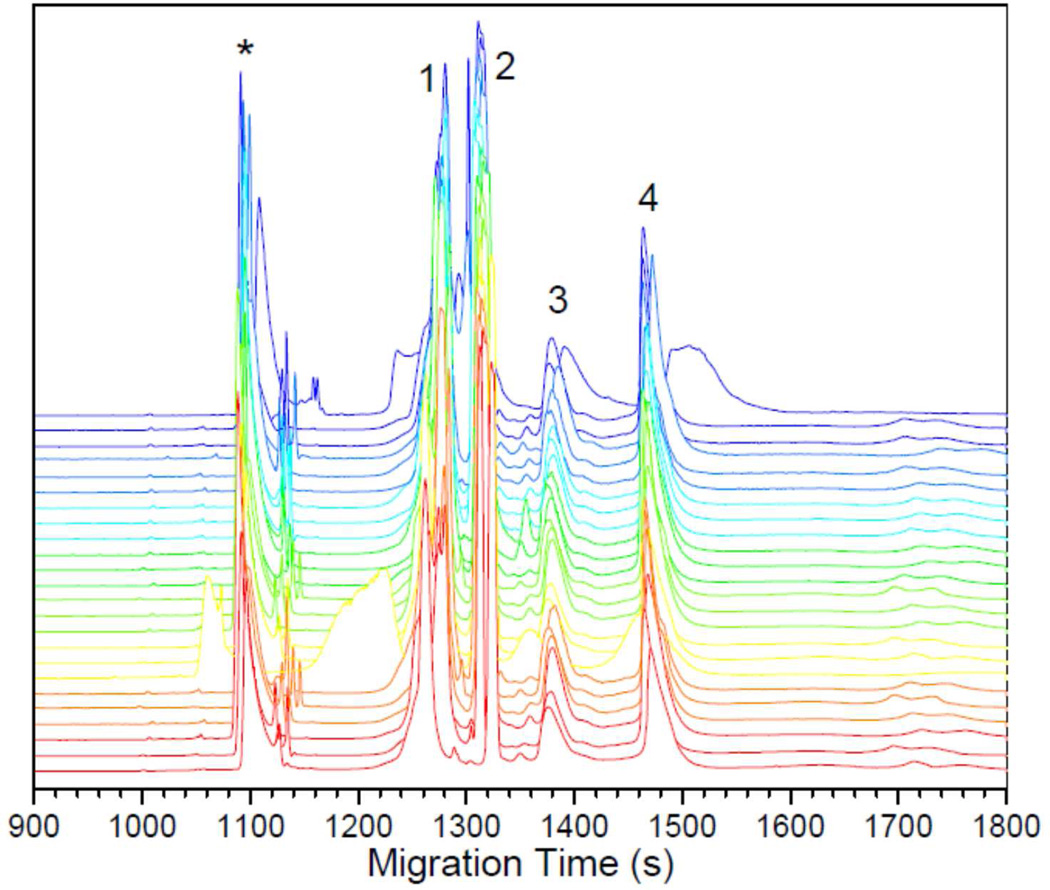
To evaluate the performance of the hybrid device, we first ran the 1st-D and then the 2nd-D separations, separately. When the 1st-D was performed, we used a fluorescence microscope to monitor the separated GFP. We saw clearly that GFP was focused inside channel segment 14 with some in channel segment 15 (data not shown). Fig. 5 presents the separation results for the 2nd-D separations. The four proteins were nicely resolved, and their migration times were similar in all capillaries. Because the separation conditions were identical and the same sample was injected, we expected all traces to be very similar. Occasionally, we did see that proteins in one or two capillaries migrated at slower paces, presumably due to the presence of particles or formation of bubbles in these capillaries.
Figure 5. Parallel CGE separation results.
Electrophoregrams from 24 CGE capillaries were stacked sequentially, with the bottom electropherogram from capillary #1 and the top electropherogram from capillary #24. The protein sample contained: 1 – 50 µg/mL β-lactoglobulin (MW 18kD), 2 – 50 µg/mL trypsinogen (MW 24kD), 3 – 100 µg/mL ovalbumin (MW 45kD), and 4 – 50 µg/ml BSA (MW 66kD). All proteins were labeled with Chromeo P503. The separations were carried out using 50-cm-long (40-cm effective) and 100-µm-i.d. capillaries filled with 6% acrylamide and 0.018% Bis replaceable gel in 0.5% SDS and 150 mM tricine-tris buffer (pH 6.65). The separation field strength was 200V/cm. Laser-induced confocal fluorescence scanner was used as the detector. The first (asteroid-indicated) peak in each trace came from impurities in the sample.
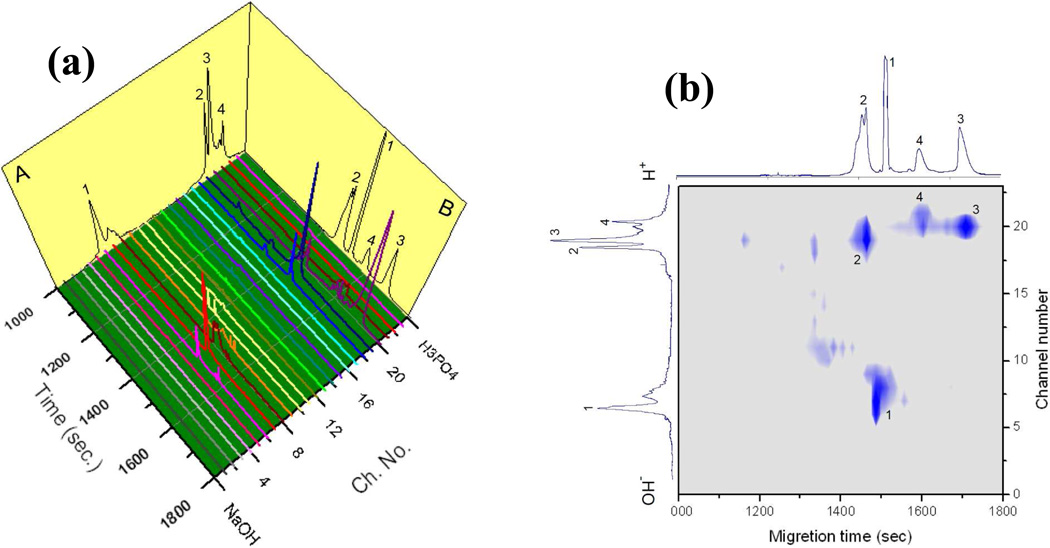
Using the same experimental conditions for the 1st-D and the 2nd-D, a 2DE separation was performed. The results are exhibited in Fig. 6a (Panel A shows a CIEF separation trace, and Panel B presents a CGE separation trace from two capillary-based separations). From these results, we see that Trypsinogen (pI=9.3) was focused in channel segments 7 to 9, β-Lactoglobulin (pI=5.2) in segments 18 to 20, BSA (pI=4.9) in segment 20, and Ovalbumin (pI=4.3) in segments 20 and 21. In the 2nd-D separations, β-Lactoglobulin (MW=18kD) migrated out first, followed by Trypsinogen (MW=24kD), Ovalbumin (MW=45kD), and BSA (MW=66kD). Fig. 6b presents the separation results in a 2DE format, in which the 2D separations can be more conveniently viewed.
Figure 6. 2DE separation on hybrid device.
(a) 24 CGE traces were arranged sequentially to show a 2D protein separation. Channel segment #1 was connected to E2 which was connected to a catholyte reservoir (C2), while channel segment #24 was connected to E1 which was connected to an anolyte reservoir (A1). The CIEF trace on Panel A and the CGE trace on Panel B were obtained from two capillary-based separations. (b) The identical data of (a) was displayed in a 2D slab-gel format. Peak identification: 1 – Trypsinogen (pI 9.3, and MW 24kD), 2 – β-Lactoglobulin (pI 5.2, and MW 18kD), 3 – BSA (pI 4.9, and MW 66kD), and 4 – Ovalbumin (pI 4.3, and MW 45kD). All these proteins are labeled with Chromeo P503. For CEIF separation, the sample contained 5 µg/mL β-lactoglobulin, 5 µg/mL trypsinogen, 10 µg/mL ovalbumin, and 5 µg/ml BSA in 0.2% Tween 80 and 0.45% ampholyte. CIEF was carried out by applying 6 kV for 1 hour. For CGE separation, the conditions were the same as in Fig. 5.
The resolutions had been improved compared to previously published results on direct CIEF and CGE coupling,6,11,14 because we had increased the effective separation distances in both separation dimensions. However, these resolutions were not high compared to capillary-based isoelectric focusing17 and capillary-based SDS-PAGE.23 Two problems have to be overcome before the benefits of the hybrid device can be capitalized. One was our inability to apply a very high voltage for CIEF, because these high voltages caused unstable currents (presumably current leaking at chip interfaces) and current breakdowns. In this work, only 6 kV (~150 V/cm) was utilized. When CIEF was carried out at this voltage, long focusing times were required (often longer than one hour), which reduced sample throughputs. Performing CIEF at such low field strength also resulted in reduced resolutions. Another problem was the long sample plugs for the 2nd-D separations. For convenient and reliable switching of the hybrid device and consideration of the mechanical strength of Chip Y, the width of Chip Y could not be too narrow. In this work, it was set to be ~8 mm, i.e., the sample plugs were ~8 mm long. With these long sample plugs for CGE, resolutions were sacrificed. These problems are being attacked in authors’ lab, and the results will be published elsewhere.
Conclusions
We have described an innovative chip-capillary hybrid device to transfer sample from CIEF to parallel CGE. We have developed a fabrication process to produce the hybrid device. Producing round channels in chips and attaching capillaries to chips via these round channels can be an effective means for communications between macro-world sample/reagents and microchip channels. The hybrid-device approach can be utilized for many other forms of 2D separations such as MEKC and CGE, CZE and MEKC, etc.
Although 2DE separations were not fully automated in this work, all operations are automateable. For example, the replaceable gel can be loaded using a pressure chamber as we reported previously,25 Chip Y can be switched using a pneumatic device, and samples can be introduced using an auto-sampler. Automation of 2DE will be implemented after the separation problems are solved. In our lab, we have redesigned the chip and chip-holder, and we will use the modified hybrid device to mitigate the problems and use the device to separate proteins in real-world samples.
Supplementary Material
ACKNOWLEDGMENT
This work was supported by the National Institute of Health under Grant RO1 GM078592.
REFERENCES
- 1.Smithies O, Paulik MD. Nature. 1956;177:1033. doi: 10.1038/1771033a0. [DOI] [PubMed] [Google Scholar]
- 2.O’Farrell PH. J. Biol. Chem. 1975;250:4007–4021. [PMC free article] [PubMed] [Google Scholar]
- 3.Iborra F, Buhler JM. Anal. Biochem. 1976;74:503–511. doi: 10.1016/0003-2697(76)90232-3. [DOI] [PubMed] [Google Scholar]
- 4.Klose J. Humanangenetik. 1975;26:231–243. [Google Scholar]
- 5.Scheele GA. J. Biol. Chem. 1975;250:5375–5385. [PubMed] [Google Scholar]
- 6.Das C, Zhang J, Denslow ND, Fan ZH. Lab on a Chip. 2007;7:1806–1812. doi: 10.1039/b712794d. [DOI] [PubMed] [Google Scholar]
- 7.Shadpour H, Soper SA. Anal. Chem. 2006;78:3519–3527. doi: 10.1021/ac0600398. [DOI] [PubMed] [Google Scholar]
- 8.Wang YC, Choi MH, Han J. Anal. Chem. 2004;76:4426–4431. doi: 10.1021/ac0497499. [DOI] [PubMed] [Google Scholar]
- 9.Sluszny C, Yeung ES. Anal. Chem. 2004;76:1359–1365. doi: 10.1021/ac035336g. [DOI] [PubMed] [Google Scholar]
- 10.Yang C, Liu H, Yang Q, Zhang L, Zhang W, Zhang Y. Anal. Chem. 2003;75:215–218. doi: 10.1021/ac026187p. [DOI] [PubMed] [Google Scholar]
- 11.Chen X, Wu H, Mao C, Whitesides GM. Anal. Chem. 2002;74:1772–1778. doi: 10.1021/ac0109422. [DOI] [PubMed] [Google Scholar]
- 12.Liu J, Yang S, Lee CS, DeVoe DL. Electrophoresis. 2008;29:2241–2250. doi: 10.1002/elps.200700608. [DOI] [PubMed] [Google Scholar]
- 13.Rocklin RD, Ramsey RS, Ramsey JM. Anal. Chem. 2000;72:5244–5249. doi: 10.1021/ac000578r. [DOI] [PubMed] [Google Scholar]
- 14.Li Y, Buch JS, Rosenberger F, DeVoe DL, Lee CS. Anal Chem, Anal. Chem. 2004;76:742–748. doi: 10.1021/ac034765b. [DOI] [PubMed] [Google Scholar]
- 15.Chen H, Fan ZH. Electrophoresis. 2009;30:758–765. doi: 10.1002/elps.200800566. [DOI] [PubMed] [Google Scholar]
- 16.Griebel A, Rund S, Schonfeld F, Dorner W, Konrad R, Hardt S. Lab Chip. 2004;4:18–23. doi: 10.1039/b311032j. [DOI] [PubMed] [Google Scholar]
- 17.Gao L, Liu S. Anal. Chem. 2004;76:7179–7186. doi: 10.1021/ac049353x. [DOI] [PubMed] [Google Scholar]
- 18.Lu J, Zhu Z, Wang W, Liu S. Anal. Chem. 2011;83:1784–1790. doi: 10.1021/ac103148k. [DOI] [PMC free article] [PubMed] [Google Scholar]
- 19.Wetzl BK, Yarmoluk SM, Craig DB, Wolfbeis OS. Angew. Chem. Int. Ed. 2004;43:5400–5402. doi: 10.1002/anie.200460508. [DOI] [PubMed] [Google Scholar]
- 20.Craig DB, Wetzl BK, Duerkop A, Wolfbeis OS. Electrophoresis. 2005;26:2208–2213. doi: 10.1002/elps.200410332. [DOI] [PubMed] [Google Scholar]
- 21.Ramsay LM, Dickerson JA, Dovichi NJ. Electrophoresis. 2009;30:297–302. doi: 10.1002/elps.200800498. [DOI] [PubMed] [Google Scholar]
- 22.Wojcik R, Swearingen KE, Dickerson JA, Turner EH, Ramsay LM, Dovichi NJ. J. Chromatogr. A. 2008;1194:243–248. doi: 10.1016/j.chroma.2008.04.042. [DOI] [PMC free article] [PubMed] [Google Scholar]
- 23.Lu J, Liu S, Pu Q. J. Proteome Res. 2005;4:1012–1016. doi: 10.1021/pr0500206. [DOI] [PubMed] [Google Scholar]
- 24.Kuwata M, Kawakami T, Morishima K, Murakami Y, Sudo H, Yoshida Y, Kitamori T. Proceedings of Micro Total Analysis System. Vol. 2. Dordrecht: Kluwer Academic Publishers; 2004. pp. 342–344. [Google Scholar]
- 25.Liu S, Elkin C, Kapur H. Electrophoresis. 2003;24:3762–3768. doi: 10.1002/elps.200305616. [DOI] [PubMed] [Google Scholar]
Associated Data
This section collects any data citations, data availability statements, or supplementary materials included in this article.


