Abstract
This paper describes the first analytical method for the determination of four flavonoids (sutherlandins A–D) and four cycloartanol glycosides (sutherlandiosides A–D) from the aerial parts of Sutherlandia frutescens (L.) R. Br. A separation by HPLC was achieved by using a reversed phase (RP-18) column, PDA with ELS detection, and a water/acetonitrile gradient as the mobile phase. The wavelength used for quantification of four flavonoids with the diode array detector was 260 nm. Owing to their low UV absorption, the cycloartanol glycosides were detected by evaporative light scattering. The method was validated for linearity, repeatability, limits of detection (LOD) and limits of quantification (LOQ). The limits of detection and limits of quantification of eight compounds were found to be in the range from 0.1 to 7.5 µg/mL and 0.5 to 25 µg/mL, respectively. The analysis of products showed considerable variation of 1.099–5.224 mg/average weight for the major compound, sutherlandioside B. The eight compounds in plant sample and products of S. frutescens were further confirmed by LC–ESI-TOF. This method involved the use of the [M+H]+ and [M+Na]+ ions in the positive ion mode with extractive ion monitoring (EIM).
Keywords: Sutherlandia frutescens (L.) R. Br., LC-UV–ELSD, LC–MS, Dietary supplements
1. Introduction
Sutherlandia frutescens (L.) R. BR., Family Fabaceae, is a well-known and widely used medicinal plant from the Western Cape, South Africa [1,2]. Traditionally it has been used as a remedy for stomach problems, internal cancers, diabetes and various inflammatory conditions, and recently, widely used by individuals with HIV/AIDS [1,3]. Extracts have been shown to have analgesic, anti-inflammatory, hypoglycemic and anticonvulsant activity [4,5] and to alter antiretroviral metabolism through effects on cytochrome P450 and P-glycoprotein [6,7].
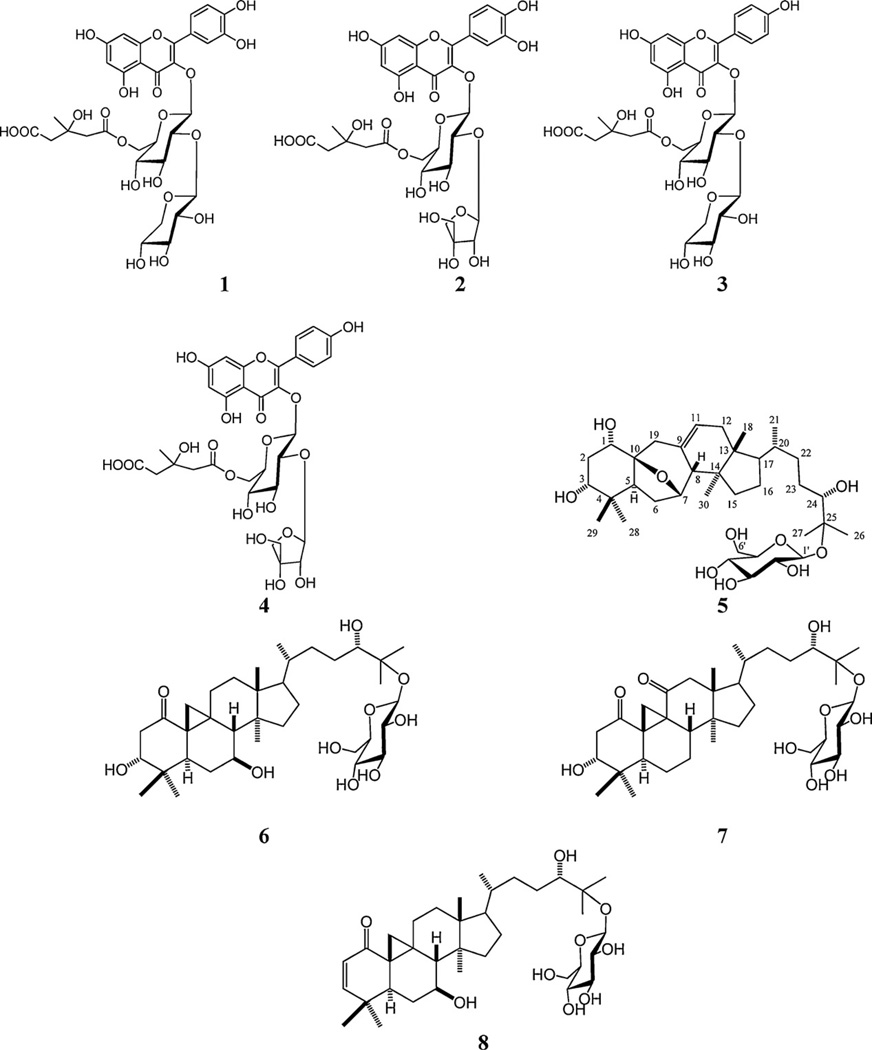
In an attempt to provide chemical markers for this herbal medicine a phytochemical investigation of this plant was studied, leading to the identification of four flavonoids, sutherlandins A–D (1–4), and four cycloartanol glycosides, sutherlandiosides A–D (5–8). However, no method has been developed for the analysis of flavonoids and cycloartanol glycosides in aerial parts of S. frutescens (L.) R. BR. A simple, precise LC-UV/ELSD analytical method was developed for the simultaneous detection and quantification of sutherlandin A (1), sutherlandin B (2), sutherlandin C (3), sutherlandin D (4), sutherlandioside B (5), sutherlandioside C (6), sutherlandioside A (7) and sutherlandioside D (8) (Fig. 1) in the leaves and stems of S. frutescens. The four flavonoids (1–4) were analyzed by LC-UV method at 260 nm and four cycloartanol glycosides (triterpenenoids) (5–8) by LC–ELSD method. Owing to their low UV absorption, the cycloartanol glycosides were detected by evaporative light scattering. The compounds were numbered by the order of elution.
Fig. 1.
Structure of chemical constituents from leaves and stems of Sutherlandia frutescens.
The analytical method was applied to commercial products claiming to contain S. frutescens. The LC–ESI-TOF analysis was performed for the confirmation of eight compounds in plant sample and products that claim to contain S. frutescens.
2. Materials and methods
2.1. Instrumentation and chromatographic conditions
2.1.1. LC-UV analysis
The HPLC system consisted of Waters Alliance 2695 HPLC system, equipped with a 996 photodiode array detector (Waters Corp., Milford, MA, USA). A computerized data station equipped with Waters Empower 2 software. A Discovery C18 column (150 mm × 4.6 mm; 5 µm particle size) from Supelco (Bellefonte, PA, USA) was used as the stationary phase and temperature maintained at 40 °C. The column was equipped with a 2 cm LC-18 guard column (Phenomenex, Torrance, CA, USA). The mobile phase consisted of water (0.1% acetic acid) (A), and acetonitrile (0.1% acetic acid) (B) at a flow rate of 1.0 mL/min. Analysis was performed using the following gradient elution: 85% A/15% B to 35% A/65% B over 35 min using a slightly concave gradient profile (Waters curve type 7). Each run was followed by a 5 min wash with 100% B and an equilibration period of 15 min. The ELS detector was set up to a probe temperature of 43 °C, at gain 10.0 and the nebulizer gas (Nitrogen) adjusted to 4.1 bar. The detection wavelength was 260 nm for flavonoids. Ten microliters of sample was injected and peaks were assigned by spiking the samples with standard compounds and comparison of the UV spectra with those of standards.
2.1.2. Liquid chromatography/mass spectrometry (LC–ESI-TOF)
The liquid chromatograph used was an Agilent Series 1100 comprised of the following modular components: quaternary pump, a vacuum solvent microdegasser and an autosampler with 100-well tray. The mass spectrometric analysis was performed by using the LC–ESI-TOF (Model #G1969A, Agilent Technologies, Palo Alto, CA, USA) equipped with an ESI source. All acquisitions were performed under positive ionization mode with a capillary voltage of 3000 V. Nitrogen was used as the nebulizer gas (35 psig) as well as the drying gas at 13 L/min at a temperature of 350 °C. The voltage of PMT, fragmentor and skimmer was set at 850, 100 and 60 V, respectively. Full scan mass spectra were acquired from m/z 100 to 1300. Data acquisition and processing was done using the Analyst™ QS software (Agilent Technologies, Palo Alto, CA, USA).
Separation was achieved on a discovery C18 column; 150 mm × 4.6 mm I.D.; 5 µm particle size (Phenomenex, Torrance, CA, USA). The column was equipped with a guard column (Supelco, Bellefonte, PA, USA). The mobile phase consisted of water with 0.1% formic acid (A), and acetonitrile with 0.1% formic acid (B) at a flow rate of 0.5 mL/min, with the following gradient elution: 0 min, 80% A/20% B to 60% A/40% B over 20 min. Each run was followed by a 5 min wash with 100% B and an equilibration period of 11 min with 80% A/20% B. The total run time for analysis was 20 min. Ten microliters of the sample was injected and peaks were assigned with respect to the mass of the compounds and comparison of the retention times.
2.2. Chemicals
The standard compounds (1–8) were isolated at NCNPR, the identity and purity were confirmed by chromatographic (TLC and HPLC) methods, by the analysis of the spectroscopic data (IR, 1D- and 2D-NMR and HR-ESI-MS) and comparison with published spectroscopic data [8,9]. The % purity of these compounds was calculated (93.33%, 94.81%, 96.65%, 93.46%, 98.73%, 99.10%, 98.34% and 98.53% for compounds 1–8, respectively)
Acetonitrile and formic acid were of HPLC grade, purchased from Fisher Scientific (Fair Lawn, NJ, USA). Water for the HPLC mobile phase was purified using a Milli-Q system (Millipore).
Leaves–stems of S. frutescens (L.) R. Br. were collected from Riversdale, South Africa in November 2006. The plants were identified by Kersten Paulse, a consulting botanist for Afriplex. A voucher specimen (voucher # PSM 602) is deposited in Parceval Laboratories, Paarl, South Africa.
2.3. Standard solutions
Individual stock solutions of standard compounds were prepared at a concentration of 1.0 mg/mL in methanol. The calibration curves were prepared at five different concentration levels. The range of the calibration curves was 25–250 µg/mL for sutherlandiosides A, C and D and 10–100 µg/mL for sutherlandioside B by LC–ELSD method, 0.5–60 µg/mL for sutherlandins A and B and 1.0–60.0 ug/mL for sutherlandins C and D by LC-UV method at 260 nm. Table 1, shows the LC-UV calibration data and the calculated limits of detection for each method.
Table 1.
Regression equation, correlation coefficient (r2), limits of detection (LOD) and limits of quantitation (LOQ) for flavonoids and cycloartanol glycosides from S. frutescens L. by LC-UV/ELSD method.
| Analyte | Regression equation | r2 | LOD (µg/mL) | LOQ (µg/mL) |
|---|---|---|---|---|
| 1 | Y = 7.75e+003x−1.02e+004 | 0.9996 | 0.35 | 1.0 |
| 2 | Y = 7.35e+003x−5.48e+003 | 0.9998 | 0.35 | 1.0 |
| 3 | Y = 9.87e+003x−3.10e+003 | 0.9997 | 0.1 | 0.5 |
| 4 | Y = 9.68e+003x + 1.56e+002 | 0.9997 | 0.1 | 0.5 |
| 5 | Y = 1.78e+000x + 7.41e−001 | 0.9996 | 5 | 10 |
| 6 | Y = 1.71e+000x + 5.60e−001 | 0.9998 | 7.5 | 25 |
| 7 | Y = 1.62e+000x + 1.05e+000 | 0.9986 | 5 | 15 |
| 8 | Y = 1.67e+000x + 9.01e−001 | 0.9990 | 7.5 | 25 |
2.4. Sample preparation
Dry plant sample (300 mg) and dietary supplements (equivalent of 0.3–0.5 g capsule content or tablet weight) were sonicated in 2.5 mL of methanol for 30 min followed by centrifugation for 15 min at 3500 rpm. The supernatant was transferred to a 10 mL volumetric flask. The procedure was repeated thrice and respective supernatants combined. The final volume was adjusted to 10.0 mL with methanol and mixed thoroughly. Prior to injection, an adequate volume (ca. 2 mL) was passed through a 0.45 µm nylon membrane filter. The first 1.0 mL was discarded and the remaining volume was collected in an LC sample vial. Each sample solution was injected in triplicate.
3. Results and discussion
3.1. Chromatographic conditions
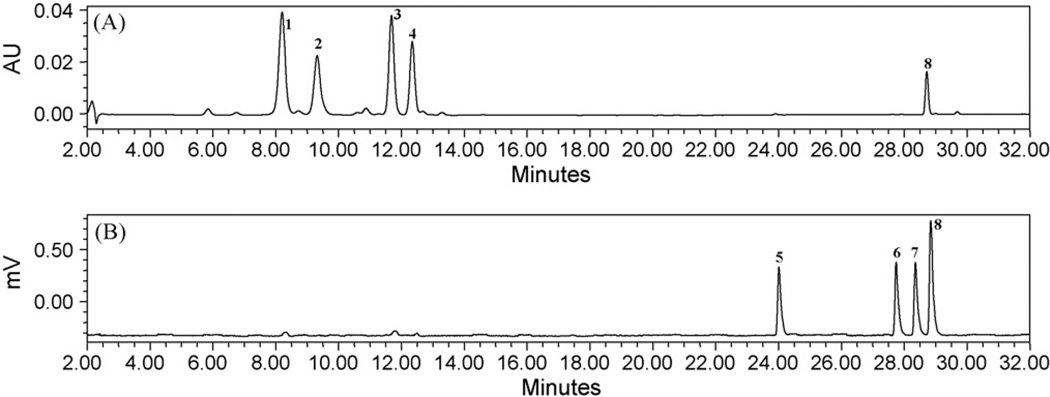
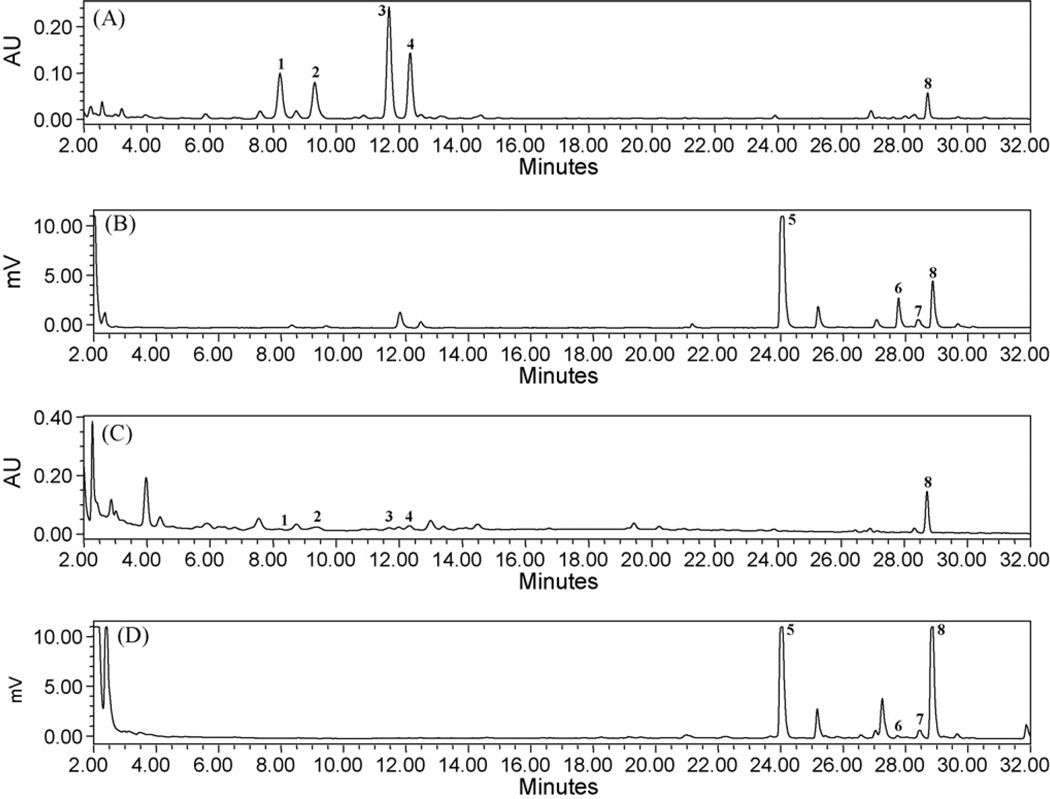
Stationary phases of different columns have been assessed Luna 5µ C18(2), Luna 5µ C8(2), Synergi 4µ Max-RP 80 A, Lichrospher 5 RP18, Discovery C18 and Gemini 5µ C18 and the best results were obtained with a Discovery C18 stationary phase from Supelco. However, most of the column materials (Luna 5µ C18(2), Luna 5µ C8(2), Synergi 4µ Max-RP 80 A, Lichrospher 5 RP18, and Gemini 5µ C18) tested could not resolve the compounds 7 and 8, and the compounds were merging with each other. A higher degree of separation temperature of 43 °C in ELSD detector and use of discovery C18 column resulted in a well separation of compounds and reduced the separation time. Composition of the mobile phase contained an acidic system to improve the peak symmetry of all compounds. Optimal chromatographic conditions were obtained after running different mobile phases with a reversed phase C18 column; an acidic system improved the sensitivity and protons enhancement. The column was used at 40 °C at a flow rate of 1.0 mL/min and an injection volume of 10 µL. A chromatogram of the flavonoids and cycloartanol glycosides by LC-UV–ELSD methods of S. frutescens is shown in Figs. 2 and 3.
Fig. 2.
HPLC chromatograms of standard mix (A and B) at 260 nm by LC-UV and ELSD method. (1) Sutherlandin A, (2) sutherlandin B, (3) sutherlandin C, (4) sutherlandin D, (5) sutherlandioside B, (6) sutherlandioside C, (7) sutherlandioside A and (8) sutherlandioside D.
Fig. 3.
HPLC chromatograms of plant sample (A and B) and dietary supplement (C and D) by LC-UV at 260 nm and ELSD method. (1) Sutherlandin A, (2) sutherlandin B, (3) sutherlandin C, (4) sutherlandin D, (5) sutherlandioside B, (6) sutherlandioside C, (7) sutherlandioside A and (8) sutherlandioside D.
3.2. Accuracy, precision and linearity
The five point calibration curves for eight compounds showed a linear correlation between concentration and peak area. Calibration data (Table 1) indicated the linearity (r2 > 0.999) of the detector response for all standard compounds. The limits of detection and limits of quantification for flavonoids and cycloartanol glycosides (1–8) were found to be in the range from 0.1 to 7.5 µg/mL and 0.5 to 25 µg/mL, respectively. The limits of detection (LOD) and limits of quantification (LOQ) were defined, respectively, as signal-to-noise ratio equal to 2 or 3 and 10. All standards and samples were injected in triplicate. Multiple injections showed that the results are highly reproducible and showed low standard error. Accuracy of the method was confirmed by performing a recovery experiment. Intra- and inter-day variation of the assay was determined and showed to be lower than 3.0%, with a maximum RSD of 2.29%. It was performed three times on three different days and each concentration point was injected in triplicate.
The intra- and inter-day precision and accuracy values were determined by analyzing samples spiked with standard compounds 1–8 at two different concentrations 5 and 10 µg/mL for flavonoids (1–4) and 25 and 50 µg/mL for cycloartanol glycosides (5–8) (Table 2). Plant sample after exhaustive extraction of four times and drying was spiked with known amounts of the standard compounds at two different concentrations for flavonoids and cycloartanol glycosides, extracted and analyzed under optimized conditions.
Table 2.
Intra- and Inter-day accuracy for flavonoids and cycloartanol glycosides for S. frutescens.
| Analyte | Concentration (µg/mL) | Intra-day (n = 3) | Inter-day (n = 9) | ||||
|---|---|---|---|---|---|---|---|
| Found (µg/mL) | RSD (%) | Accuracya (%) | Found (µg/mL) | RSD (%) | Accuracy (%) | ||
| 1 | 5.0 | 5.12 | 0.42 | 102.4 | 5.11 | 0.28 | 102.2 |
| 10.0 | 10.23 | 0.28 | 102.3 | 10.15 | 0.63 | 101.5 | |
| 2 | 5.0 | 5.09 | 0.14 | 101.8 | 5.03 | 0.56 | 100.6 |
| 10.0 | 10.29 | 0.82 | 102.9 | 10.05 | 0.70 | 100.5 | |
| 3 | 5.0 | 5.19 | 0.55 | 103.8 | 5.10 | 0.83 | 102.0 |
| 10.0 | 10.31 | 0.21 | 103.1 | 10.25 | 0.69 | 102.5 | |
| 4 | 5.0 | 4.89 | 1.16 | 97.8 | 4.95 | 2.29 | 99.0 |
| 10.0 | 10.11 | 0.49 | 101.1 | 10.19 | 0.56 | 101.9 | |
| 5 | 25.0 | 25.35 | 0.11 | 101.4 | 24.76 | 0.19 | 99.04 |
| 50.0 | 50.05 | 0.11 | 100.1 | 49.95 | 0.23 | 99.90 | |
| 6 | 25.0 | 24.27 | 0.17 | 97.08 | 25.11 | 0.23 | 100.44 |
| 50.0 | 50.15 | 0.11 | 100.3 | 49.89 | 0.28 | 99.7 | |
| 7 | 25.0 | 25.13 | 0.34 | 100.52 | 25.21 | 0.34 | 100.84 |
| 50.0 | 50.23 | 0.06 | 100.46 | 50.11 | 0.11 | 100.22 | |
| 8 | 25.0 | 24.77 | 0.17 | 99.08 | 24.43 | 0.17 | 97.72 |
| 50.0 | 49.64 | 0.09 | 99.28 | 50.13 | 0.16 | 100.26 | |
Accuracy (%) = 100% × mean of measured concentration/nominal concentration.
The within day CVs for the replicates at two different concentrations for flavonoids and cycloartanol glycosides (n = 5) were between 0.97 and 2.77% for 1–8 compounds, respectively. The CVs for the day to day replicates (n = 3) at different concentrations were between 1.49% and 3.41% for 1–8 compounds, respectively. The accuracy of the HPLC method was found to be >97% at all the concentration levels for all analytes (Table 2).
3.3. Analysis of plant samples
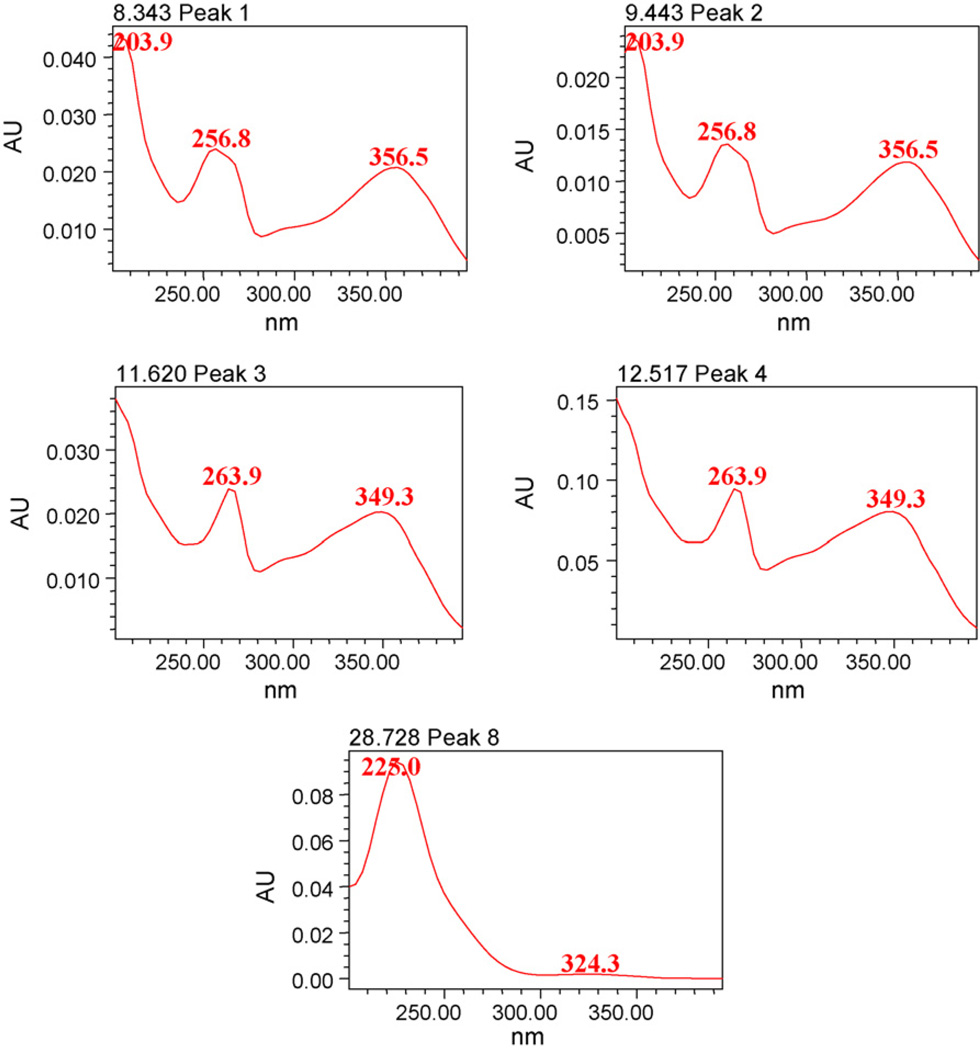
Utilizing the PDA makes it possible to obtain the UV spectra (Fig. 4). One plant sample and six products (SF-1 to SF-6) were analyzed for the determination of flavonoids and cycloartanol glycosides. The identification of these compounds in S. frutescens sample was based on the retention times and the comparison of UV spectra with those of authentic standards. Spiking sample with reference compounds performed a further confirmation assay. The developed method was used for analysis of eight compounds in leaves of S. frutescens and commercial samples of S. frutescens. Table 3 shows the variations in concentrations of flavonoids and cycloartanol glycosides in one plant sample of S. frutescens, and commercial products. The content (w/w) of compounds 1–8 in plant sample were 0.53%, 0.49%, 0.94%, 0.54%, 2.75%, 0.22%, 0.61% and 0.64%, respectively. Sutherlandioside B, a major cycloartanol glycoside was present in the range from 5.224 to 1.099 mg/average weight of capsule content or tablet. The amounts of other cycloartanol glycosides (sutherlandiosides A, C and D) were in the range from 0.064 to 1.149, 0.083 to 0.568, 0.079 to 3.894 mg/average weight of capsule content or tablet. The contents of 1–4 were present in the levels from 0.041 to 0.498, 0.023 to 1.128, 0.021 to 1.537 and 0.115 to 0.645 mg/average weight of capsule content or tablet, respectively, in six dietary supplements claiming to contain S. frutescens.
Fig. 4.
UV spectra of four flavonoids and sutherlandioside D.
Table 3.
Content (%, w/w) of flavonoids and cycloartanol glycosides for S. frutescens and dietary supplement [mg/average weight of sample (mg)] by LC-UV/ELSD method.
| Compound # | Plant sample (%, w/w) | mg/average weight of sample | |||||
|---|---|---|---|---|---|---|---|
| SF-1 | SF-2 | SF-3 | SF-4 | SF-5 | SF-6 | ||
| 1 | 0.531 ± 0.821 | 0.498 ± 0.419 | 0.209 ± 0.213 | 0.049 ± 0.128 | 0.041 ± 0.125 | 0.176 ± 0.288 | 0.054 ± 0.225 |
| 2 | 0.485 ± 0.047 | 0.437 ± 0.440 | 0.398 ± 0.400 | 0.111 ± 0.119 | 0.023 ± 0.204 | 0.057 ± 0.218 | 1.128 ± 0.273 |
| 3 | 0.943 ± 1.544 | 0.063 ± 0.238 | 1.537 ± 0.384 | 0.021 ± 0.205 | 0.0517 ± 0.202 | 0.243 ± 0.219 | 0.558 ± 0.549 |
| 4 | 0.542 ± 0.524 | 0.148 ± 0.281 | 0.645 ± 0.216 | 0.124 ± 0.249 | 0.162 ± 0.545 | 0.115 ± 0.449 | 0.312 ± 0.457 |
| 5 | 2.75 ± 0.234 | 5.224 ± 0.132 | 4.619 ± 0.144 | 1.561 ± 0.187 | 1.099 ± 0.321 | 1.179 ± 0.313 | 2.713 ± 0.275 |
| 6 | 0.221 ± 0.312 | 0.568 ± 0.426 | 0.099 ± 0.174 | 0.083 ± 0.227 | 0.109 ± 0.075 | 0.116 ± 0.342 | 0.146 ± 0.302 |
| 7 | 0.606 ± 1.267 | 0.473 ± 0.367 | 1.149 ± 0.149 | 0.064 ± 0.344 | 0.178 ± 0.001 | 0.287 ± 0.261 | 0.760 ± 0.813 |
| 8 | 0.644 ± 0.524 | 3.894 ± 1.191 | 0.488 ± 0.356 | 0.691 ± 0.288 | 0.306 ± 0.384 | 0.458 ± 0.423 | 0.079 ± 0.361 |
| Weight (mg) | 302.4 | 384.2 | 331.2 | 237.2 | 515.6 | 504.9 | 394.6 |
Mean values (n = 3) ± standard deviations.
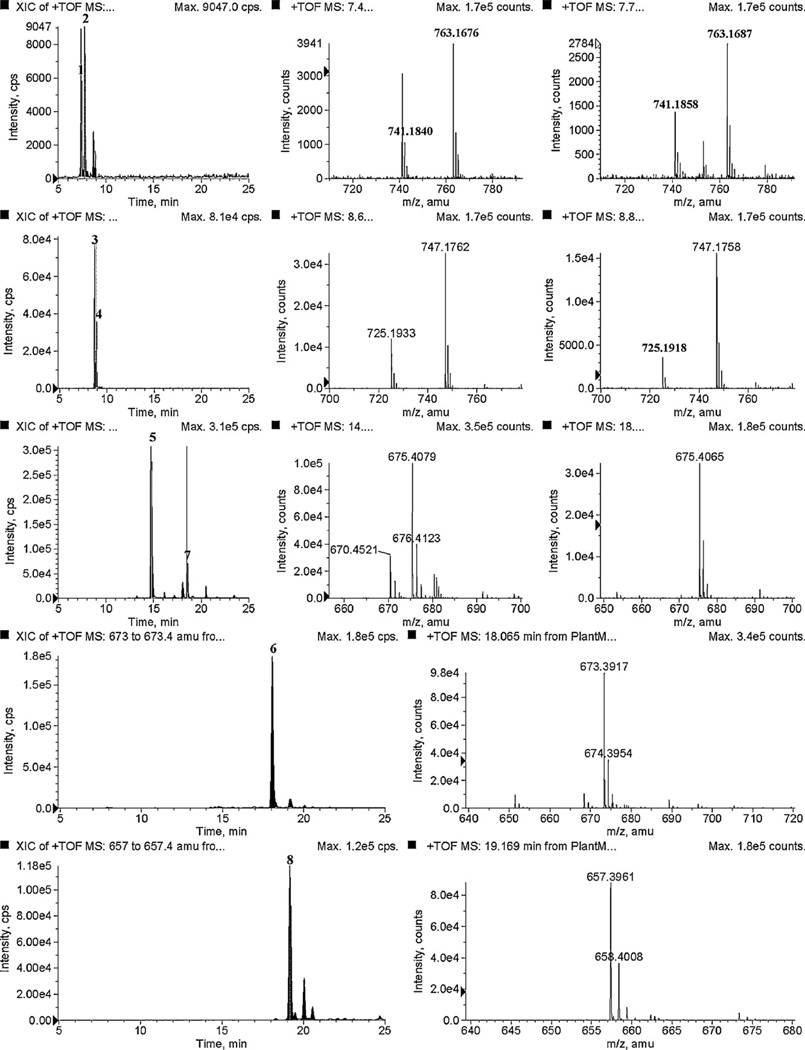
This method involved the use of the [M+H]+ and [M+Na]+ ions in the positive ion mode with extractive ion monitoring (EIM). In the positive ion mode, the protonated species [M+H]+ atm/z 741.1887, 741.1941, 725.1918, 725.1961, 653.4257, 651.4134, 653.4267 and 635.4189 and sodiated species [M+Na]+ atm/z 763.1739, 763.1749, 747.1773, 747.1791, 675.4117, 673.3968, 675.4112 and 657.3998 for compounds 1–8 were observed (Table 4). In the negative ion mode, the deprotonated species [M-H]+ atm/z 739.1705, 739.1725, 723.1745, 723.1784, 651.4108, 649.3952, 651.4108 and 633.4003 for compounds 1–8 were observed (Table 4).
Table 4.
Mass spectra of compounds (1–8) identified using LC–ESI-MS with positive and negative scan mode.
| Analyte | Mass spectra negative ion (m/z) |
Mass spectra positive ion (m/z) |
|---|---|---|
| 1 | 739.1705 [M−H]− | 741.1887 [M+H]+, 763.1739 [M+Na]+ |
| 2 | 739.1725 [M−H]− | 741.1941 [M+H]+, 763.1749 [M+Na]+ |
| 3 | 723.1745 [M−H]− | 725.1918 [M+H]+, 747.1773 [M+Na]+ |
| 4 | 723.1784 [M−H]− | 725.1961 [M+H]+, 747.1791 [M+Na]+ |
| 5 | 651.4108 [M−H]− | 653.4257 [M+H]+, 675.4117 [M+Na]+ |
| 6 | 649.3952 [M−H]− | 651.4134 [M+H]+, 673.3968 [M+Na]+ |
| 7 | 651.4108 [M−H]− | 653.4267 [M+H]+, 675.4112 [M+Na]+ |
| 8 | 633.4003 [M−H]− | 635.4189 [M+H]+, 657.3998 [M+Na]+ |
Further, the fragmentation patterns observed in the mass spectrum were useful in characterization of the compounds. Compounds 1 and 2 showed characteristic fragments at m/z 609.1426, and 303.0508 [quercetin], compounds 3 and 4 showed characteristic fragments at m/z 593.1484 and 287.0545 [kaempferol], compounds 5 and 7 showed characteristic fragments at m/z 491.3718 [aglycone+H]+, 473.3671 [aglycone+H−H2O]+, 455.3541 [aglycone+H−2H2O]+, 437.3397 [aglycone+H−3H2O]+, 419.3287 [aglycone+H−4H2O]+, compound 6 showed characteristic fragments at m/z 489.4118 [aglycone+H]+ and 471.3456 [aglycone+H−H2O]+ while compound 8 showed fragment ions at m/z 473.3613 [aglycone+H]+, 455.3537 [aglycone+H−H2O]+, 437.3479 [aglycone+H−2H2O]+ and 419.3295 [aglycone+H−3H2O]+. These ions were ascribed to the loss of sugar and water from the cycloartanol skeleton (Table 5).
Table 5.
Key fragment analysis of pure standard compounds by LC–ESI-TOF method.
| (A) | |||||
|---|---|---|---|---|---|
| # | Exact mass | [M+Na]+ | [M+H]+ | [M+H−sugar]+ | Base peak |
| 1 | 740.1800 | 763.1748 | 741.1928 | 609.1467 [M+H−132]+ | 303.0508 (quercetin) |
| 2 | 740.1800 | 763.1748 | 741.1928 | 609.1447 [M+H−132]+ | 303.0495 (quercetin) |
| 3 | 724.1851 | 747.1817 | 725.1986 | 593.1484 [M+H−132]+ | 287.0545 (kaempferol) |
| 4 | 724.1851 | 747.1817 | 725.1986 | 593.1480 [M+H−132]+ | 287.0547 (kaempferol) |
| (B) | |||||||||||
|---|---|---|---|---|---|---|---|---|---|---|---|
| # | Exact mass | [M+H]+ | [M+H−glu]+ | [M+H−H2O]+ | [M+H−H2O−glu]+ | [M+H−2H2O]+ | [M+H−2H2O−glu]+ | [M+H−3H2O]+ | [M+H−3H2O−glu]+ | [M+H−4H2O−glu]+ | |
| 5 | 652.4186 | 653.4265 | 491.3718 | 635.4118 | 473.3631 | 617.4018 | 455.3541 | 599.3913 | 437.3397 | 419.3287 | |
| 6 | 650.4030 | 651.4143 | 489.3592 | 633.3996 | 471.3511 | ||||||
| 7 | 652.4186 | 653.4265 | 491.3696 | 635.4094 | 473.3582 | 617.3987 | 455.3477 | 599.3881 | 437.3368 | 419.3264 | |
| 8 | 634.4081 | 635.4194 | 473.3647 | 617.4078 | 455.3544 | 599.3977 | 437.3437 | 581.3703 | 419.3333 | ||
Fig. 5 shows extracted ion chromatograms (XIC) in positive ion mode for plant sample. The retention times and mass spectra of plant sample and products exactly matched with the corresponding standard compounds.
Fig. 5.
Extracted ion chromatograms and mass spectra of flavonoids and cycloartanol glycosides from leaves and stems of S. frutescens (L.).
4. Conclusion
The newly developed HPLC-UV–ELSD method was found to be capable for chemical analysis of eight compounds in S. frutescens and commercial products. The developed method was validated for the determination of four flavonoids and four cycloartanol glycosides and successfully applied to the dietary supplements claiming to contain S. frutescens. Sutherlandioside B (compound 5), was found to be the major terpenoid compound. The eight compounds were further confirmed by LC–ESI-TOF in plant sample and products.
Acknowledgements
This research is funded in part by “Science Based Authentication of Dietary Supplements” funded by the Food and Drug Administration grant number 2U01 FD 002071-08 and “The International Center for Indigenous Phytotherapy Studies” funded by NCCAM, grant number 5U19 AT 003264. The authors would like to thank Dr. William Folk, University of Missouri-Columbia, Columbia, for providing the commercial products of Sutherlandia frutescens (SF-1 to SF-6).
Contributor Information
Bharathi Avula, Email: bavula@olemiss.edu.
Ikhlas A. Khan, Email: ikhan@olemiss.edu.
References
- 1.Stander BA, Marais S, et al. Influence of Sutherlandia frutescens extracts on cell numbers, morphology and gene expression in MCF-7 cells. J. Ethnopharmacol. 2007;112:312–318. doi: 10.1016/j.jep.2007.03.013. [DOI] [PubMed] [Google Scholar]
- 2.Van Wyk BE, Van Oudtshoorn B, Gericke N. Medicinal Plants of South Africa. Pretoria: Briza Publications; 1997. [Google Scholar]
- 3.Mills E, et al. African herbal medicines in the treatment of HIV: Hypoxis and Sutherlandia. An overview of evidence and pharmacology. Nutr. J. 2005;4:19. doi: 10.1186/1475-2891-4-19. [DOI] [PMC free article] [PubMed] [Google Scholar]
- 4.Ojewole JAO. Anticonvulsant property of Sutherlandia frutescens R. BR. (variety Incana E. MEY.) [Fabaceae] shoot aqueous extract. Brain Res. Bull. 2008;75:126–132. doi: 10.1016/j.brainresbull.2007.08.002. [DOI] [PubMed] [Google Scholar]
- 5.Ojewole JAO. Analgesic, antiinflammatory and hypoglycemic effects of Sutherlandia frutescens R. BR. (variety Incana E. MEY.) [Fabaceae] shoot aqueous extract. Methods Find Exp. Clin. Pharmacol. 2004;26:409–416. [PubMed] [Google Scholar]
- 6.Mills EC, et al. Impact of African herbal medicines on antiretroviral metabolism. AIDS. 2005;19:95–97. doi: 10.1097/00002030-200501030-00013. [DOI] [PubMed] [Google Scholar]
- 7.Brown L, Heyneke O, Brown D, van Wyk JPH, Hamman JH. Impact of traditional medicinal plant extracts on antiretroviral drug absorption. J. Ethnopharmacol. 2008;119:588–592. doi: 10.1016/j.jep.2008.06.028. [DOI] [PubMed] [Google Scholar]
- 8.Xiang F, Xing-Cong L, Smillie TJ, Carvalho P, Mabusela W, Syce J, Johnson Q, Folk W, Avery MA, Khan IA. Cycloartane glycosides from Sutherlandia frutescens. J. Nat. Prod. 2008;71:1749–1753. doi: 10.1021/np800328r. [DOI] [PMC free article] [PubMed] [Google Scholar]
- 9.Xiang F, Xing-Cong L, Wang Y-H, Avula B, Smillie TJ, Mabusela W, Syce J, Johnson Q, Folk W, Khan IA. Flavonol glycosides from the South African medicinal plant Sutherlandia frutescens. Planta Med. 2010;76:178–181. doi: 10.1055/s-0029-1186030. [DOI] [PubMed] [Google Scholar]


