Abstract
Objective
Our objective was to analyze 3-dimensional (3D) blood flow patterns within the total cavopulmonary connection (TCPC) using in vivo phase contrast magnetic resonance imaging (PC MRI).
Methods
Sixteen single-ventricle patients were prospectively recruited at 2 leading pediatric institutions for PC MRI evaluation of their Fontan pathway. Patients were divided into 2 groups. Group 1 comprised 8 patients with an extracardiac (EC) TCPC, and group 2 comprised 8 patients with a lateral tunnel (LT) TCPC. A coronal stack of 5 to 10 contiguous PC MRI slices with 3D velocity encoding (5–9 ms resolution) was acquired and a volumetric flow field was reconstructed.
Results
Analysis revealed large vortices in LT TCPCs and helical flow structures in EC TCPCs. On average, there was no difference between LT and EC TCPCs in the proportion of inferior vena cava flow going to the left pulmonary artery (43% ± 7% vs 46% ± 5%; P = .34). However, for EC TCPCs, the presence of a caval offset was a primary determinant of inferior vena caval flow distribution to the pulmonary arteries with a significant bias to the offset side.
Conclusions
3D flow structures within LT and EC TCPCs were reconstructed and analyzed for the first time using PC MRI. TCPC flow patterns were shown to be different, not only on the basis of LT or EC considerations, but with significant influence from the superior vena cava connection as well. This work adds to the ongoing body of research demonstrating the impact of TCPC geometry on the overall hemodynamic profile.
The total cavopulmonary connection (TCPC) is the primary surgical procedure of choice for children born with complex single-ventricle congenital heart defects. At present, there are 2 primary templates of TCPC implementation: the lateral tunnel (LT)1 and the extracardiac (EC) connection.2 Owing to the nature of their geometric configurations, LT and EC TCPCs tend to induce markedly different hemodynamic flow patterns.3,4
Prior hemodynamic studies, using bothcomputational fluid dynamics4–8 and experimental techniques, such as particle image velocimetry or streakline flow visualization,9,10 have been performed to provide either a detailed analysis of a single Fontan type or a direct comparison of both EC and LT templates. Although some studies have shown EC TCPCs to be energetically favorable in comparison with LT TCPC,3 others have shown the beneficial effects of large inferior vena cava (IVC) vessel sizes of LT TCPCs in reducing power losses.4 Computational and experimental methods for reconstructing 3-dimensional (3D) flows have provided a wealth of information to improve understanding of TCPC hemodynamics but are based on simplifying assumptions (steady flow, rigid vessel boundaries) that limit their ability to truly reproduce in vivo hemodynamics. Such dependence on simplifying assumptions may be contributing to the contrasting perceptions of the hemodynamic benefits of one TCPC template over the other. On the other hand, direct in vivo evaluation of flow patterns using, for example, phase-contrast magnetic resonance imaging (PC MRI) may yield higher fidelity results.
The inherent complexity of TCPC anatomy and flow necessitates the use of 3D techniques for its hemodynamic evaluation. Further more, a volumetric evaluation of flow patterns has the potential to explain and/or identify some of the mechanisms of Fontan failure (such as development of pulmonary arteriovenous malformations, as presented by Sundareswaran and associates,11 or thrombus formation in the TCPC). To date, very few PC MRI studies have analyzed Fontan flow in 3D. Those that have included only single-plane 2D analyses (even if multiple, independent planes were acquired) or were limited by small sample sizes.12–15 In a true 3D flow study by Markl and colleagues,13 flow as a function of the cardiac cycle was reconstructed in 4 patients with a TCPC. They demonstrated that direct 4D visualization of hemodynamic patterns within the TCPC is possible with newer MRI sequences. However, such sequences are still in the developmental stage and are not widely available for routine clinical use in a pediatric setting.
Alternatively, sequences for acquiring single-plane PC MRI with 3 components of velocity are available in most MRI scanners but require postprocessing steps to reconstruct the full flow volume. In this article, we present the results of a novel interpolation scheme used to reconstruct the full 3D velocity field within the TCPC using multiple single-plane PC MRI slices. The technique was applied to 16 patients having the Fontan procedure, and differences between LT and EC TCPCs are elucidated.
METHODS
Patient Population
Sixteen patients with single-ventricle disease were prospectively recruited at 2 leading pediatric institutions for hemodynamic MRI evaluation of the Fontan pathway. The study was approved by the institutional review boards of both institutions. The patient cohort was divided into 2 groups on the basis of the type of Fontan surgical connection. Group 1 comprised 8 patients with an EC TCPC, mostly after a bidirectional Glenn (BDG) procedure, and group 2 had 8 patients with an LT TCPC. Five of the 8 patients with an LT TCPC had a hemi-Fontan (HF) procedure before Fontan completion, and 3 patients had a previous BDG procedure or no prior palliation.
Imaging Protocol
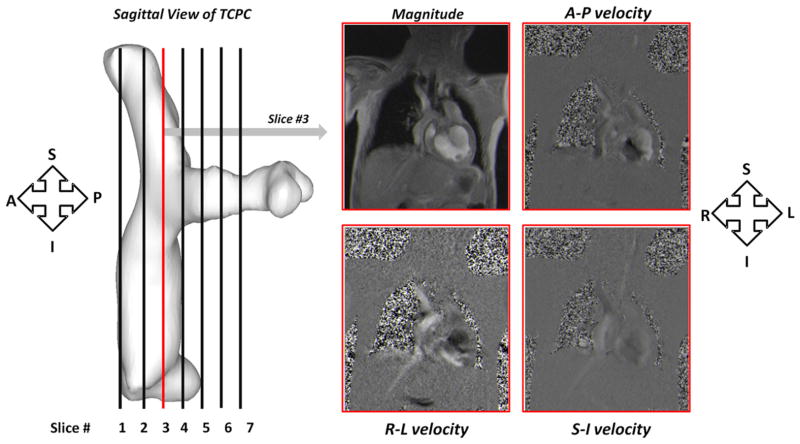
A Siemens 1.5T Avanto scanner (Siemens Medical Systems, Erlangen, Germany) was used for imaging 13 of the 16 patients, and a Philips Achieva 1.5T scanner (Philips Medical Systems BV, Best, The Netherlands) was used for the remaining 3 patients. PC MRI velocity acquisitions were composed of 5 to 10 contiguous slices of retrospectively electrocardiogram-gated, 3D phase velocity maps in a coronal view of the TCPC. The matrix size ranged from 192 × 168 to 256 × 256 pixels depending on patient size. Pixel sizes were between 0.98 × 0.98 and 1.76 × 1.76 mm2, slice thickness was 6 mm, and the repetition time/echo time ranged from 5.02/3.1 to 8.77/4.8 ms. Each component of velocity was acquired in a single breath-hold. Care was taken to optimize the position of the TCPC within the coronal stack so as to capture the entire connection. The orientation of the PC MRI acquisition relative to the TCPC is shown in Figure 1.
FIGURE 1.
Coronal acquisition of PC MRI slices throughout the entire TCPC volume. PC MRI, Phase-contrast magnetic resonance imaging; TCPC, total cavopulmonary connection; S, superior; I, inferior; A, anterior; P, posterior; R, right; L, left.
Image Analysis
Image processing and analysis were primarily performed using MAT-LAB (Mathworks Inc, Natick, Mass), allowing the algorithm to directly read in the dicom images produced by the magnetic resonance scanner with minimal data manipulation needed. It is worth noting that, although this algorithm currently uses commercial software, it could be readily implemented on open source, widely available platforms, such as Python. 3D anatomies were segmented and reconstructed using semiautomatic methods previously described.16,17 The anatomic reconstructions were then used to automatically define the boundaries of the vascular structures in the PC MRI velocity acquisitions. The anisotropic nature of the PC MRI acquisition required the velocity data to be interpolated in between successive slices so that 3D flow analyses could be performed. The time required to progress from image segmentation to the interpolated results was on the order of 1 hour.
3D Velocity Field Interpolation and Reconstruction
Recently, new methods for interpolating velocity vectors while preserving the fundamental incompressible nature of fluid flow have been proposed.18,19 These divergence-free interpolation techniques, which are formulated with radial basis functions, were extended and applied in the present study to interpolate velocity fields in between multiple coronal slices, such that the through-plane resolution approximated the in-plane pixel size. This technique is particularly advantageous because it uses the physics of blood flow to establish meaningful relationships between velocity vectors obtained from successive PC MRI slices. Once the velocity is interpolated, blood flow streamlines can be visualized in 3D, enabling better quantification of flow structures within the TCPC. The interpolated data sets were imported into Tecplot (Tecplot Inc, Bellevue, Wash) for 3D flow visualization. Flow streamlines were calculated from vessel emitter planes for each phase based on the 3D velocity vector field. Although the use of particle tracking or pathline visualization would be more realistic for time-varying velocity fields, the spatiotemporal resolution of MRI is not sufficient to support such methods. However, the time variations of TCPC flows are insignificant compared with aortic flows, for example, and so the use of streamlines provides a meaningful representation. The streamlines were color-coded by velocity magnitudes to depict a spatially varying velocity field. Additionally, the balance of caval flow distribution to the left pulmonary artery (LPA) and the right pulmonary artery (RPA) was quantified on the basis of the vessel of streamline termination.
RESULTS
Patient Characteristics
There were no statistically significant differences in age (7.50 ± 3.42 vs 8.83 ± 4.27 years; P = .69), body surface area (1.02 ± 0.35 vs 1.08 ± 0.45 m2; P = .77), or cardiac index (3.75 ± 1.6 vs 2.95 ± 0.71 L · min−1 · m−2; P = .26) between the EC and LT groups. Two (25%) of the 8 patients in the EC group and 4 (50%) of 8 patients in the LT group had hypoplastic left heart syndrome (P = .61), whereas the rest had other variants of single-ventricle etiology.
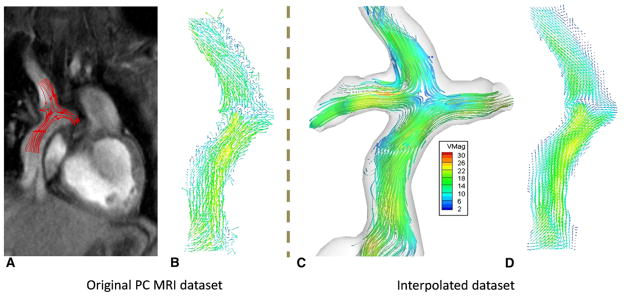
The benefit of divergence-free interpolation is shown in Figure 2. Without interpolation, every coronal slice acquired with PC MRI would have to be analyzed individually, slice by slice (Figure 2, A and B). The interactions between contiguous planes using the through-plane velocity component are ignored owing to the large slice thickness associated with each slice (~6 mm). Figure 2, C, shows a typical interpolated data set with 3D flow streamlines obtained from 7 coronal PC MRI slices. Note the similarity in the velocity vector field between a slice extracted from the interpolated data set (Figure 2, D) and the corresponding velocity vector field obtained from the original PC MRI acquisition at the same location. All the dominant flow features are retained, whereas noise is mitigated.
FIGURE 2.
Benefit of performing 3-dimensional (3D) flow analyses: A, Magnitude image of a PC MRI acquisition with flow streamlines drawn using 2D velocity fields from part B. B, Vector field obtained from the 2D PC MRI. C, A fully interpolated 3D data set with flow streamlines evaluated from the interpolated 3D velocity field. D, 2D vector field obtained from the interpolate data set at the same location as part B. PC MRI, Phase-contrast magnetic resonance imaging.
Dynamic Flow Characteristics Over the Cardiac Cycle
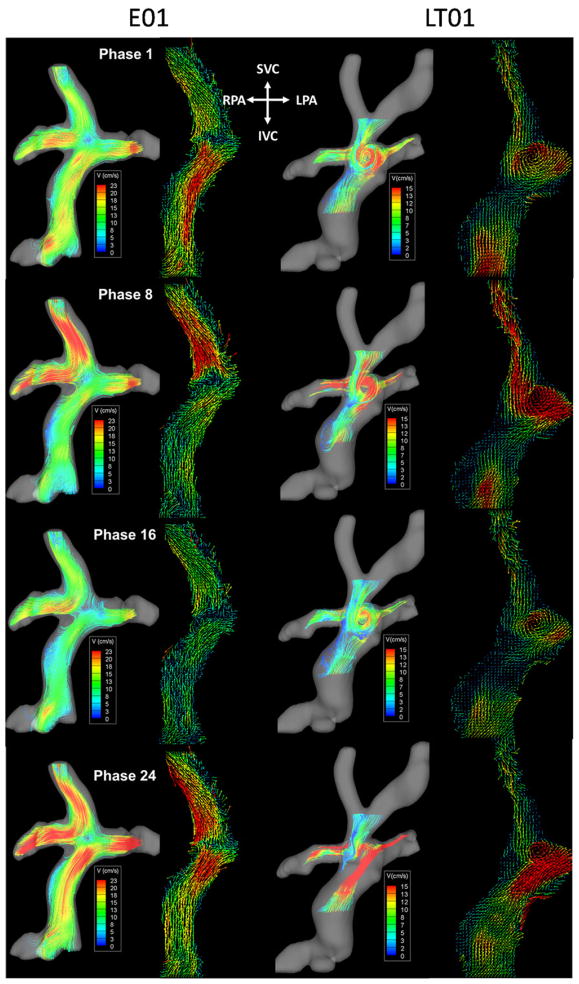
Figure 3 shows the time-varying 3D flow fields (Videos 1 and 2 included as supplementary material) at selected phases over the cardiac cycle for 2 patients representative of both groups: E01 and LT01. For comparison, the right panel of each phase shows velocity vector plots from the central plane of the raw PC MRI data. For LT01, the dominant flow feature was a large vortex in the center of the connection. Although the diameter of the vortex and the velocity of recirculation visibly changed, it was otherwise consistently evident over the entire cycle. Furthermore, throughout the cardiac cycle, flow from the IVC was seen to distribute evenly to both pulmonary arteries. For E01, IVC flow was generally streamlined with a secondary helical pattern because of baffle curvature, whereas the superior vena cava (SVC) flow tended almost exclusively to the RPA. As in LT01, the instantaneous velocity values were seen to change with time, but the prominent flow features were maintained throughout the cardiac cycle.
FIGURE 3.
Time-varying flow structures color coded by velocity magnitude of an EC (left panel) and LT TCPC (right panel). TCPC, Total cavopulmonary connection; EC, extracardiac; LT, lateral tunnel; SVC, superior vena cava; IVC, inferior vena cava; RPA, right pulmonary artery; LPA, left pulmonary artery.
Flow Fields Through EC TCPCs
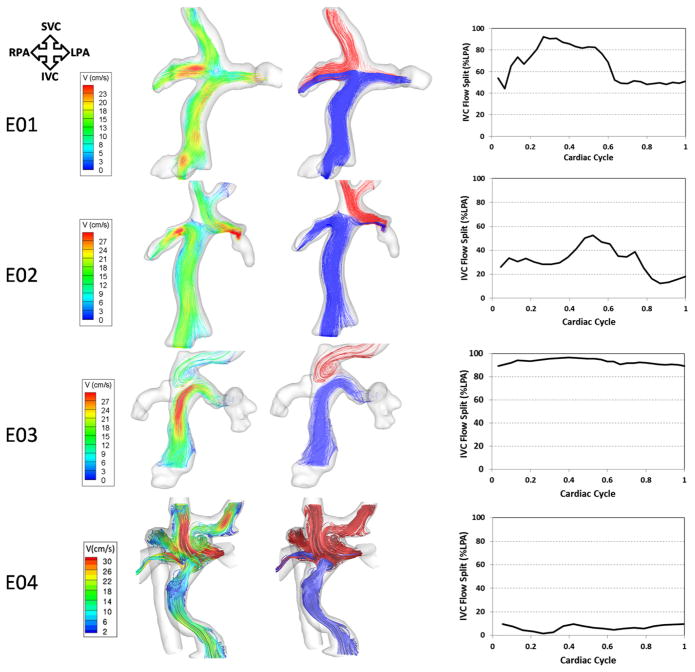
Global hemodynamics of typical EC connections as detailed by velocity-contoured streamlines are shown in Figures 4 and 5 (left panel). Flow was generally ordered and laminar with a helical pattern in the IVC conduit. E01 exemplifies a typical EC flow behavior. In this geometry, even though there was no offset between the SVC and IVC conduits with similar connection angles to the pulmonary arteries, the SVC flow tended toward the RPA, whereas the IVC flow (and thus hepatic flow) split between the 2 pulmonary arteries with a preference to the LPA. The waveform depicting the percentage of IVC streamlines to the LPA (right panel of Figure 4) shows that the contribution of the IVC to LPA increased at the beginning of the cardiac cycle and then stabilized at 50% toward the second half of the cardiac cycle, resulting in a mean contribution of 66% ± 17% to the LPA. In the case of E02, the general flow characteristics were similar. However, the offset between the SVC and the IVC conduits biased the IVC flow in the direction of that offset (right).
FIGURE 4.
Three-dimensional (3D) flow structures through 4 EC TCPC models with varying geometries. Left pane, Flow streamlines color-coded by velocity magnitude. Middle pane, Flow streamlines color-coded by their source of origin (SVC, red; IVC, blue). Right pane, Waveforms depicting varying IVC-LPA flow splits over the cardiac cycle. TCPC, Total cavopulmonary connection; EC, extracardiac; SVC, superior vena cava; IVC, inferior vena cava; RPA, right pulmonary artery; LPA, left pulmonary artery; V, velocity.
FIGURE 5.
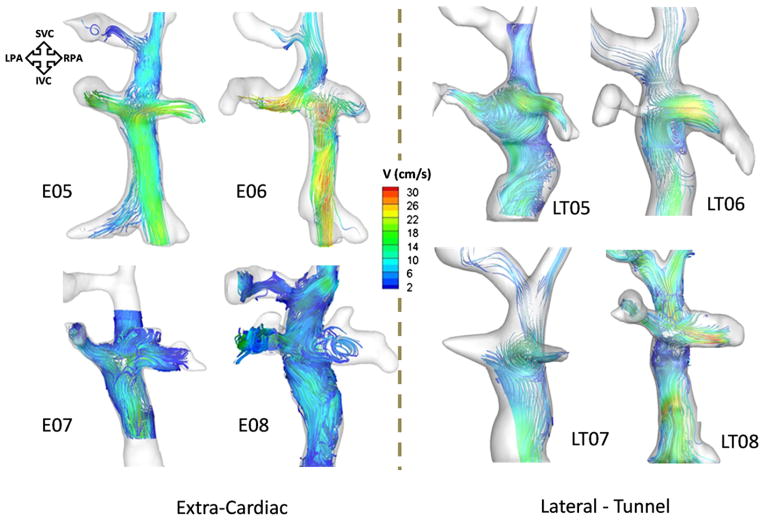
Color-coded 3-dimensional (3D) flow streamlines of the remaining 4 EC (left panel) and LT TCPCs (right panel). TCPC, Total cavopulmonary connection; EC, extracardiac; LT, lateral tunnel; SVC, superior vena cava; IVC, inferior vena cava; RPA, right pulmonary artery; LPA, left pulmonary artery; V, velocity.
There were a few notable exceptions to the “typical” EC behavior, in which the flow was more chaotic. E03 had a previous HF connection, which explained the presence of a large pouch-like structure. In addition, this patient did not have an SVC and, as a result, the innominate vein carried all the superior caval flow. Flow from the innominate vein tended toward the RPA, whereas most of the IVC flow went into the LPA. E04 was the most complex EC case from both anatomic and hemodynamic perspectives. Specifically, this patient had an interrupted IVC with azygos vein continuation, meaning that the majority of the inferior venous flow was carried by the azygos vein whereas the “IVC” carried only hepatic venous return. The highly uneven distribution of hepatic flow (blue stream traces in Figure 4) is evident, with the majority of hepatic flow streaming toward the right lung. It is noteworthy that this patient formed the basis of the study by Sundareswaran and associates,11 in which these PC MRI findings of unbalanced hepatic distribution were used to guide successful virtual preoperative planning efforts for surgical correction. [11].
Figure 5 shows the color-coded stream traces of the remaining 4 EC TCPC models. In models E05 and E07, the IVC streamlines split uniformly in the direction of both the LPA and RPA, partly because there was no offset between the SVC and the IVC. In E06, there was an offset between the IVC and the SVC with the IVC displaced toward the RPA; hence, there was preferential flow from IVC to RPA.
Flow Fields Through LT TCPCs
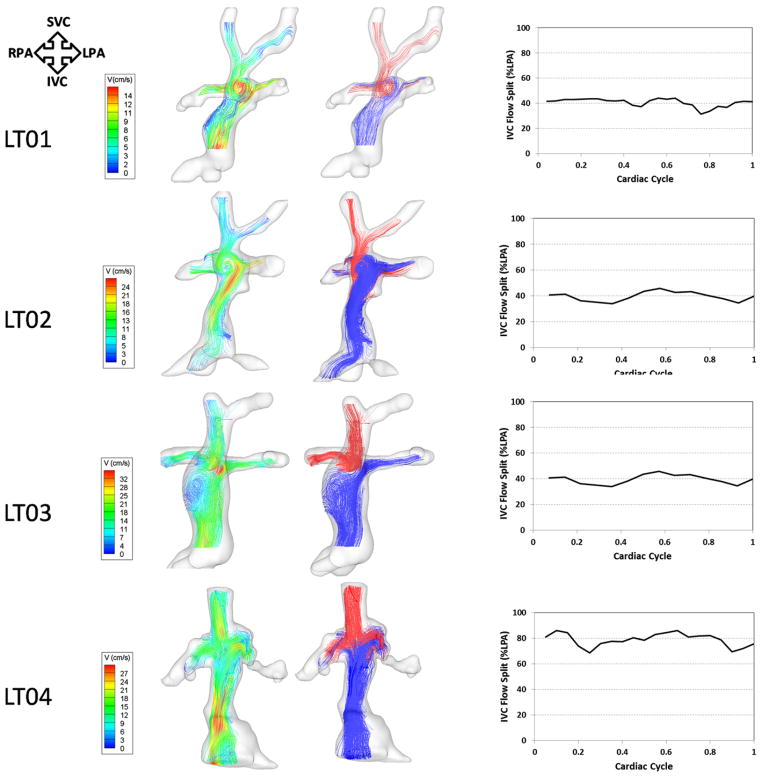
Global hemodynamics and caval interactions are depicted in detail for 4 LT models with contrasting geometries in Figure 5 (right panel) and Figure 6. The “normal” flow characteristics of LT TCPCs were highly dependent on the design of the SVC–pulmonary artery connection (ie, side to side [HF] or end to side [BDG]). Those with a previous HF (LT01 and LT02, LT04–LT07) were all characterized by a counterclockwise rotating vortex in the center of the connection, which may be attributed to the presence of an HF pouch and the angle of the IVC anastomosis. This recirculation was seen to promote mixing of the caval flows and thus even distribution of IVC flow to both lungs. For example, the IVC contribution to the LPA was 42% ± 5% and 41% ± 3% for LT01 and LT02, respectively. The notable exception to this trend was seen in LT07, presumably because the IVC contribution to the total flow (70%) was much higher than the contribution of the SVC (30%).
FIGURE 6.
Three-dimensional (3D) flow structures through 4 LT TCPC models with varying geometries. Left pane, Flow streamlines color-coded by velocity magnitude. Middle pane, Flow streamlines color-coded by their source of origin (SVC, red; IVC, blue). Right pane, Wave forms depicting varying IVC-LPA flow splits over the cardiac cycle. TCPC, Total cavopulmonary connection; LT, lateral tunnel; SVC, superior vena cava; IVC, inferior vena cava; RPA, right pulmonary artery; LPA, left pulmonary artery; V, velocity.
Comparatively, the LT TCPCs with an end-to-side connection (LT03, LT04, and LT08) exhibited different flow characteristics. Only 1 of the geometries had a vortex, located below the center of the connection (LT03). This geometry had a pouch below the SVC anastomosis (as opposed to being at the site of the connection, as in the HF LTs). As the IVC flow entered the connection, it experienced a sudden increase in cross-sectional area, followed by a distal constriction at the SVC anastomosis site. This geometric feature correlated with a large counterclockwise rotating vortex in the intra-atrial pouch. For the other 2 LT geometries (LT07 and LT08), there was neither a pouch at the connection site nor a midatrial bulge. In those geometries, the flow closely resembled that of an EC connection with no caval offset. There was a direct collision of the caval flows, followed by a fairly uniform IVC and SVC distribution to the LPA and RPA.
Quantitative 3D Velocity Comparison Between EC and LT TCPC
Overall, no differences were observed in the mean velocities (10.1 ± 3.77 vs 8.65 ± 2.43 cm/s; P = .38), maximum velocities (37.1 ± 18.2 vs 33.6 ± 16.3 cm/s; P = .69), and IVC flow splits to the LPA (43% ± 7 % vs 46% ± 5%; P = .34) between EC and LT TCPCs, respectively.
DISCUSSION
In this article, 3D in vivo hemodynamics in 16 patients with a Fontan connection were visualized and documented in detail. The key contributions of this work are as follows: (1) this is the first time in vivo volumetric flow structures inside the TCPC have been reconstructed and quantified for a sizable patient group using widely available magnetic resonance sequences; (2) this is the first time that PC MRI has been used to compare 3D flow structures in LT and EC TCPCs. By virtue of the observed agreement between the present findings and previous results, this work serves both to add validity and merit to those findings, as well as to demonstrate the potential for the present methods to provide clinical value.
When 3D velocity fields within the TCPC were reconstructed, significant differences in flow structures were observed between EC and LT TCPCs. In most EC cases, the flow in the IVC conduit was laminar and generally ordered, with the exception of a secondary helical component that arose as a result of conduit curvature. Interactions with the superior venous returns were highly dependent on the presence of a caval offset. The inferior and superior venous returns typically collided and split at the center of the connection, resulting in a characteristic flow stagnation point, evident in all EC geometries.
Another unique component to this study was the ability to compare and contrast the hemodynamics as a function of SVC connection type, which has not previously been reported. An LT connection after an HF superior anastomosis led to the creation of large vortices at the connection site. On the other hand, after an end-to-side superior caval anastomosis (BDG), the flow dynamics, in the absence of a bulging of the atrial wall, more closely resembled the laminar behavior of a zero-offset EC TCPC. This disparity suggests that previous palliation types (BDG, HF, or other) play a significant role in determining the hemodynamics after the final-stage Fontan operation. However, in the 1 case in which there was an extended region immediately proximal to the constricted connection region (LT03), a recirculation region did form. This suggests that patient-to-patient variation of TCPC geometry is still a paramount determinant of the final hemodynamic profile.
The presence of large vortices in LT TCPCs has been shown before using in vitro and computational fluid dynamics studies.4,5,7,9 Specifically, a study using in vitro experiments by de Zelicourt and associates9 demonstrated that these vortices were highly complex, with increasing complexity as cardiac output was elevated to simulate and study exercise conditions. The implications of this vortex are debatable. On one hand, it promotes better mixing of caval flows, which ensures that hepatic nutrients from the liver are adequately distributed to the 2 lungs. However, the flow environment may become unstable as cardiac output increases to exercise flow rates (2× and 3× resting flow rate),8 thereby increasing power losses.
The IVC flow was generally seen to split equally between the LPA and RPA for both EC and LT Fontans. That is to say, no bias is apparently introduced by selecting one connection type over another. Yet, the ECs were seen to have much greater sensitivity to the placement of the surgical baffle. The presence of a caval offset introduced a preferential direction (ie, to the proximal lung) to IVC outflow. Thus, although such an offset has previously been shown to reduce energy losses within the TCPC,10 it may do so at the expense of equal hepatic distribution.
CONCLUSIONS
In conclusion, 3D volumetric time-varying TCPC flow fields were evaluated in vivo for the first time using PC MRI. The proposed methods allowed for detailed qualitative and quantitative analyses of LT and EC TCPCs. Significant differences in flow structures between the 2 groups were illustrated, which highlighted the advantages and disadvantages of both LT and EC TCPCs. The goal of this study is not to recommend one surgical procedure over the other, but to provide the surgeon with valuable hemodynamic end points that should be combined with other clinically relevant data to make informed and effective surgical decisions. Further, work of this type establishes the critical link between the in vitro, computational, and in vivo paradigms that is required for engineering to reach the clinic, where it can assist members of the Fontan community in improving long-term patient outcomes.
Supplementary Material
Acknowledgments
Supported by the National Heart, Lung, and Blood Institute (grant HL-67622) and an American Heart Association (AHA) Predoctoral Fellowship (grant 0715374B).
Abbreviations and Acronyms
- BDG
bidirectional Glenn
- 3D
3-dimensional
- EC
extracardiac
- HF
hemi-Fontan
- IVC
inferior vena cava
- LPA
left pulmonary artery
- LT
lateral tunnel
- PC
phase-contrast magnetic resonance
- MRI
imaging
- RPA
right pulmonary artery
- SVC
superior vena cava
- TCPC
total cavopulmonary connection
Footnotes
Disclosures: Authors have nothing to disclose with regard to commercial support.
References
- 1.de Leval MR, Kilner P, Gewillig M, Bull C. Total cavopulmonary connection: a logical alternative to atriopulmonary connection for complex Fontan operations. J Thorac Cardiovasc Surg. 1988;96:682–95. [PubMed] [Google Scholar]
- 2.Marcelletti C, Corno A, Giannico S, Marino B. Inferior vena cava–pulmonary artery extracardiac conduit: a new form of right heart bypass. J Thorac Cardio-vasc Surg. 1990;100:228–32. [PubMed] [Google Scholar]
- 3.Lardo AC, Webber SA, Friehs I, del Nido PJ, Cape EG. Fluid dynamic comparison of intra-atrial and extracardiac total cavopulmonary connections. J Thorac Cardiovasc Surg. 1999;117:697–704. doi: 10.1016/S0022-5223(99)70289-8. [DOI] [PubMed] [Google Scholar]
- 4.Migliavacca F, Dubini G, Bove EL, de Leval MR. Computational fluid dynamics simulations in realistic 3-D geometries of the total cavopulmonary anastomosis: the influence of the inferior caval anastomosis. J Biomech Eng. 2003;125:805–13. doi: 10.1115/1.1632523. [DOI] [PubMed] [Google Scholar]
- 5.Bove EL, de Leval MR, Migliavacca F, Guadagni G, Dubini G. Computational fluid dynamics in the evaluation of hemodynamic performance of cavopulmonary connections after the Norwood procedure for hypoplastic left heart syndrome. J Thorac Cardiovasc Surg. 2003;126:1040–7. doi: 10.1016/s0022-5223(03)00698-6. [DOI] [PubMed] [Google Scholar]
- 6.Hsia TY, Migliavacca F, Pittaccio S, Radaelli A, Dubini G, Pennati G, et al. Computational fluid dynamic study of flow optimization in realistic models of the total cavopulmonary connections. J Surg Res. 2004;116:305–13. doi: 10.1016/j.jss.2003.08.004. [DOI] [PubMed] [Google Scholar]
- 7.Pekkan K, de Zélicourt D, Ge L, Sotiropoulos F, Frakes D, Fogel MA, et al. Physics-driven CFD modeling of complex anatomical cardiovascular flows—a TCPC case study. Ann Biomed Eng. 2005;33:284–300. doi: 10.1007/s10439-005-1731-0. [DOI] [PubMed] [Google Scholar]
- 8.Whitehead KK, Pekkan K, Kitajima HD, Paridon SM, Yoganathan AP, Fogel MA. Nonlinear power loss during exercise in single-ventricle patients after the Fontan: insights from computational fluid dynamics. Circulation. 2007;116(11 Suppl):I165–71. doi: 10.1161/CIRCULATIONAHA.106.680827. [DOI] [PubMed] [Google Scholar]
- 9.de Zélicourt DA, Pekkan K, Wills L, Kanter K, Forbess J, Sharma S, et al. In vitro flow analysis of a patient-specific intraatrial total cavopulmonary connection. Ann Thorac Surg. 2005;79:2094–102. doi: 10.1016/j.athoracsur.2004.12.052. [DOI] [PubMed] [Google Scholar]
- 10.Sharma S, Goudy S, Walker P, Panchal S, Ensley A, Kanter K, et al. In vitro flow experiments for determination of optimal geometry of total cavopulmonary connection for surgical repair of children with functional single ventricle. J Am Coll Cardiol. 1996;27:1264–9. doi: 10.1016/0735-1097(95)00598-6. [DOI] [PubMed] [Google Scholar]
- 11.Sundareswaran KS, de Zélicourt D, Sharma S, Kanter KR, Spray TL, Rossignac J, et al. Correction of pulmonary arteriovenous malformation using image-based surgical planning. J Am Coll Cardiol Img. 2009;2:1024–30. doi: 10.1016/j.jcmg.2009.03.019. [DOI] [PMC free article] [PubMed] [Google Scholar]
- 12.Be’eri E, Maier SE, Landzberg MJ, Chung T, Geva T. In vivo evaluation of Fontan pathway flow dynamics by multidimensional phase-velocity magnetic resonance imaging. Circulation. 1998;98:2873–82. doi: 10.1161/01.cir.98.25.2873. [DOI] [PubMed] [Google Scholar]
- 13.Markl M, Geiger J, Kilner PJ, Foll D, Stiller B, Beyersdorf F, et al. Time-resolved three-dimensional magnetic resonance velocity mapping of cardiovascular flow paths in volunteers and patients with Fontan circulation. Eur J Cardiothorac Surg. 2011;39:206–12. doi: 10.1016/j.ejcts.2010.05.026. [DOI] [PubMed] [Google Scholar]
- 14.Morgan VL, Graham TP, Jr, Roselli RJ, Lorenz CH. Alterations in pulmonary artery flow patterns and shear stress determined with three-dimensional phase-contrast magnetic resonance imaging in Fontan patients. J Thorac Cardiovasc Surg. 1998;116:294–304. doi: 10.1016/s0022-5223(98)70130-8. [DOI] [PubMed] [Google Scholar]
- 15.Sharma S, Ensley AE, Hopkins K, Chatzimavroudis GP, Healy TM, Tam VK, et al. In vivo flow dynamics of the total cavopulmonary connection from three-dimensional multislice magnetic resonance imaging. Ann Thorac Surg. 2001;71:889–98. doi: 10.1016/s0003-4975(00)02517-0. [DOI] [PubMed] [Google Scholar]
- 16.Frakes DH, Conrad CP, Healy TM, Monaco JW, Fogel M, Sharma S, et al. Application of an adaptive control grid interpolation technique to morphological vascular reconstruction. IEEE Trans Biomed Eng. 2003;50:197–206. doi: 10.1109/TBME.2002.807651. [DOI] [PubMed] [Google Scholar]
- 17.Frakes DH, Smith MJ, Parks J, Sharma S, Fogel SM, Yoganathan AP. New techniques for the reconstruction of complex vascular anatomies from MRI images. J Cardiovasc Magn Reson. 2005;7:425–32. doi: 10.1081/jcmr-200053637. [DOI] [PubMed] [Google Scholar]
- 18.Narcowich F, Ward J. Generalized hermite interpolation via matrix valued conditionally positive definite functions. Math Comp. 1994;63:661–87. [Google Scholar]
- 19.Lowitzch S. A density theorem for matrix-valued radial basis functions. Num Algorithms. 2005;39:253–6. [Google Scholar]
Associated Data
This section collects any data citations, data availability statements, or supplementary materials included in this article.


