

Abstract
MicroRNAs (miRNAs) are a class of small RNAs that regulate gene expression and are implicated in wide-ranging cellular processes and pathological conditions including Duchenne muscular dystrophy (DMD). We have compared differential miRNA expression in proximal and distal limb muscles, diaphragm, heart and serum in the mdx mouse relative to wild-type controls. Global transcriptome analysis revealed muscle-specific patterns of differential miRNA expression as well as a number of changes common between tissues, including previously identified dystromirs. In the case of miR-31 and miR-34c, upregulation of primary-miRNA transcripts, precursor hairpins and all mature miRNAs derived from the same transcript or miRNA cluster, strongly suggests transcriptional regulation of these miRNAs. The most striking differences in differential miRNA expression were between muscle tissue and serum. Specifically, miR-1, miR-133a, and miR-206 were highly abundant in mdx serum but downregulated or modestly upregulated in muscle, suggesting that these miRNAs are promising disease biomarkers. Indeed, the relative serum levels of these miRNAs were normalized in response to peptide-phosphorodiamidate morpholino oligonucleotide (PMO) mediated dystrophin restoration therapy. This study has revealed further complexity in the miRNA transcriptome of the mdx mouse, an understanding of which will be valuable in the development of novel therapeutics and for monitoring their efficacy.
Keywords: Duchenne muscular dystrophy, mdx, microarray, microRNA
Introduction
Duchenne muscular dystrophy (DMD) is an X-linked, recessive, fatal disorder caused by mutations in the gene that encodes the dystrophin protein.1,2 DMD is the most common muscular dystrophy and affects 1 in 3,500 live male births. Disease progression is characterized by progressive myofiber degeneration, muscle wasting, fibrosis and loss of ambulation. Degeneration of cardiac muscle and the diaphragm results in cardiac and/or respiratory failure with subsequent fatality in the second or third decade of life.
Although the primary genetic defect in DMD has been known for several decades, effective treatment has been limited by a lack of understanding of the complex, multifactorial disease pathophysiology. Loss of functional dystrophin at the sarcolemma and concomitant disruption of the dystrophin-associated protein complex leads to wide-ranging cellular pathologies. These include: myofiber necrosis, impaired signaling activities (e.g., NO signaling via neuronal nitric oxide synthase),3,4 loss of sarcolemmal integrity,5,6,7 irregular calcium homeostasis,5,8,9,10 increased oxidative stress,11 chronic cycles of degeneration and regeneration leading to satellite cell depletion,12 and inflammation.13 The utility of gene expression profiling has the potential to identify the sequence of events that leads from dystrophin loss to these pathological processes.
MicroRNAs (miRNAs) are a class of small (21–25 nt) non-protein-coding RNAs that regulate gene expression by a homology dependent mechanism distinct from, but related to the small interfering RNA-mediated RNA interference pathway.14 Primarily, miRNAs function by binding to the 3′ untranslated regions of target mRNA transcripts forming imperfect RNA duplexes whereby they facilitate either translational repression or decapping and subsequent endonucleolytic degradation of the transcript.15,16,17 A 3′ untranslated region may contain many miRNA target sites and a single miRNA can target multiple mRNA transcripts. The majority of mammalian mRNAs (~60%) contain conserved miRNA targets underlining the importance of miRNA regulation.18 Consequently, miRNAs act to modulate global gene expression through the regulation of families of related transcripts.19 Many miRNAs show tissue-specific expression20 and a number of miRNAs are primarily expressed in skeletal and cardiac muscle (e.g., miR-1, miR-133, and miR-206).21,22 Transcription of muscle-specific miRNAs has been shown to be regulated by transcription factors involved in muscle growth and development (e.g., MYOD, MEF2, and MYF5).23,24,25 In addition, non muscle-specific miRNAs (miR-26a, miR-181, and miR-486) have also been found to regulate skeletal muscle processes.26,27,28
The discovery that unique miRNA expression patterns were associated with different tumour types29 has led to investigation of miRNA profiles in a wide variety of other diseases. Two studies profiling DMD-associated miRNAs have identified common differentially expressed miRNAs despite considerable differences in results.30,31 (Supplementary Table S1). For example, Greco et al. showed a ~70-fold increase in miR-31 expression in both mdx and human muscle whereas Eisenberg et al. did not identify this miRNA as being differentially expressed (in DMD patient biopsies). Conversely, the most differentially expressed miRNA in the Eisenberg study, miR-146b, was not significantly changed in the study by Greco et al. The differences in results between these studies may be due to the methodologies used (microarray and TaqMan array, respectively) and the assaying of different muscle groups.
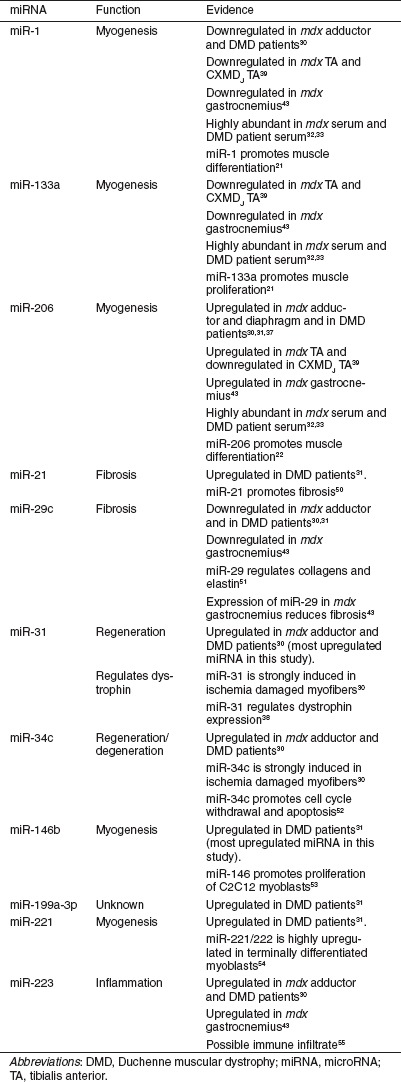
Here, we have investigated miRNA expression in a range of muscle groups and serum in mdx mice compared with age- and sex-matched wild-type controls. We have used miRNA microarray technology to perform an initial comparative miRNA analysis between quadriceps femoris, diaphragm, and heart muscles. Using small RNA TaqMan assays we subsequently validated a number of differentially expressed miRNAs identified on the arrays and expanded the study to include the triceps and tibialis anterior (TA) muscles, and serum. We have focused on a set of 11 miRNAs which we refer to as “dystromirs.” This term has been used previously32 but here we define it more specifically as miRNAs which have been previously found to be differentially expressed in DMD patients and/or dystrophic animal models. The dystromirs relevant to this study are described in Table 1.
Table 1. Dystromirs of interest in this study.
A comprehensive understanding of miRNA expression in the mdx mouse is important because: (i) miRNAs are promising biomarkers for noninvasive monitoring of disease progression and response to experimental therapies, (ii) it contributes to the understanding of the series of molecular events leading from loss of dystrophin to dystrophic pathology, and (iii) it forms the basis for the development of novel miRNA-based therapeutics. The present study is the first to compare differential miRNA expression in the mdx heart and diaphragm and has directly compared multiple muscles and serum from the same set of animals. The findings point to an unexpected layer of complexity in the mdx mouse miRNA transcriptome.
Results
miRNAs microarray analysis
To identify differentially expressed mature miRNAs associated with the DMD phenotype, miRNA microarray analysis was performed on quadriceps, diaphragm and cardiac muscles harvested from 8-week-old C57Bl/10 (wild-type) and mdx mice. Statistically significant (P < 0.05) changes in mature miRNA expression were identified across all of the tissues; 188 miRNAs in quadriceps (false discovery rate (FDR) = 6%), 181 miRNAs in diaphragm (FDR = 5%) and 64 miRNAs in heart (FDR = 26%). Analysis of the full miRNA transcriptome reveals widespread differences between these tissues (Figure 1a). More miRNAs were differentially expressed in quadriceps and diaphragm compared to heart and, in addition, the observed changes in the heart were generally of lesser magnitude than in quadriceps and diaphragm (Figure 1b). Overlap between miRNAs commonly differentially expressed across all three tissues is indicated in the Venn diagram (Figure 1c). For each tissue there was a set of miRNAs found to be differentially expressed only in that tissue suggesting tissue-specific differences in pathological processes. 18 miRNAs that were significantly differentially expressed in all three tissues are shown graphically in Figure 1d and fold changes listed in Supplementary Table S2. In addition to the dystromirs listed in Table 1, miR-1944, miR-296-3p, and miR-543 showed increased expression, and miR-185, miR-151-5p, miR-151-3p, miR-345-3p, miR-139-5p, miR-143, and miR-378* showed decreased expression in all three mdx tissues. To our knowledge these miRNAs listed above have not been previously identified as differentially expressed in miRNA profiling studies of the mdx mouse or dystrophic patients.
Figure 1.

MicroRNA (miRNA) transcriptome analysis. Quadriceps, diaphragm, and heart tissue from 8-week-old C57/Bl10 [wild type (WT)] and mdx mice (n = 4) were harvested and miRNA microarray analysis performed. (a) Heatmap of whole miRNA transcriptome of all three tissues for all miRNAs with a statistically significant (P < 0.05) change in expression between WT and mdx mice. (b) Scatter plot showing the relative spread of fold changes across all three tissues. The most upregulated and most downregulated miRNAs across all of the arrays are highlighted. (c) Venn diagram showing common changes in miRNA expression between the tissues. (d) Heatmap showing miRNAs with statistically significant expression changes in all three tissues. Hierarchical clustering analysis was used to identify patterns of miRNA expression in the mdx quadriceps, diaphragm, and heart. Red signifies an increase in expression and green, a decrease in expression. Heatmap scale bars indicate log2-fold changes.
RT-qPCR validation of array data
In order to validate the results of the miRNA microarray, reverse transcription-quantitative PCR (RT-qPCR) analysis was performed on the same RNA samples used for the arrays. Small RNA TaqMan assays designed to detect only the mature miRNA species were used for all of the dystromirs in Table 1. In order to determine whether inferences drawn from array data can be applied to other tissues, the study was expanded to include dystromir expression in additional tissues; triceps and TA muscles (Figure 2a–k and fold changes listed in Supplementary Table S3). Serum was also included as changes in serum miRNA abundance have recently been reported in the mdx mouse, CXMDJ dog and DMD patients.32,33 miR-1 and miR-133a were downregulated or unchanged in all mdx muscles whereas in serum both miRNAs were increased by 43.6-fold and 50.6-fold, respectively (Figure 2a,f). miR-206 was increased in all mdx groups measured with a 52.9-fold increase observed in serum (Figure 2i). miRNA-21, -31, -34c, and -221 were increased in all muscles except the heart (only modest increases were observed in mdx serum in each case) (Figure 2b,d,e,j). miR-223 was found to be increased in the skeletal muscles but not in the diaphragm, heart, or serum (Figure 2k). Notably, miR-146b was only significantly increased in mdx quadriceps (Figure 2g) and similarly, miR-199a-3p was only increased in mdx quadriceps and diaphragm (Figure 2h).
Figure 2.

Reverse transcription-quantitative PCR (RT-qPCR) analysis of dystromir expression. Tibialis anterior (TA), triceps, quadriceps, diaphragm, heart, and serum from 8-week-old C57/Bl10 [wild type (WT)] and mdx mice were harvested and small RNA TaqMan reverse transcriptase-quantitative PCR (RT-qPCR) performed to determine relative expression of the following dystromirs: (a) miR-1, (b) miR-21, (c) miR-29c, (d) miR-31, (e) miR-34c, (f) miR-133a, (g) miR-146b, (h) miR-199a-3p, (i) miR-206, (j) miR-221, (k) miR-223. Gray bars represent WT samples and black bars represent mdx samples. Relative fold changes were determined by the Pfaffl method. Tissue microRNA (miRNA) expression was normalized to miR-16 and serum miRNA expression normalized to miR-223 (consequently serum expression of miR-223 is omitted from panel (k)). All values are mean + SEM. *P < 0.05, **P < 0.01, ***P < 0.001. For tissue samples n = 4. For WT serum, n = 3 and for mdx serum n = 4.
Generally, the RT-qPCR validation closely matches the miRNA microarray data (Figure 3a,b and Supplementary Table S4). Hierarchical clustering analysis was used to group fold changes for the respective miRNAs and tissues. As expected, quadriceps, TA, and triceps muscles cluster away from diaphragm and heart. Similarly, all the tissues cluster away from serum (Figure 3b). In quadriceps and diaphragm fold changes were highly similar between the two methodologies used (e.g., in the case of miR-31 expression; 70.9-fold by RT-qPCR and 74.3 by microarray) with few exceptions. A number of miRNAs were changed in the same direction between the two methodologies but did not reach significance at the 95% level as measured by RT-qPCR (i.e., miR-1, miR-29c, and miR-133a in quadriceps, and miR-29c, miR-146b, miR-199a-3p, and miR-223 in diaphragm). Interestingly, miR-1 was unchanged in the diaphragm array dataset but was significantly decreased as measured by RT-qPCR (–2.27-fold). In the heart dataset only miR-206 was significantly increased in mdx heart as measured by RT-qPCR but not by microarray. No other miRNAs were significantly changed in mdx heart as measured by RT-qPCR.
Figure 3.

Heatmaps of mdx dystromir expression. Heatmaps of dystromir expression as determined by (a) microRNA (miRNA) microarray analysis and (b) small RNA TaqMan RT-qPCR. Hierarchical clustering analysis was used to identify patterns of miRNA expression across the mdx tissues and serum. Red signifies an increase in expression and green, a decrease in expression. Heatmap scale bars indicate log2-fold changes.
The expression of one miRNA (miR-29c) did not match the microarray data. According to the miRNA microarray miR-29c was increased in mdx heart (1.29-fold, P = 0.0373) although the significance corresponds to a false discover rate of 0.24 and the possibility of a false positive cannot be excluded. Similarly, miR-29c expression was not significantly different as measured by RT-qPCR (Figure 2c and Supplementary Table S4).
In general, the cycle threshold (Ct) values for all miRNAs measured fell within the range of 20–30 cycles which was comparable to the reference miRNAs (Ct values around 25–26). miR-31 and miR-34c were expressed at low levels (Ct values 30–35) in all the C57 tissues. Raw fluorescence values from the miRNA microarray also indicate low levels of expression for these miRNAs (data not shown). miR-206 was present at very low levels in all of the heart samples (Ct values ~35) which is unsurprising given that expression of miR-206 is generally restricted to skeletal muscle.22
Interestingly, the abundance of dystromirs in the mdx serum did not match the pattern of expression observed in the tissues. This was reflected in the clustering analysis which showed that serum clustered separately from the tissues (Figure 3b). In particular, miR-1 and miR-133a were increased in mdx serum and were either decreased or unchanged in the mdx muscle tissues. Similarly, miR-206 was highly increased in serum but only moderately increased in the muscle tissues. Conversely, miR-31, was increased ~50–70-fold in quadriceps, TA and triceps but was only 2.3-fold increased in serum. Other dystromirs including miR-21, miR-34c, miR-221, and miR-223 followed similar patterns of differential expression between serum and muscle.
Transcriptional dystromir upregulation
Mature miRNAs are derived from hairpin structures residing within long primary transcripts. Often multiple miRNA hairpin structures are found in a single primary transcript, so-called miRNA clusters. After cleavage by Dicer, only one arm of the miRNA hairpin is loaded into the miRISC complex. miRISC loading is asymmetric and depends on the relative thermodynamic stability of the 5′ ends of each strand (i.e., the strand with most unstable 5′ end is preferentially loaded). Inspection of the miRNA microarray data revealed that, in many cases, all of the miRNAs from a primary transcript were concordantly differentially expressed. For example, miR-31 and miR-31* (the minor miRNA species derived from the 3′ arm of the miR-31 hairpin) were both increased in mdx quadriceps and diaphragm. Similar results were seen for the major and minor species of other dystromirs; miR-21, miR-146, and miR-199a (Supplementary Table S5) and for other non-dystromirs; miR-199b, miR-362, miR-675, miR-501, and miR-532 (data not shown). Similarly, the miRGen resource34 was utilized to identify miRNA clusters within the mouse genome that are differentially expressed in the mdx mouse. Two differentially expressed dystromir-containing clusters were identified: (i) the miR-34 cluster (i.e., mature miR-34c, miR-34c*, miR-34b-5p, and miR-34b-3p all upregulated) and (ii) the miR-221/miR-222 cluster (i.e., mature miR-221 and miR-222 upregulated). A number of other differentially expressed miRNA clusters were identified and are listed in Supplementary Table S6. Notably, mature miRNAs from the miR-188/miR-532 and miR-296/miR-298 clusters were concordantly upregulated in both mdx quadriceps and diaphragm.
The miRNA microarray chips also contained probe sets that detect pre-miRNA hairpins. Twelve pre-miRNA hairpins were significantly (P < 0.05) differentially expressed across all three tissues (Figure 4a). Each pre-miRNA was differentially expressed in at least two tissues and two pre-miRNAs, pre-miR-181a-2 and pre-miR-185, were differentially expressed in all three tissues. Expression of both pre-miR-31 and pre-miR-34c was increased in mdx quadriceps and diaphragm which matches the observed increases in mature miR-31 and miR-34c species, respectively.
Figure 4.

Differential expression of precursor-miRNAs and primary-miRNAs. (a) Statistically significant changes in precursor-miRNA (pre-miRNA) expression in mdx quadriceps, diaphragm, and heart (n = 4) as determined by microarray analysis. Hierarchical clustering analysis was used to identify patterns of pre-miRNA expression in the mdx quadriceps, diaphragm, and heart. Red signifies an increase in expression and green, a decrease in expression. Heatmap scale bars indicate fold changes. (b) Changes in primary-miRNA expression in mdx quadriceps for pri-miR-31, pri-miR-34c and pri-miR-206 as measured by RT-qPCR. Relative values were determined using the relative standard curve method and primary-miRNA expression normalized to PpiB. Values are mean + SEM, n = 4, * P < 0.05, ** P < 0.01.
Increases in mature miRNA levels could be due to either: (i) enhanced post-transcriptional Drosha/Dicer processing or (ii) upregulation of the primary-miRNA transcript. To discriminate between these possibilities we performed RT-qPCR with primer/probe assays that detect primary-miRNA transcripts for miRs-31, -34c, and 206. Statistically significant increases were detected for all three miRNAs in mdx quadriceps (Figure 4b). The increases in these pri-miRNAs correlated well with their mature miRNA counterparts (correlation coefficient = 0.980). Taken together these data suggest that miR-31, -34c, and -206 are upregulated at the level of transcription.
Pip6e-PMO treatment partially normalizes serum dystromir abundance
Circulating miR-1, miR-133a, and miR-206 have been proposed as serum biomarkers for the progression of DMD.32,33 In order to determine whether the serum levels of these dystromirs responded to antisense oligonucleotide-mediated exon skipping therapy, 12-week-old mdx mice were treated with a single 12.5 mg/kg tail vein injection of Pip6e-conjugated phosphorodiamidate morpholino oligonucleotide (PMO). (This conjugate is a novel variant of Pip5e-PMO that had previously been demonstrated to induce skipping of exon 23 from the mature dystrophin transcript to restore restoration of dystrophin protein expression and muscle function35 (also see C. Betts, A.F. Saleh, A.A. Arzumanov, S.M. Hammond, C. Godfrey, T. Coursindel et al. related manuscript). Treated mice were harvested 2 weeks after injection and TA, quadriceps, heart and diaphragm muscles collected along with sera. Comparisons were made against age-matched wild-type and non-treated mdx controls. Treated animals showed a partial normalization of the high serum levels of miR-1 (18.1–3.6-fold), miR-133a (32.3–3.8-fold), and miR-206 (65.9–10-fold) observed in the mdx mouse (Figure 5a–c). In all cases serum dystromir abundance was reduced to levels close to wild-type controls. Restoration of dystrophin protein expression by Pip6e-PMO treatment was confirmed in all muscles analysed by immunofluorescence (representative image of restoration in the TA shown in Figure 5d) and by the detection of mature dystrophin transcripts lacking exon 23, as determined by RT-PCR analysis (Figure 5e).
Figure 5.

Pip6e-phosphorodiamidate morpholino oligonucleotide (PMO) treatment normalizes serum dystromir abundance. Twelve-week-old mdx mice were injected with a single 12.5 mg/kg dose of Pip6e-PMO intravenously and harvested 2 weeks later. Serum samples were analyzed for the expression of (a) miR-1, (b) miR-133a, and (c) miR-206 by small RNA TaqMan RT-qPCR. miRNA levels were normalized to miR-223 expression and fold changes presented relative to the wild-type C57 average. (d) Representative immunofluorescence images of tibialis anterior muscle showing restoration of dystrophin at the sarcolemma in mdx mice following treatment with Pip6e-PMO. Samples were co-stained with laminin to indicate muscle fibers. (e) RT-PCR shows skipping of dystrophin exon 23 across various muscle groups. Values are mean ± SEM, n = 4, *P < 0.05.
Discussion
We have characterized differential miRNA expression between different muscle groups and serum of the mdx mouse. This study is the first to provide a complete profile by microarray analysis of miRNA expression in the mdx heart and diaphragm, tissues which are central to the dystrophic pathology and disease progression in DMD patients. The use of miRNA microarray analysis has enabled the detection of the maximum number of miRNAs possible (miRBase v15) whereas TaqMan Array Card technology is limited to 381 miRNA assays. Generally, the mdx diaphragm and heart show less differential miRNA expression, both in number of differentially expressed miRNAs and in the magnitude of fold changes, reflecting a lower level of degeneration in the diaphragm and heart in mice of this age. This is consistent with what is already known about the natural history of disease progression.36 In addition, by assaying different tissues from the same animals we have shown that there are important differences between the skeletal muscle groups themselves. In general, quadriceps, TA and triceps muscles show similar levels of differential dystromir expression. However, significant changes in the expression of miR-146b and miR-199a-3p were not observed in all tissues. (Figure 2g,h and Supplementary Table S3). Differential expression between tissues is one explanation for contradictions between previous reports. For example, differential expression of miR-146b has been reported by some investigators31 but not others30 (Supplementary Table S1). One of the first studies of miRNA expression (also in the 8-week-old mdx mouse) showed that miR-206 expression was increased in the mdx diaphragm but not in the soleus or plantaris muscles.37 The reported 4.5-fold increase in miR-206 expression in diaphragm is closely matched by our study (4.7-fold increase). However, the previous study suggested that miR-206 was upregulated in diaphragm but not in hindlimb on account of the diaphragm being the most severely affected mdx muscle. Our results do not support this conclusion as we have detected increased miR-206 expression in two hindlimb mdx muscles (TA and quadriceps) and in the mdx forelimb (triceps). In all of these cases the increase in miR-206 expression is moderately higher than in the diaphragm. To reconcile the differences between these studies we note that the study by McCarthy et al. utilized semiquantitative PCR and image quantification from PAGE gels, which is a much less quantitative and sensitive methodology than small RNA TaqMan RT-qPCR. Alternatively, a lack of increase in miR-206 expression in the mdx soleus and plantaris may represent further complexity in the mdx muscle transcriptome.
The most differentially expressed miRNA of all array datasets was miR-31 (~70-fold increase). This is consistent with the study by Greco et al. which showed similar magnitude fold change in the adductor muscles of mice of the same age and in DMD patient biopsies (from the quadriceps femoris).30 Interestingly, Eisenberg et al. did not report miR-31 as being differentially expressed in a microarray study of patients with diverse muscle disorders (including DMD and Becker muscular dystrophy)31 (Supplementary Table S1). We have observed high levels of miR-31 across all of the skeletal muscles studied. This is encouraging as antagonism of miR-31 activity has recently been proposed as a synergistic therapeutic strategy to exon-skipping-mediated dystrophin restoration.38
Our results are consistent with those reported by Yuasa et al. who profiled miR-1, miR-133, and miR-206 in the TA muscle of mdx mice and the CXMDJ dystrophic dog model.39 Similarly, two recent studies have identified miR-486 as downregulated in mdx skeletal muscle.28,40 We have confirmed this result as miR-486 expression was reduced 1.3-fold (P = 0.0002) in the mdx quadriceps dataset only. miR-486 is encoded within the ankyrin gene and has been shown to regulate components of the PTEN/AKT pathway and in doing so influences cell cycle kinetics.40
In general, microarray and RT-qPCR validation data were in close agreement. Those minor differences observed between the miRNA microarray and RT-qPCR data are likely to be due to the increased sensitivity of the RT-qPCR assays, and to the high FDR in the heart array dataset. Methodological differences may be one reason for some of the variations in dystromir expression reported previously.30,31,37 We have calculated PCR efficiencies for all of the TaqMan assays used in this study by performing standard curves on serial dilutions of cDNA (Supplementary Figure S1a–k and Supplementary Table S7). Importantly, in all cases the PCR efficiencies were <100%. We therefore utilized the Pfaffl method41 (which corrects for suboptimal PCR efficiencies) to calculate relative changes in gene expression as opposed to the Livak (ΔΔCt) method42 (which assumes 100% PCR efficiency). Not correcting for PCR efficiency results in an overestimation of the differences between samples and underlines the importance of validating assays used in studies of gene expression.
Multiple lines of evidence point to transcriptional upregulation of dystromirs in the mdx mouse. Firstly, mature miRNAs that are derived from the same primary transcript are concordantly differentially expressed. Secondly, increases in the pre-miRNA hairpins are detected in the case of miR-31 and miR-34c, and lastly, pri-miRNA levels are increased for miR-31, -34c, and -206. A previous report has shown that epigenetic silencing is responsible for changes in the expression of certain miRNAs in the mdx mouse as a result of impaired nitric oxide signalling and consequent HDAC2 activation.43 It remains to be seen if a similar mechanism is operative for the dystromirs we have investigated.
Several studies have identified miR-1, miR-133a and miR-206 as being highly enriched (~50-fold) in the serum of mdx mice and DMD patients relative to controls.32,33 Intriguingly, despite the significant upregulation of these miRNAs in serum, this pattern of expression is not reciprocated in skeletal muscles (i.e., miR-206 is only increased ~4–10-fold and miR-1 and miR-133a are generally decreased or not significantly changed in the skeletal muscles but all three miRNAs are ~50-fold increased in serum). Similarly, the patterns of expression of other dystromirs did not generally correlate between the muscles and serum. This incongruence between the miRNA expression profile of muscle and serum suggests that mdx-enriched extracellular miRNAs do not simply “leak” from damaged muscle due to impaired sarcolemmal integrity; otherwise the serum profile would be expected to reflect the muscle profile. The nonrandom distribution of extracellular miRNAs suggests that they may constitute a specific biological response. We speculate that miR-1, miR-133a, and miR-206 are actively released from dystrophic muscle and are protected from RNase-mediated degradation by either encapsulation in microvesicles44 or in complex with proteins such as Argonate-2.45 We speculate that these extracellular miRNAs function to drive muscle regeneration in response to muscle damage or to the dystrophic condition through cell-to-cell communication.
We have shown that systemic administration of a single dose of an antisense oligonucleotide-mediated exon skipping therapy resulted in partial normalization of the circulating dystromirs that are highly enriched in mdx serum. This is consistent with a previous report that utilized a virus-mediated exon skipping strategy. The same study also showed that patients with the less severe Becker muscular dystrophy showed intermediate levels of serum dystromirs between DMD and healthy individuals.32 These serum dystromirs show promise as disease biomarkers that could be used to non-invasively monitor the effectiveness of experimental therapies in DMD patients. Currently, serum creatine kinase (CK) is used as a biomarker for muscle damage. In contrast to CK, serum miRNAs have been shown to change little in response to exercise33 and correlate better with disease severity.32 A possible limitation of this approach is that the levels of serum dystromirs in dystrophic mice and DMD patients are highly variable, as we have observed here and in a previous study.32 This variability may mean it is difficult to detect changes in serum miRNA levels due to minor improvements in therapeutic outcomes.
This study has demonstrated muscle-specific changes in miRNA expression and indicates that methodological differences are a plausible explanation for the contradictions between previous miRNA investigations in the mdx mouse and DMD patients. The observation that the miRNA expression varies between tissues (even between skeletal muscles) is indicative of differential pathological processes occurring between these tissues. This unexpected level of complexity will need to be considered with regards to the development of novel miRNA-based therapies for treating DMD and the use of serum biomarkers for monitoring the efficacy of experimental treatments.
Materials and Methods
Sample preparation. All animal experiments were carried out in the Biomedical Sciences Unit, University of Oxford in accordance to procedures authorized by the UK Home Office. Male C57/B10 and mdx mice (n = 4) were sacrificed at eight weeks of age. Whole blood was extracted using Microvette CB300 capillary serum collection tubes (Sarstedt, Leicester, UK) and dissection was performed immediately after. The heart, quadriceps femoris, TA, diaphragm and triceps were dissected and snap frozen in liquid nitrogen-cooled isopentane. Samples were homogenized using Precellys 24 (Bertin Technologies, Paris, France) and RNA extracted using TRIzol reagent (Invitrogen, Paisley, UK) as according to manufacturer's instructions. Genomic DNA was removed by treatment with TURBO DNA-free (Ambion, Warrington, UK) where appropriate. To extract total RNA from serum whole blood samples were placed at 4 °C for 2 hours and then centrifuged at 13,000 rpm for 5 minutes in a bench top microcentrifuge. The serum supernatant was retained and stored at –80 °C until ready for use. Total RNA was extracted from serum using TRIzol LS reagent (Invitrogen) as according to manufacturer's instructions. RNase-free glycogen (Roche, San Francisco, CA) was used as carrier to improve extraction efficiency.
Pip6e peptide (Ac-RXRRBRRXYRFLIRXRBRXRB-OH, with X = aminohexanoyl, B = β-alanine) was synthesized by standard Fmoc chemistry and purified by reverse-phase high-performance liquid chromatography. The PMO (5′-GGCCAAACCTCGGCTTACCTGAAAT) was purchased from Gene Tools LLC (Philomath, OR). Pip6e was then conjugated to the PMO through an amide linkage at the 3′ end of the PMO, followed by purification by cation exchange high-performance liquid chromatography, desalted and analyzed by MALDI-TOF MS as described elsewhere (C. Betts, A.F. Saleh, A.A. Arzumanov, S.M. Hammond, C. Godfrey, T. Coursindel et al. related manuscript). Pip6e-PMO was dissolved in sterile water and filtered through a 0.22-µm cellulose acetate membrane before use. Pip6e-PMO conjugate was prepared in sterile saline for intravenous injection (in a total volume of 160 µl). Under isoflurane anesthesia, 12.5 mg/kg of Pip6e-PMO was administered via the tail vein of 12-week-old male mdx mice (n = 4).
miRNA microarray analysis. Implementation and analysis of miRNA microarray experiments were designed to comply with the minimum information about a microarray experiment (MIAME) guidelines.46 Each RNA sample was analyzed using the Agilent 2100 Bioanalyzer (Agilent Technologies, Wokingham, UK) to assess RNA quality. One microgram of total RNA was run for each of the 24 samples on Affymetrix GeneChip miRNA 2.0 arrays (Affymetrix, Santa Clara, CA) (based on miRBase v15). Labeling and hybridization were performed according to standard Affymetrix protocols at the Affymetrix Core facility BEA, Bioinformatics and Expression Analysis, at Novum, Huddinge, Sweden. The processing and data analyses were performed in Affymetrix miRNA QCTool as well as in DNA-Chip Analyzer (dChip) and Excel. The analysis was done according to the following workflow; BC-CG background adjustment, Quantile normalization and Median Polish summarization. Since the miRNA 2.0 array covers 131 organisms we sorted out Mus musculus transcripts only. Group comparisons were performed in dChip software (www.dchip.org). The criterion for differentially expressed transcripts was set to P < 0.05 (unpaired, two-tailed t-test). For each comparison, transcripts with false detection signals in at least three of four replicates were removed. FDR estimations were performed by calculating q values (q value R package) from the P value lists. The q value of a test measures the proportion of false positives incurred when calling that test significant. Array data were curated so as to remove ambiguous probe sets and “dead” miRNAs. The array data discussed in this publication have been deposited in the NCBI Gene Expression Omnibus47 and are accessible through GEO Series accession number GSE36257 (http://www.ncbi.nlm.nih.gov/geo/query/acc.cgi?acc=GSE36257).
Reverse transcriptase-quantitative PCR. In order to validate the array results reverse transcriptase-quantitative PCR (RT-qPCR) was performed using Small RNA TaqMan Assays (Applied Biosystems) as according to manufacturer's instructions. All RT-qPCR studies were designed to comply with the MIQE guidelines where applicable or practical.48,49 Briefly, 5 ng of total RNA was reverse transcribed using the TaqMan miRNA Reverse Transcription Kit (Applied Biosystems) using miRNA-specific stem-loop RT primers as according to manufacturer's instructions. For primary-miRNA assays, RNA samples were treated to remove genomic DNA using the Ambion TURBO DNase-free kit as according to manufacturer's instructions. 500 ng of DNase-treated total RNA were reverse transcribed using the High-Capacity cDNA Synthesis Kit (Applied Biosystems) as according to manufacturer's instructions. qPCR analysis was performed on a StepOne Plus real-time thermocycler (Applied Biosystems) and TaqMan Gene Expression Mastermix (Applied Biosystems). Universal cycling conditions were used (95°C for 10 minutes (hotstart) and then 40 cycles of 95 °C for 15 seconds, 60 °C for 1 minute). For small RNA assays 1.33 µl of RT reaction were used in each qPCR. For primary-miRNA assays 2 µl of RT reaction were used for each qPCR. All primer/probe assays are listed in Supplementary Table S8. For mature miRNA assays data were analyzed using the Pfaffl method.41 Gene-of-interest expression was normalized to miR-16 expression for tissue samples and miR-223 expression for serum samples as this miRNA has previously been used as a reference miRNA in a study of serum dystromirs in DMD patients.32 miR-223 expression was highly stable across all experimental samples (mean Ct = 25.47, SD = 0.28). For primary-miRNA assays data were analyzed using relative standard curve method and gene-of-interest expression normalized to PpiB expression.
Reverse transcriptase-PCR. In order to assess the degree of exon skipping in treated mdx muscles, 400 ng of total RNA was used as a template in a 50 µl RT-PCR using the GeneAmp RNA PCR kit (Applied Biosystems). RT-PCR of the dystrophin transcript was performed under the following conditions; 95 °C for 20 seconds, 58 °C for 60 seconds and 72 °C for 120 seconds for 30 cycles using the following primers: DysEx20Fo (5′–CAGAATTCTGCCAATTGCTGAG) and DysEx26Ro (5′–TTCTTCAGCTTGTGTCATCC). 2 µl of this reaction was used as a template for nested amplification using Amplitaq Gold (Applied Biosystems) under the following conditions; 95 °C for 20 seconds, 58 °C for 60 seconds, and 72 °C for 120 seconds for 22 cycles using the following primers: DysEx20Fi (5′–CCCAGTCTACCACCCTATCAGAGC) and DysEx26Ri (5′–CCTGCCTTTAAGGCTTCCTT). PCR products were analyzed on 2% agarose gels.
Immunohistochemistry. Transverse sections of TA muscle (8 µm) were collected onto superfrost slides (VWR, Leicestershire, UK). Slides were air dried and soaked in phosphate-buffered saline for 10 minutes before being incubated in 20% fetal bovine serum and 20% normal goat serum for 2 hours. A simultaneous staining protocol was then performed with primary antibodies against dystrophin (rabbit polyclonal antibody, Abcam ab15277) and Laminin α-2 chain (rat monoclonal antibody, Sigma L0663) (20% normal goat serum; 2 hours) and secondary antibodies Alexa Fluor 488 (goat anti-rat IgG) and Alexa Fluor 594 (goat anti-rabbit IgG) (1 hour). Slides were mounted with Vectashield Hard Set mounting medium (with DAPI) (Vector Laboratories, Peterborough, UK). All dilutions and washes were performed with phosphate-buffered saline and incubations were performed at room temperature. Images were viewed by epifluorescence using a Leica DM IRB microscope and digitally captured using Axiovision software (Carl Zeiss Microimaging, Jena, Germany). Treated muscle sections were compared to samples from untreated age- and sex-matched mdx and C57BL10 mice (n = 4).
Statistics. Individual comparisons between disease and wild-type samples were tested for statistical significance using a two-tailed Student's t-test. For comparisons of more than two groups one-way analysis of variance and Bonferroni correction post hoc test were performed using GraphPad Prism 5 (GraphPad Software, La Jolla, CA). Differences were considered significant at P values <0.05.
Acknowledgments
This work was supported by the Muscular Dystrophy Campaign grant to M.J.A.W. and a Swedish Science Council grant to C.I.E.S. T.C.R. is supported by a Medical Research Council (MRC) UK doctoral training award. S.E.A. is supported by a postdoctoral research fellowship from the Swedish Society of Medical Research (SSMF). K.E.M.B. is supported by a grant for the collaboration between Karolinska Institutet and Södertörn University. Work in the laboratory of M.J.G. was supported by the Medical Research Council (MRC programme number U105178803). T.C. is supported by a grant from Assocation Française contre les Myopathies (programme number 14784). We thank the Affymetrix Core facility BEA, Bioinformatics and Expression Analysis, at Novum, Huddinge, Sweden. We especially thank David Brodin and Marika Rönnholm for their expertise. The authors declared no conflict of interest.
Supplementary Material
Graphs of standard curves for PCR efficiency calculations for: (a) miR-1, (b) miR-16, (c) miR-21, (d) miR-29c, (e) miR-31, (f) miR-34c, (g) miR-133a, (h) miR-146b, (i) miR-199a-3p (j) miR-206, (k) miR-221, and (l) miR-223.
Summary of published DMD-related miRNA profiling papers.
Table of fold changes, P values and q values for differentially expressed miRNAs common to mdx quadriceps, diaphragm and heart as measured by miRNA microarray.
Summary of fold changes for all dystromir mdx versus wild-type comparisons as measured by small RNA TaqMan RT-qPCR.
Validation of miRNA microarray by small RNA TaqMan RT-qPCR.
Concordantly changed mature dystromirs derived from common primary-miRNA transcripts in mdx quadriceps, diaphragm, and heart.
Concordantly changed mature miRNAs derived from common miRNA clusters in mdx quadriceps, diaphragm, and heart.
PCR efficiency determinations for RT-qPCR assays used in this study.
List of RT-qPCR assays used in this study.
References
- Hoffman EP, Brown RH., Jr, and, Kunkel LM. Dystrophin: the protein product of the Duchenne muscular dystrophy locus. Cell. 1987;51:919–928. doi: 10.1016/0092-8674(87)90579-4. [DOI] [PubMed] [Google Scholar]
- Monaco AP, Bertelson CJ, Liechti-Gallati S, Moser H., and, Kunkel LM. An explanation for the phenotypic differences between patients bearing partial deletions of the DMD locus. Genomics. 1988;2:90–95. doi: 10.1016/0888-7543(88)90113-9. [DOI] [PubMed] [Google Scholar]
- Brenman JE, Chao DS, Xia H, Aldape K., and, Bredt DS. Nitric oxide synthase complexed with dystrophin and absent from skeletal muscle sarcolemma in Duchenne muscular dystrophy. Cell. 1995;82:743–752. doi: 10.1016/0092-8674(95)90471-9. [DOI] [PubMed] [Google Scholar]
- Sander M, Chavoshan B, Harris SA, Iannaccone ST, Stull JT, Thomas GD.et al. (2000Functional muscle ischemia in neuronal nitric oxide synthase-deficient skeletal muscle of children with Duchenne muscular dystrophy Proc Natl Acad Sci USA 9713818–13823. [DOI] [PMC free article] [PubMed] [Google Scholar]
- Deconinck N., and, Dan B. Pathophysiology of duchenne muscular dystrophy: current hypotheses. Pediatr Neurol. 2007;36:1–7. doi: 10.1016/j.pediatrneurol.2006.09.016. [DOI] [PubMed] [Google Scholar]
- Ervasti JM, Ohlendieck K, Kahl SD, Gaver MG., and, Campbell KP. Deficiency of a glycoprotein component of the dystrophin complex in dystrophic muscle. Nature. 1990;345:315–319. doi: 10.1038/345315a0. [DOI] [PubMed] [Google Scholar]
- Petrof BJ. The molecular basis of activity-induced muscle injury in Duchenne muscular dystrophy. Mol Cell Biochem. 1998;179:111–123. doi: 10.1023/a:1006812004945. [DOI] [PubMed] [Google Scholar]
- Morandi L, Mora M, Gussoni E, Tedeschi S., and, Cornelio F. Dystrophin analysis in Duchenne and Becker muscular dystrophy carriers: correlation with intracellular calcium and albumin. Ann Neurol. 1990;28:674–679. doi: 10.1002/ana.410280512. [DOI] [PubMed] [Google Scholar]
- Bodensteiner JB., and, Engel AG. Intracellular calcium accumulation in Duchenne dystrophy and other myopathies: a study of 567,000 muscle fibers in 114 biopsies. Neurology. 1978;28:439–446. doi: 10.1212/wnl.28.5.439. [DOI] [PubMed] [Google Scholar]
- Imbert N, Vandebrouck C, Duport G, Raymond G, Hassoni AA, Constantin B.et al. (2001Calcium currents and transients in co-cultured contracting normal and Duchenne muscular dystrophy human myotubes J Physiol (Lond) 534Pt. 2343–355. [DOI] [PMC free article] [PubMed] [Google Scholar]
- Arthur PG, Grounds MD., and, Shavlakadze T. Oxidative stress as a therapeutic target during muscle wasting: considering the complex interactions. Curr Opin Clin Nutr Metab Care. 2008;11:408–416. doi: 10.1097/MCO.0b013e328302f3fe. [DOI] [PubMed] [Google Scholar]
- Heslop L, Morgan JE., and, Partridge TA. Evidence for a myogenic stem cell that is exhausted in dystrophic muscle. J Cell Sci. 2000;113 (Pt 12):2299–2308. doi: 10.1242/jcs.113.12.2299. [DOI] [PubMed] [Google Scholar]
- Spencer MJ, Montecino-Rodriguez E, Dorshkind K., and, Tidball JG. Helper (CD4(+)) and cytotoxic (CD8(+)) T cells promote the pathology of dystrophin-deficient muscle. Clin Immunol. 2001;98:235–243. doi: 10.1006/clim.2000.4966. [DOI] [PubMed] [Google Scholar]
- Filipowicz W, Jaskiewicz L, Kolb FA., and, Pillai RS. Post-transcriptional gene silencing by siRNAs and miRNAs. Curr Opin Struct Biol. 2005;15:331–341. doi: 10.1016/j.sbi.2005.05.006. [DOI] [PubMed] [Google Scholar]
- Olsen PH., and, Ambros V. The lin-4 regulatory RNA controls developmental timing in Caenorhabditis elegans by blocking LIN-14 protein synthesis after the initiation of translation. Dev Biol. 1999;216:671–680. doi: 10.1006/dbio.1999.9523. [DOI] [PubMed] [Google Scholar]
- Doench JG., and, Sharp PA. Specificity of microRNA target selection in translational repression. Genes Dev. 2004;18:504–511. doi: 10.1101/gad.1184404. [DOI] [PMC free article] [PubMed] [Google Scholar]
- Ohler U, Yekta S, Lim LP, Bartel DP., and, Burge CB. Patterns of flanking sequence conservation and a characteristic upstream motif for microRNA gene identification. RNA. 2004;10:1309–1322. doi: 10.1261/rna.5206304. [DOI] [PMC free article] [PubMed] [Google Scholar]
- Friedman RC, Farh KK, Burge CB., and, Bartel DP. Most mammalian mRNAs are conserved targets of microRNAs. Genome Res. 2009;19:92–105. doi: 10.1101/gr.082701.108. [DOI] [PMC free article] [PubMed] [Google Scholar]
- Grimson A, Farh KK, Johnston WK, Garrett-Engele P, Lim LP., and, Bartel DP. MicroRNA targeting specificity in mammals: determinants beyond seed pairing. Mol Cell. 2007;27:91–105. doi: 10.1016/j.molcel.2007.06.017. [DOI] [PMC free article] [PubMed] [Google Scholar]
- Lagos-Quintana M, Rauhut R, Yalcin A, Meyer J, Lendeckel W., and, Tuschl T. Identification of tissue-specific microRNAs from mouse. Curr Biol. 2002;12:735–739. doi: 10.1016/s0960-9822(02)00809-6. [DOI] [PubMed] [Google Scholar]
- Chen JF, Mandel EM, Thomson JM, Wu Q, Callis TE, Hammond SM.et al. (2006The role of microRNA-1 and microRNA-133 in skeletal muscle proliferation and differentiation Nat Genet 38228–233. [DOI] [PMC free article] [PubMed] [Google Scholar]
- Kim HK, Lee YS, Sivaprasad U, Malhotra A., and, Dutta A. Muscle-specific microRNA miR-206 promotes muscle differentiation. J Cell Biol. 2006;174:677–687. doi: 10.1083/jcb.200603008. [DOI] [PMC free article] [PubMed] [Google Scholar]
- Rao PK, Kumar RM, Farkhondeh M, Baskerville S., and, Lodish HF. Myogenic factors that regulate expression of muscle-specific microRNAs. Proc Natl Acad Sci USA. 2006;103:8721–8726. doi: 10.1073/pnas.0602831103. [DOI] [PMC free article] [PubMed] [Google Scholar]
- Liu N, Williams AH, Kim Y, McAnally J, Bezprozvannaya S, Sutherland LB.et al. (2007An intragenic MEF2-dependent enhancer directs muscle-specific expression of microRNAs 1 and 133 Proc Natl Acad Sci USA 10420844–20849. [DOI] [PMC free article] [PubMed] [Google Scholar]
- Sweetman D, Goljanek K, Rathjen T, Oustanina S, Braun T, Dalmay T.et al. (2008Specific requirements of MRFs for the expression of muscle specific microRNAs, miR-1, miR-206 and miR-133 Dev Biol 321491–499. [DOI] [PubMed] [Google Scholar]
- Wong CF., and, Tellam RL. MicroRNA-26a targets the histone methyltransferase Enhancer of Zeste homolog 2 during myogenesis. J Biol Chem. 2008;283:9836–9843. doi: 10.1074/jbc.M709614200. [DOI] [PubMed] [Google Scholar]
- Naguibneva I, Ameyar-Zazoua M, Polesskaya A, Ait-Si-Ali S, Groisman R, Souidi M.et al. (2006The microRNA miR-181 targets the homeobox protein Hox-A11 during mammalian myoblast differentiation Nat Cell Biol 8278–284. [DOI] [PubMed] [Google Scholar]
- Small EM, O'Rourke JR, Moresi V, Sutherland LB, McAnally J, Gerard RD.et al. (2010Regulation of PI3-kinase/Akt signaling by muscle-enriched microRNA-486 Proc Natl Acad Sci USA 1074218–4223. [DOI] [PMC free article] [PubMed] [Google Scholar]
- Calin GA., and, Croce CM. MicroRNA signatures in human cancers. Nat Rev Cancer. 2006;6:857–866. doi: 10.1038/nrc1997. [DOI] [PubMed] [Google Scholar]
- Greco S, De Simone M, Colussi C, Zaccagnini G, Fasanaro P, Pescatori M.et al. (2009Common micro-RNA signature in skeletal muscle damage and regeneration induced by Duchenne muscular dystrophy and acute ischemia FASEB J 233335–3346. [DOI] [PubMed] [Google Scholar]
- Eisenberg I, Eran A, Nishino I, Moggio M, Lamperti C, Amato AA.et al. (2007Distinctive patterns of microRNA expression in primary muscular disorders Proc Natl Acad Sci USA 10417016–17021. [DOI] [PMC free article] [PubMed] [Google Scholar]
- Cacchiarelli D, Legnini I, Martone J, Cazzella V, D'Amico A, Bertini E.et al. (2011miRNAs as serum biomarkers for Duchenne muscular dystrophy EMBO Mol Med 3258–265. [DOI] [PMC free article] [PubMed] [Google Scholar]
- Mizuno H, Nakamura A, Aoki Y, Ito N, Kishi S, Yamamoto K.et al. (2011Identification of muscle-specific microRNAs in serum of muscular dystrophy animal models: promising novel blood-based markers for muscular dystrophy PLoS ONE 6e18388. [DOI] [PMC free article] [PubMed] [Google Scholar]
- Megraw M, Sethupathy P, Corda B., and, Hatzigeorgiou AG. miRGen: a database for the study of animal microRNA genomic organization and function. Nucleic Acids Res. 2007;35 Database issue:D149–D155. doi: 10.1093/nar/gkl904. [DOI] [PMC free article] [PubMed] [Google Scholar]
- Yin H, Saleh AF, Betts C, Camelliti P, Seow Y, Ashraf S.et al. (2011Pip5 transduction peptides direct high efficiency oligonucleotide-mediated dystrophin exon skipping in heart and phenotypic correction in mdx mice Mol Ther 191295–1303. [DOI] [PMC free article] [PubMed] [Google Scholar]
- Stedman HH, Sweeney HL, Shrager JB, Maguire HC, Panettieri RA, Petrof B.et al. (1991The mdx mouse diaphragm reproduces the degenerative changes of Duchenne muscular dystrophy Nature 352536–539. [DOI] [PubMed] [Google Scholar]
- McCarthy JJ, Esser KA., and, Andrade FH. MicroRNA-206 is overexpressed in the diaphragm but not the hindlimb muscle of mdx mouse. Am J Physiol, Cell Physiol. 2007;293:C451–C457. doi: 10.1152/ajpcell.00077.2007. [DOI] [PubMed] [Google Scholar]
- Cacchiarelli D, Incitti T, Martone J, Cesana M, Cazzella V, Santini T.et al. (2011miR-31 modulates dystrophin expression: new implications for Duchenne muscular dystrophy therapy EMBO Rep 12136–141. [DOI] [PMC free article] [PubMed] [Google Scholar]
- Yuasa K, Hagiwara Y, Ando M, Nakamura A, Takeda S., and, Hijikata T. MicroRNA-206 is highly expressed in newly formed muscle fibers: implications regarding potential for muscle regeneration and maturation in muscular dystrophy. Cell Struct Funct. 2008;33:163–169. doi: 10.1247/csf.08022. [DOI] [PubMed] [Google Scholar]
- Alexander MS, Casar JC, Motohashi N, Myers JA, Eisenberg I, Gonzalez RT.et al. (2011Regulation of DMD pathology by an ankyrin-encoded miRNA Skelet Muscle 127. [DOI] [PMC free article] [PubMed] [Google Scholar]
- Pfaffl MW. A new mathematical model for relative quantification in real-time RT-PCR. Nucleic Acids Res. 2001;29:e45. doi: 10.1093/nar/29.9.e45. [DOI] [PMC free article] [PubMed] [Google Scholar]
- Livak KJ., and, Schmittgen TD. Analysis of relative gene expression data using real-time quantitative PCR and the 2(-Delta Delta C(T)) Method. Methods. 2001;25:402–408. doi: 10.1006/meth.2001.1262. [DOI] [PubMed] [Google Scholar]
- Cacchiarelli D, Martone J, Girardi E, Cesana M, Incitti T, Morlando M.et al. (2010MicroRNAs involved in molecular circuitries relevant for the Duchenne muscular dystrophy pathogenesis are controlled by the dystrophin/nNOS pathway Cell Metab 12341–351. [DOI] [PubMed] [Google Scholar]
- Hunter MP, Ismail N, Zhang X, Aguda BD, Lee EJ, Yu L.et al. (2008Detection of microRNA expression in human peripheral blood microvesicles PLoS ONE 3e3694. [DOI] [PMC free article] [PubMed] [Google Scholar]
- Arroyo JD, Chevillet JR, Kroh EM, Ruf IK, Pritchard CC, Gibson DF.et al. (2011Argonaute2 complexes carry a population of circulating microRNAs independent of vesicles in human plasma Proc Natl Acad Sci USA 1085003–5008. [DOI] [PMC free article] [PubMed] [Google Scholar]
- Brazma A, Hingamp P, Quackenbush J, Sherlock G, Spellman P, Stoeckert C.et al. (2001Minimum information about a microarray experiment (MIAME)-toward standards for microarray data Nat Genet 29365–371. [DOI] [PubMed] [Google Scholar]
- Edgar R, Domrachev M., and, Lash AE. Gene Expression Omnibus: NCBI gene expression and hybridization array data repository. Nucleic Acids Res. 2002;30:207–210. doi: 10.1093/nar/30.1.207. [DOI] [PMC free article] [PubMed] [Google Scholar]
- Bustin SA, Benes V, Garson JA, Hellemans J, Huggett J, Kubista M.et al. (2009The MIQE guidelines: minimum information for publication of quantitative real-time PCR experiments Clin Chem 55611–622. [DOI] [PubMed] [Google Scholar]
- Taylor S, Wakem M, Dijkman G, Alsarraj M., and, Nguyen M. A practical approach to RT-qPCR-Publishing data that conform to the MIQE guidelines. Methods. 2010;50:S1–S5. doi: 10.1016/j.ymeth.2010.01.005. [DOI] [PubMed] [Google Scholar]
- Ardite E, Perdiguero E, Vidal B, Gutarra S, Serrano AL., and, Muñoz-Cánoves P. PAI-1-regulated miR-21 defines a novel age-associated fibrogenic pathway in muscular dystrophy. J Cell Biol. 2012;196:163–175. doi: 10.1083/jcb.201105013. [DOI] [PMC free article] [PubMed] [Google Scholar]
- van Rooij E, Sutherland LB, Thatcher JE, DiMaio JM, Naseem RH, Marshall WS.et al. (2008Dysregulation of microRNAs after myocardial infarction reveals a role of miR-29 in cardiac fibrosis Proc Natl Acad Sci USA 10513027–13032. [DOI] [PMC free article] [PubMed] [Google Scholar]
- Corney DC, Flesken-Nikitin A, Godwin AK, Wang W., and, Nikitin AY. MicroRNA-34b and MicroRNA-34c are targets of p53 and cooperate in control of cell proliferation and adhesion-independent growth. Cancer Res. 2007;67:8433–8438. doi: 10.1158/0008-5472.CAN-07-1585. [DOI] [PubMed] [Google Scholar]
- Kuang W, Tan J, Duan Y, Duan J, Wang W, Jin F.et al. (2009Cyclic stretch induced miR-146a upregulation delays C2C12 myogenic differentiation through inhibition of Numb Biochem Biophys Res Commun 378259–263. [DOI] [PubMed] [Google Scholar]
- Cardinali B, Castellani L, Fasanaro P, Basso A, Alemà S, Martelli F.et al. (2009Microrna-221 and microrna-222 modulate differentiation and maturation of skeletal muscle cells PLoS ONE 4e7607. [DOI] [PMC free article] [PubMed] [Google Scholar]
- Johnnidis JB, Harris MH, Wheeler RT, Stehling-Sun S, Lam MH, Kirak O.et al. (2008Regulation of progenitor cell proliferation and granulocyte function by microRNA-223 Nature 4511125–1129. [DOI] [PubMed] [Google Scholar]
Associated Data
This section collects any data citations, data availability statements, or supplementary materials included in this article.
Supplementary Materials
Graphs of standard curves for PCR efficiency calculations for: (a) miR-1, (b) miR-16, (c) miR-21, (d) miR-29c, (e) miR-31, (f) miR-34c, (g) miR-133a, (h) miR-146b, (i) miR-199a-3p (j) miR-206, (k) miR-221, and (l) miR-223.
Summary of published DMD-related miRNA profiling papers.
Table of fold changes, P values and q values for differentially expressed miRNAs common to mdx quadriceps, diaphragm and heart as measured by miRNA microarray.
Summary of fold changes for all dystromir mdx versus wild-type comparisons as measured by small RNA TaqMan RT-qPCR.
Validation of miRNA microarray by small RNA TaqMan RT-qPCR.
Concordantly changed mature dystromirs derived from common primary-miRNA transcripts in mdx quadriceps, diaphragm, and heart.
Concordantly changed mature miRNAs derived from common miRNA clusters in mdx quadriceps, diaphragm, and heart.
PCR efficiency determinations for RT-qPCR assays used in this study.
List of RT-qPCR assays used in this study.