

Abstract
The retina reports the visual scene to the brain through many parallel channels, each carried by a distinct population of retinal ganglion cells. Among these, the population with the smallest and densest receptive fields encodes the neural image with highest resolution. In human retina, and those of cat and macaque, these high-resolution ganglion cells act as generic pixel encoders: They serve to represent many different visual inputs and convey a neural image of the scene downstream for further processing. Here we identify and analyze high-resolution ganglion cells in the mouse retina, using a transgenic line in which these cells, called “W3”, are labeled fluorescently. Counter to the expectation, these ganglion cells do not participate in encoding generic visual scenes, but remain silent during most common visual stimuli. A detailed study of their response properties showed that W3 cells pool rectified excitation from both On and Off bipolar cells, which makes them sensitive to local motion. However, they also receive unusually strong lateral inhibition, both pre- and postsynaptically, triggered by distant motion. As a result, the W3 cell can detect small moving objects down to the receptive field size of bipolar cells, but only if the background is featureless or stationary—an unusual condition. A survey of naturalistic stimuli shows that W3 cells may serve as alarm neurons for overhead predators.
Keywords: electrophysiology, vision, neural processing, density recovery profile
What does the retina do for the visual system? Two very different answers have been proposed. In one account, the retina’s purpose is to quickly transmit the pixels of the visual image to the brain. There, a vastly greater number of neurons and circuits analyze the image for the visual features important to specific behavioral tasks. From this perspective, image processing within the retina is limited to some gentle filtering and gain-control mechanisms that deal with a great range of light intensities, all for the purpose of enabling efficient transmission of the image through the optic nerve.
In a contrasting account, the retina already extracts the specific information needed for certain visual behaviors and transmits a highly processed feature set on which the brain can act more directly. This account might explain why the retina’s output includes more than 20 different types of retinal ganglion cells (1, 2). Each of these populations tiles the entire visual field (3). Vice versa, every point in the image is reported to the brain through >20 different parallel channels. Some of these ganglion cell types respond to selective visual features and drive specific central circuits. For example, of the eight groups of direction-selective retinal ganglion cells (RGCs) that encode the direction of movement of the retinal image, three project specifically to circuits involved in eye movement control (4, 5). Similarly, 4–5 types of melanopsin-expressing RGCs can signal prolonged steady light exposure; some of them drive circuits that control pupil constriction and contribute to setting the circadian clock (6).
A compromise position states that many RGC types are feature detectors, but a few serve as simple pixel encoders that transmit the raw image downstream. These types should be ganglion cell populations with high sampling density and sharp receptive fields, to provide the brain with a high-resolution image. For example, the P cells of the primate retina are by far the most numerous population and seem to have rather simple visual responses. Within the fovea—corresponding to our center of gaze—each P cell is driven by just one cone photoreceptor, the finest image resolution possible. Indeed, the acuity of human visual perception is well explained by the resolution of the P-cell array (7). Similarly, the cat retina contains a population of RGCs with small receptive fields, the beta cells, whose visual processing is relatively simple, largely comprising a linear spatial filter (8, 9).
Here we test whether this idea holds in the retina of the mouse. This species has enjoyed increasing popularity in visual neuroscience. Contrary to the propaganda spread by children’s songs, mice are hardly blind. They sport a perfectly organized retina and a visual system that includes a substantial portion of the cortex (10). Like other mammals, the mouse has ∼20 types of RGCs, several of which seem directly analogous to those of primates (2). Unlike other mammals, however, the mouse offers molecular genetic tools that make it possible to mark neurons of specific types, for visualization with fluorescent proteins or manipulation of their cellular functions. Several ganglion cell types have been marked in this way, and this labeling has greatly facilitated their directed study and the discovery of new response properties (11–18).
We exploited a line of mouse that labels the RGC type called W3 (12), which has the highest density and smallest receptive fields and therefore the highest resolution. On the basis of these properties, we expected that W3 cells would be simple pixel detectors. Instead, we found that their visual responses are highly specialized. We propose that W3 RGCs participate in encoding select visual events that may be essential to the animal’s survival.
Results
W3 Cells Represent a Natural Type of Retinal Ganglion Cells.
In the transgenic mouse line TYW3, strong regulatory elements from the Thy1 gene drive expression of yellow fluorescent protein (YFP) (12). In TYW3 retinas, YFP protein can be detected in only a small subset of RGCs (Fig. 1A and Fig. S1), possibly because the transgene has come under control of sequences near the integration site (19). These YFP-positive RGCs show a range of fluorescence intensities (Fig. S1) but one population of brightly labeled cells is clearly distinct from the others. We focused our analysis on these bright cells, and refer to them as W3-RGCs. The density of W3-RGC neurons has a peak value of 440 cells/mm2 in ventral retina with lower levels in dorsal and peripheral retina (Fig. 1B).
Fig. 1.

Morphology and distribution of the W3 cells. (A) Whole-mount image of YFP fluorescence in a region of THW3 retina (inverted contrast). Note the difference in intensity across the population of labeled somas. The W3 cells are the strongly labeled cells (Fig. S1). (B) Distribution of W3 cells across a THW3 retina. Note greater density in the ventral region. Color scale is in cells per square millimeter. (C) Vertical section of a THW3 retina immunostained to show the arborization pattern of W3-RGCs in the IPL. Green, YFP labels W3 cells; red, ChAT labels starburst amacrine cells; blue, Nissl stain of cell bodies. Note that the border between On- and Off-laminae lies halfway between the two ChAT bands (29). (D) Tangential view of a W3-RGC immunostained for YFP (inverted contrast). Note the small but dense dendritic arborization (Fig. S1). (E) Density recovery profile of the distribution of W3 cells in a 1.2 × 1.2-mm region in the central retina (histogram, error bars = SEM). Note the prominent repulsion at short distances. Dashed line: expected profile if the cells were randomly distributed. Red line: fit with a model assuming that cells are placed on a close-packed hexagonal array with spacing  and a positional jitter
  (expressed in units of
  ) and that only a fraction
  of them are labeled. (Inset) The best-fit parameters and their 95% confidence intervals.
W3-RGCs have a single thick dendritic arbor that occupies the space between the two choline acetyl transferase (ChAT)-positive bands in the inner plexiform layer (IPL) (Fig. 1C, strata 4–6 in the nomenclature of ref. 20). In addition, minor sprouts extend distally past the outer ChAT band and arborize in a thin band close to the inner nuclear layer (stratum 1, Fig. 1C). A tangential view of W3-RGCs reveals a dendritic arbor with branchings that are more dense and convoluted than those of other ganglion cell types (21). As detailed in ref. 12, the dendritic field is small in horizontal extent (Fig. 1D), covering an area of 10,300 ± 500 μm2 (n = 25), which corresponds to an average diameter of 114 μm.
Retinal ganglion cells with these morphological properties have been noted in previous surveys of the mouse retina [called “B2” in Sun et al. (21), “4” in Badea and Nathans (22), “1” in Kong et al. (23), “M11” in Coombs et al. (24), and “G5” in Völgyi et al. (2)]. In each case, they appear to represent the smallest and densest RGC type. Similarly, the diameter of the W3 dendritic arbor is substantially smaller than those of other genetically marked types (11–18). Given their dendritic field size, W3-RGCs achieve a coverage factor of ∼4.5 in the region of peak density, such that every point of the image is processed by 4–5 W3 cells on average. In this region, the W3 cells account for ∼13% of the total RGC population on the basis of previous measurements of total RGC density (25). Other mouse RGC types that have been analyzed to date each amount to <5% of the total population (11–18).
Although the high density of W3 RGCs could be taken to indicate that they sample the visual field with high resolution, another possibility is that the labeled cells comprise multiple subpopulations, each of which is present at moderate density. To distinguish between these alternatives, we made use of the fact that retinal cells of a single type are generally distributed in a “mosaic” arrangement, spaced at approximately regular distances. We inspected the arrangement of W3 cells via the density recovery profile (DRP) (26) and found a clear region of exclusion around each cell body, indicative of regular spacing (Fig. 1E). This result shows that W3 cells indeed represent a natural cell type and that they are distinct from the dimly labeled cells in the same mouse line (Fig. S1). We also developed an extension to the DRP analysis (Materials and Methods) that can test whether the labeled neurons represent the entire population or just a random labeled subset (Fig. S2). This test showed that in high-density regions at least 80% of the cells in the population are marked with YFP (Fig. 1E).
Together, these results provide strong evidence that W3-RGCs are a single cell type that represents the smallest-field and highest-density RGCs in the mouse retina. Hence one expects this population to sample the visual scene at the highest spatial resolution.
W3 Cells Remain Silent Under Most Common Visual Inputs.
To characterize the function of W3-RGCs, we recorded their electrical responses to a broad set of visual stimuli. With guidance from the fluorescent label, W3 cells were approached with patch electrodes for cell-attached recording of spikes or whole-cell recording of synaptic currents. For comparison with other types of RGCs, we also recorded from a broad sample of nonfluorescent neurons in the same retina.
If the W3 cells act as general pixel encoders, they should respond under the stimuli that an animal encounters commonly in nature. To this end we used videos recorded from a camera mounted on the head of a freely moving rat (27). The camera was aimed at the lower half of the visual field, and the video was acquired with a wireless transmitter, leaving the animal free to roam through an enclosure. Despite the size difference between rats and mice, these movies provide a good sample of visual inputs from locomotion in a natural environment. They are dominated by optic flow that results from translation and rotation of the animal (Fig. 2A). When these movies were projected onto the isolated mouse retina, using the appropriate magnification, most non-W3 ganglion cells responded vigorously (Fig. 2B). However, the W3 cells remained perfectly silent (Fig. 2B).
Fig. 2.

W3 cells do not participate in routine visual processing. (A) Single frame of a “rat-cam” movie recorded with a wireless video camera from the head of a freely moving rat. (B) Spike trains of retinal ganglion cells in the mouse retina exposed to this movie. The W3 cells remained silent, whereas other RGCs fired to various degrees. In a broader survey, three W3 cells were tested, each with the movie presented at 25 different spatial offsets, and none fired a single spike in 250 s of stimulation. (C) Response of a W3 cell to a short movie of an owl taken with a stationary camera, illustrated with four sample frames of 33 ms. The same movie was presented many times with 9 different horizontal and vertical offsets (circles in margins of frame 1), thus placing the receptive field of the recorded W3-RGC in 81 different locations within the scene. Red arrows: motion vectors depicting optic flow within the scene. Yellow dot: the location of the W3 receptive field when the cell fired an action potential. Note only 1 of the 81 locations produced a single spike in these 133 ms, despite ample amounts of motion within the scene.
These head-centered videos contain much violent image motion. Some of this motion may be alleviated by compensating eye movements—not measured here—but invariably the retina experiences a great deal of global image motion. Thus, we also considered a natural scenario in which global motion is greatly diminished: when the animal freezes, for example in the presence of a predator (28). Under these conditions the eye will be almost still, and thus retinal image motion should be greatly reduced. We obtained movies of a predator, a large bird, filmed with a stationary camera, and projected them on the mouse retina at the appropriate magnification. The W3 cells again remained almost perfectly silent. During one particular 12-s approach sequence of the predator, a total of only 74 spikes were fired by W3 cells in 81 locations covering the scene (Fig. 2C). These few spikes occurred at the edge of the moving bird’s image, but were obviously insufficient to reliably encode the presence of the predator. One is therefore left with the surprising result that the W3 cells do not participate in routine visual processing, quite unlike the small-field ganglion cells in other retinas.
W3 Cells Have On–Off Receptive Field Centers.
To understand what role the W3-RGCs might play for vision we undertook a systematic survey of their stimulus–response relationship. When presented with a small flashing spot positioned close to the soma, all W3-RGCs fired transiently when the light turned on and then again when it turned off (Fig. 3A and ref. 12). This result suggests that the W3 cell receives excitation from both On- and Off-bipolar cells, consistent with the shape of its dendritic arbor, which straddles the border between the On- and Off-sublaminae of the inner plexiform layer (29). Furthermore, the synaptic input from each of these channels must be transient and strongly rectified (Fig. 3D), such that only depolarizing transients are transmitted to the ganglion cell. Otherwise the opposing inputs from bipolars of opposite polarity would cancel. For example, this rectification may arise when the bipolar cell synapse has a very low release rate at the resting potential.
Fig. 3.

W3 cells have On–Off responses in the receptive field center. (A) Response of a sample W3-RGC to a flashing spot on the receptive field center. (Left) Stimulus display. (Center) Raster plot of eight trials. White, light on; gray, light off. (Right) Average firing rate for On and Off responses, plotted against the time from the step (arrow). (B) On–Off response of a sample W3-RGC to a moving-bar stimulus. A white bar (115 × 1,150 μm) traveled along the long axis through the receptive field center in eight different directions at 575 μm/s. Traces illustrate spike bursts at the leading and trailing edges of the bar. Polar plot shows the average spike number elicited by each direction. (C) On–Off response of W3-RGCs to a random flicker stimulus. (C, i) The stimulus was an array of bars centered on the W3 cell; each bar flickered in intensity, independent of the others. The bar length just spanned the dendritic field, to avoid excessive stimulation of the receptive field surround. (C, ii) The stimulus sequences leading to an action potential (“spike-triggered stimuli,” 0.5 s long) were subjected to a principal component analysis and plotted in the space of the first two components (47). Data are from one sample W3 cell; each point represents one spike. Note the excitatory stimuli separate into two clusters. (C, iii) Spike-triggered average stimulus, computed separately for each of the two clusters in C, ii. Intensity is plotted as a function of time (horizontal) before the spike for each of the bars in the strip (vertical). Spikes in one cluster are triggered by a dimming in the receptive field center (Left, Off response) and spikes in the other cluster by a brightening (Right, On response). (C, iv) Average time course of the two spike-triggered averages in C, iii for five W3-RGCs. Dim traces indicate spike-triggered averages from a broad population of non-W3 RGCs. Note the response kinetics in the non-W3 population are faster. (D) Diagram for circuits in the inner retina that are consistent with the observations and with known structure of the retina. This working model evolves in subsequent figures. Bipolar cells (B) of both On and Off types connect to a W3-RGC (G) by excitatory synapses (solid circles) with rectifying synaptic transmission (blue symbol).
These nonlinear On–Off responses of W3 cells already present a departure from the behavior of other small-field RGCs, such as the cat beta cells and the macaque P cells. Those cells receive excitation from bipolars of one polarity only, and the signal transfer across those synapses is largely linear, such that the ganglion cell firing rate gets modulated in both directions (30). Thus, we sought to test the generality of this rectifying behavior. When a white bar was moved through the receptive field of a W3 cell, it reliably elicited two bursts of spikes: one at the leading edge and another at the trailing edge (Fig. 3B). The strength of this response was not dependent on the direction of movement: In a sample of 12 neurons the average direction selectivity index (15) was only 0.071 ± 0.012. In a further test, we used a broad-band stimulus consisting of randomly flickering bars extending through the receptive field center (Fig. 3C). We analyzed which of these random sequences produced spikes (Materials and Methods) and found that they clearly separate into two classes, one that raises the intensity on the receptive field center and another of almost opposite waveform that decreases the intensity (Fig. 3C, iv). These two waveforms characterize the kinetics of the visual signal transmitted by the two bipolar pathways. As measured by the time to peak, these response waveforms are ∼30 ms slower than for many other ganglion cells recorded in the same retina (Fig. 3C, iv).
W3 Cells Pool over Rectified Subunits.
Another form of nonlinearity encountered in certain retinal ganglion cells involves summation of visual inputs across different regions of the receptive field. This summation is commonly studied with a contrast-reversing stimulus that adds light to one part of the receptive field, while subtracting light from another part. A neuron that sums light linearly over its receptive field will remain silent under such a stimulus (31).
We first focused on the receptive field center and presented square gratings within a circular aperture, at varying spatial frequencies and phases (Fig. 4 A–E). The coarsest gratings simply divided the receptive field into a light and a dark half (Fig. 4 A and B). Contrast reversal produced a burst of spikes regardless of the position of the boundary. This result suggests that the W3 cell combines rectified excitatory input from different regions of the receptive field, analogous to the Y cells of the cat retina (9). However, given the prominent On–Off nonlinearity of W3 cells, we wanted to confirm this result for a single bipolar cell pathway. Indeed, addition of 2-amino-4-phosphonobutyrate (APB) to the medium eliminated the On response, but the response to contrast reversal within the center remained intact (Fig. 4B, β), showing that nonlinear summation over subunits in the receptive field occurs even within the Off pathway alone.
Fig. 4.

Nonlinear spatial summation in the receptive field center. Responses of retinal ganglion cells to contrast-reversing grating stimuli are shown. (A–E) Columns report different spatial frequencies. α–δ: Rows report different RGC types or drug conditions. Each raster graph shows spikes from repeated trials. The grating contrast reverses at the beginning and middle of the graph. The corresponding stimuli are illustrated above row α. The gratings were limited to a circular mask covering the ganglion cell’s dendritic field. Note cells that respond robustly to gratings finer than the receptive field center (α−γ) perform a nonlinear spatial summation. Another non-W3 OFF cell did not respond to such gratings (δ, B–E), indicating linear spatial summation. (F) Updated circuit diagram consistent with the response of W3 cells: Many bipolars of both types within the receptive field center each provide rectified excitation to the W3 cell.
When the grating was made progressively finer, the W3 cells continued to respond on every reversal, even when the bars were only 23 μm wide (Fig. 4D, α). However, no response was detected with 11.5-μm bars (Fig. 4E, α), implying that the subunits of the receptive field that are independently rectified have a spatial extent of ∼23 μm, consistent with the dendritic fields of cone bipolar cells (32). Reversal of the 23-μm grating will thus modulate individual bipolar cells, whereas reversal of the 11.5-μm grating leaves the total input for each bipolar cell unchanged. A plausible explanation for all these observations is that the W3 cell receives rectified synaptic excitation from many On-type and Off-type bipolar cells throughout its dendritic field (Fig. 4F). In this way a change of illumination anywhere within the center—on a scale of bipolar cell receptive fields or larger—elicits a transient pulse of excitation that is not counterbalanced by loss of excitation elsewhere.
Some non-W3 ganglion cell types observed in these same experiments showed similar behavior of nonlinear summation, with a cutoff at the same bar width, presumably determined again by bipolar cells (Fig. 4, γ). By contrast, other RGCs exhibited linear summation over the whole receptive field (Fig. 4, δ) with no response to fine gratings, analogous to the X cells of the cat retina (9).
Strong Receptive Field Surround Suppresses the Center Response.
For many retinal ganglion cell types, the effect of visual stimulation near the soma is opposed by stimulation in a surrounding region. W3 cells exhibit a particularly strong form of this center-surround antagonism. With a flashing spot of increasing size (Fig. 5A) both On and Off responses first increased in magnitude (Fig. 5B) and then declined abruptly and ceased altogether. The spot size eliciting the maximal response reflects the excitatory center of the receptive field. Spots larger than this begin to encroach on the antagonistic surround region. By this measure, W3 cells have small receptive field centers, 120–160 μm in diameter, smaller than those of other ganglion cells in the mouse retina (Fig. 5C). Note that the receptive field for Off responses is systematically smaller than that for On responses. Furthermore, the inhibitory surrounds of W3 cells are unusually strong, with complete suppression of the response by spots only twofold larger than the center. By comparison, most other ganglion cell types exhibit larger centers and only partial suppression by the surround (Fig. 5C).
Fig. 5.

Strong suppression from a nonlinear surround mechanism. (A) Response of W3-RGCs to flashing spots of different radii, centered on the W3 cell. (B) Peak firing rate of the On and Off responses (as in Fig. 3A) plotted against the spot diameter. For each of 22 W3 cells the peak firing rate was normalized to the maximum and then averaged over all cells. Error bars: SEM. (C) The responses of randomly chosen non-W3 cells (gray) to the same spot size series, compared with those of the W3-RGCs. Display is as in B with an expanded spatial scale. Note that W3-RGCs have the smallest optimal spot size and strongest surround inhibition. (D) Stimulus display to produce differential motion, consisting of two gratings separated by a gray annulus, centered on the W3 cell’s receptive field. The object grating (Obj) is masked to the receptive field center, and the background grating (Bg) covers the surround. The two grating patterns can move either coherently (global motion of object and background, as encountered for example during eye movements) or separately (differential motion of object within the scene). (E) Spiking response of a W3-RGC to a periodic object motion stimulus. The object grating shifted back and forth periodically, and the background grating shifted only every other time. Note the strong suppression under global motion. (F) Synaptic conductance of the W3 cell measured under the same stimuli. Excitatory and inhibitory conductances were computed from voltage-clamp current recordings at different holding potentials (Materials and Methods). (G and H) Excitatory and inhibitory conductance during the periodic shift stimulus (F) and the effects of tetrodotoxin. The conductance responses from 14 W3 cells, each integrated over the interval from 0.1 to 0.5 s after the stimulus, were normalized to the excitatory conductance during differential motion and averaged. Plotted are the mean normalized conductances (bars = SEM). (G) Motion in the background region reduced excitation significantly (P < 0.05 by two-tailed t test). This effect was blocked entirely by TTX. (H) Motion in the background region elicited strong inhibition, which was again blocked by TTX. Very little inhibition was produced by object motion alone. (I) Updated circuit diagram consistent with the responses of W3 cells: Wide-field amacrine cells transmit spiking signals and make inhibitory connections (open circles) both on the W3 cell and on the bipolar cell terminals.
To probe the surround mechanism further, we resorted again to shifting gratings. As reported above, a fine shifting grating presented on the receptive field center elicits bursts of spikes in W3 cells on every shift (Fig. 4). We added a second shifting grating that covered the surround region (Fig. 5D). When the surround grating was moved in synchrony with the center grating, the response was completely suppressed (Fig. 5E). The same outcome was obtained at all spatial frequencies that produced a center response. Thus, the inhibitory mechanisms in the surround must perform a similar rectified summation over space and again down to the level of individual bipolar cells. Because the inhibition necessarily arrives via amacrine cells, one can conclude that amacrine cells in this population already perform a summation over rectified bipolar cell inputs, much as the W3 cells themselves (Fig. 5I). The results of spot stimulation (Fig. 5B) show that this inhibition can be driven by both the On and the Off pathways, but we do not know whether those pathways are combined in the same amacrine cell or are carried by separate populations.
Surround Suppression Relies on Pre- and Postsynaptic Inhibition from Spiking Amacrine Cells.
To study the synaptic mechanisms underlying these phenomena, we measured the membrane currents elicited in W3 cells by the same stimuli. Each stimulus was repeated at a series of membrane holding potentials (Fig. S3), and from the resulting current–voltage relationships we measured the excitatory and inhibitory membrane conductances (33). Motion of the center grating alone (differential motion) produced a strong pulse of excitation and very little inhibition (Fig. 5F). By contrast, a simultaneous shift of the surround grating (global motion) triggered a strong pulse of inhibition and also suppressed the excitatory conductance by about half (Fig. 5 F–H). These results suggest that W3 cells receive direct transient inhibition from amacrine cells triggered by motion in the receptive field surround. In addition, however, these surround signals suppress the excitatory input from bipolar cells, presumably via presynaptic inhibition at the bipolar terminal (Fig. 5I).
Remarkably, almost all these inhibitory influences seem to be mediated by spiking amacrine cells. When tetrodotoxin (TTX) (0.1–0.2 μM) was added to the bath, the postsynaptic inhibition produced by global motion disappeared almost entirely (Fig. 5H). Similarly, the presynaptic suppression of excitatory inputs was abolished; indeed the excitation under global motion returned to the levels under differential motion (Fig. 5G). Because TTX acts selectively to block action potentials, we conclude that the inhibitory inputs under these moving stimuli derive almost entirely from spiking axon-bearing amacrine cells. Presumably the active propagation along axons allows for efficient transmission from distant regions of the surround.
W3 Cells Can Detect Aerial Predators.
With this understanding of the basic visual computations performed by the W3 cell circuit, one can return to reasoning about ecological stimuli. The circuit includes an unusually effective means of suppression from the receptive field surround, and owing to the nonlinear pooling mechanism this surround is sensitive to any form of change in the image. This sensitivity explains why W3 cells remain silent during the global image flow that dominates the scene during natural locomotion (Fig. 2 A and B). However, why do they remain silent in the presence of a moving object on a stationary background (Fig. 2C)?
The circuit model derived for W3 cells (Fig. 5I) resembles that of “object motion-sensitive” (OMS) cells described previously in other retinas. These OMS ganglion cells are similarly suppressed by global motion. When presented with a large moving object, the OMS cells fire exclusively along the boundary of the object (34). Those in the interior of the object experience global motion between their center and surround regions and thus remain suppressed. However, W3 cells do not behave this way. If a moving-object grating (Fig. 5D) extends substantially beyond the receptive field center, the W3 cells all remain silent. This feature is explained by the strong surround suppression: For a neuron at the boundary of a large patterned object, half the surround region is synchronized with the center region, and that level appears sufficient to suppress all firing (Fig. 2C).
Given these observations, one is led to consider stimuli that restrict motion entirely to the receptive field center of the W3 cell and avoid driving the surround. One such condition occurs when a bird circles or approaches at some distance overhead. This action produces a small dark patch moving against a bright background. Even if the observer is in motion, the background sky is largely featureless and thus produces little or no pattern motion on the retina that could trigger retinal suppression. We generated silhouettes of birds, flying with a range of velocities as measured in the wild (35) and at varying apparent distances (Fig. 6). The W3 cells responded with a strong burst of spikes for silhouettes whose diameter matched the W3 receptive field center (Fig. 6A). At twice this retinal size, the response was weaker but still reliable. At twice the size again, the W3 cells remained silent, presumably because the silhouette swept into the suppressive surround (Fig. 6C), much as in the close-up movies of Fig. 2C. In summary, even for a carefully designed stimulus—dark spots on a blank background—the response of W3 cells was remarkably size selective.
Fig. 6.

W3-RGCs can detect motion of small dark objects. Response of W3-RGCs to a flying bird against a featureless background is shown. The stimulus was a dark silhouette that Tinbergen used to elicit escape behaviors (48). It moved horizontally at five wing spans per second. This stimulus was repeated at several vertical offsets (horizontal lines) and spikes were recorded on multiple trials in each condition (rasters between horizontal lines). The responses are displayed like an instantaneous snapshot of activity in the W3 population: The local density of spikes represents the firing rate of W3 RGCs at that location relative to the stimulus. As expected from the slow kinetics of W3 cells, the neural response lags some distance behind the image of the object and more so at higher velocity. Responses were robust for silhouettes about the size of the W3 receptive field (A), declined substantially at twice that size (B), and disappeared entirely for larger sizes (C).
Discussion
The central result of this study is that the most numerous ganglion cell type in the mouse retina—the “W3” cell—acts as a highly specific feature detector. Surprisingly they do not participate at all in encoding the retinal image during active locomotion of the mouse (Fig. 2). Instead they appear selective for stimuli that might result under attack from aerial predators (Fig. 6). This selectivity stands in contrast to that in the retinas of other mammals, like the cat and the macaque, in which the densest ganglion cells encode the visual image with only minimal and generic processing (30, 36).
Neural Circuits Leading to W3 Cells: Working Model.
To reach these conclusions we exploited a transgenic mouse line that selectively labels W3 ganglion cells. We showed that these neurons represent a single natural cell type because they cover the retina in a mosaic fashion, albeit with considerable dendritic overlap (Fig. 1). The W3 cells exhibit rather complex visual responses, yet they can be understood within a compact model for neural circuits in the inner retina (Fig. 5I). We emphasize that this working model will need to be tested in future experiments, including anatomical verification of the proposed connections.
In this putative circuit, the W3 cell receives synapses from both On- and Off-bipolar cells, as suggested by its responses at both light On and light Off (Fig. 3) and a dendritic arbor that spans the On–Off boundary in the IPL (Fig. 1D). These bipolar synapses should be at least partly rectifying (37), so that the On and Off inputs do not cancel postsynaptically. This effect can arise if the bipolar cell synapse is poised at a very low basal rate of transmitter release. The rectification can also explain the strong response to reversal of a fine grating in the center (Fig. 4), because that stimulus will excite either On or Off bipolars at every location. The model predicts correctly that this process works until the grating bars are finer than a bipolar cell receptive field, ∼25 μm for type 3 bipolars (32).
Amacrine cells from the surround region of the circuit make inhibitory synapses both with the W3 cell directly and with the bipolar cell terminals that feed it, which accounts for the observed feedforward and feedback inhibition (Fig. 5F). Much of this inhibition arrives from spiking axon-bearing amacrine cells that can transmit laterally over long distances (38, 39). We suggest that the participating amacrine cells also receive rectified input from both On and Off bipolars, because both On and Off transitions inhibit the W3 cell (Fig. 5B), even if the spatial pattern is a fine grating (Fig. 5E). Of course this is a parsimonious picture, and instead the inhibition might be combined from multiple amacrine types that each have purely On or Off responses. In any case, the On–Off rectification means that the surround is strictly suppressive: Any change of illumination there will transiently decrease excitation and increase inhibition of the W3 cell. By comparison, other ganglion cell types, including the J-RGCs (15), have a more linear surround response and can be led to spike by proper stimulation of the surround alone.
W3 Cells Are Feature Detectors Suitable for Detecting Aerial Predators.
The exceptionally powerful surround circuits ensure that W3 cells remain suppressed under most conditions of stimulation (Fig. 2). Within our survey of stimuli, the only condition that elicits reliable responses is movement of a small spot on a background that is either perfectly still or unpatterned. In the natural environment this situation occurs, for example, when a bird moves against the sky (Fig. 6).
Could the W3 cells reliably save a mouse from such an aerial predator? The strongest response was seen when the bird’s wing span just covers the receptive field center (Fig. 6A), an angular subtense of 4°. This stimulus occurs with the bird at a distance of 14 wing spans. Large birds fly at speeds of 5–12 wing spans per second (35). Thus, from the moment when W3 cells optimally signal the predator, the mouse still has a generous 1.2–2.8 s to escape. By the time the image is large enough to suppress W3 cell firing (Fig. 6C), only ∼0.4 s remains to impact. If the animal has not already initiated escape at that time, its retina will soon cease functioning permanently.
The spatial and temporal characteristics of the W3 response appear well suited for an alarm function. This ganglion cell population shows the highest cell density in the ventral part of the retina, which is directed at the sky. The small receptive field center is essential to detect the predator at large enough distance. The strong suppressive surround in turn serves to silence the W3 cells under almost all other conditions—including the optic flow generated by self-movement (Fig. 2 A and B)—so that their spikes can be interpreted reliably as cause for alarm. The relatively slow kinetics of the W3 cell could be seen as a detriment for a rapid alarm system. The light response of W3 cells lags that of many other RGC types by ∼30 ms (Fig. 3C, iv). One consequence of this slow center excitation is that surround inhibition can “catch up” and veto the center input before it leads to spikes. In fact, for a global motion stimulus, the inhibition even peaks before the excitation (Fig. 5F and ref. 40). Delaying the center excitation is necessary because the surround signal flows through at least one additional neuron, an amacrine cell (Fig. 5I). The circuit features that underlie this timing remain to be determined, but one possibility is that the bipolar cells providing input to the receptive field center are of a slower type than those that supply amacrines in the surround, a prediction to be tested in future circuit studies. In this picture, the delayed response can be seen as a price paid for the exquisite selectivity of the feature detector. It serves to ensure that the W3 cell remains silent under the ubiquitous large-field image shifts that occur during natural locomotion and eye movements. For its presumed bird-detector function, this delay is only a minor cost: The 30-ms delay is less than 2% of the overall warning time of ∼2 s.
W3 Ganglion Cells Are an Evolutionarily Conserved Visual Channel.
In the mouse retina, W3 cells are clearly recognizable as a morphological type because they have the smallest dendritic fields, a broadly stratified arbor in the middle of the IPL, and a dense and thorny appearance of the dendrites. Closely related types of RGC exist in other mammalian species, the most compelling case being the “local edge detector” (LED) of the rabbit retina (41). Like W3 cells, the LED arborizes near the middle of the IPL, between the two ChAT layers (40), with the occasional dendrite shooting upward to a more distal level (42). These cells have the smallest dendritic fields (42) and account for ∼15% of the entire RGC population (40). They respond at both light onset and light offset (41–43), but more slowly than other RGC types in the same retina (40). Like the W3 cell, the LED also responds to fine gratings in the center (41). A strong inhibitory surround can completely suppress the response (40–43). These parallels among structural and functional parameters clearly identify the mouse W3 ganglion cell with the rabbit local edge detector.
In the cat retina, the “theta” cells (44) have remarkably similar dendritic structure. They are thought to produce transient On–Off responses without direction selectivity, like the W3 cells (44). In the macaque retina, a closely similar ganglion cell is the “broad thorny” type (45). Again, their dendrites stratify in a broad arbor near the middle of the IPL and are distinct by their thorny appearance. These ganglion cells also produce transient On–Off responses without direction selectivity. Interestingly, both the cat and the macaque retinas contain other RGC types that are considerably smaller and denser than the W3 analogs, namely the “beta” and “midget” cells, respectively. These cell types act like high-resolution pixel encoders for generic visual images. It is intriguing that they appear to be absent in the prey species mouse and rabbit. The amphibian retina also contains a ganglion cell type with very similar function and presynaptic circuitry (34, 38).
On the basis of these comparative notes we suggest that the W3 type of ganglion cell has been conserved in evolution. Presumably these RGCs play an important functional role in every visual system. Indeed, it now appears that many of the ganglion cell types studied in lower mammals persist even in the human eye, and they feed central visual targets including the superior colliculus and the thalamus (45, 46). Thus, it becomes increasingly interesting to understand the function of these canonical circuits of the retina and what role they might play for our visual perception. With genetic access to specific types, and the ability to silence them selectively, it will be possible to test how they map onto specific aspects of visual behavior.
Materials and Methods
Mice.
The generation of W3 mice has been described previously (12). Briefly, they were generated from a vector in which Thy1 regulatory elements drive the expression of YFP, wheat-germ agglutinin (WGA), and Escherichia coli β-galactosidase (LacZ; Thy1-lox-YFP-STOP-lox-WGA-LacZ). In the absence of Cre, YFP was expressed in a distinct subset of RGCs in the W3 retina, presumably due to effects of sequences near the site of transgene integration in the genome (19). All experiments were carried out in accordance with protocols approved by the Harvard University Standing Committee on the Use of Animals in Research and Teaching.
Microscopy.
For microscopy of immunolabeled retina (Fig. 1 D and E) mice were euthanized and the retina was dissected out, fixed for 1 h in 4% paraformaldehyde (PFA)/PBS, washed with PBS, stained as described by Kim et al. (12), and then imaged by confocal microscopy. To analyze the distribution across the retina, the native YFP fluorescence was imaged in a fixed whole-mount retina (Fig. 1A and Fig. S1). In these images the fluorescence intensity of neurons in the ganglion cell layer follows a bimodal distribution (Fig. S1). This distribution was fitted to a sum of two Gaussian curves. The cells in the brighter population were defined as W3 cells and their soma locations were analyzed to test for regular spacing. Similarly during physiology experiments the electrodes were targeted at the bright population.
Density Recovery Profile.
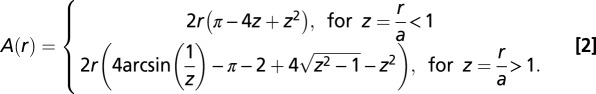
The density recovery profile (Fig. 1E and Fig. S2) plots the probability per unit area of finding a soma as a function of distance from a soma of the same type (26). For a square region of interest of side length a, we computed this probability by measuring for each reference cell the distances to all of the other cells and histogramming those, which yields
Then we computed the average area available at radii between  and
and  from a reference cell. On average over all locations in the square, one can show that this is
  , where
 |
Then the DRP is computed as
We considered that the W3 population might be only partially labeled in the mutant mouse. Suppose a random fraction  of the population is labeled and the others remain invisible. The remaining population will produce a DRP of the same shape, but scaled vertically by a factor of
  . To estimate the fraction labeled, we computed the DRP predicted for various values of
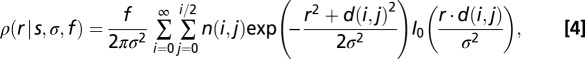
  . We assumed that the parent population is arranged on a close-packed hexagonal lattice of side length
  and that each soma deviates from its lattice position by some random displacement, distributed as a Gaussian with SD
  . Under these assumptions one can derive an expression for the DRP,
 |
where
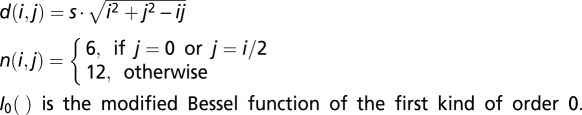 |
This three-parameter expression was fitted to the measured DRP (Fig. 1E), and we determined the best-fit values and 95% confidence intervals for the underlying parameters. Note the close-packed lattice is the tightest possible arrangement. If the true arrangement is looser, e.g., on a square lattice, then the labeling fraction must be higher to produce the observed DRP. Hence this procedure yields a lower bound on the labeling fraction. In retinal regions with dense labeling of W3 cells we found  . For a test of these estimates, we applied the same procedure to a completely labeled array of starburst amacrine cells, which yielded
  as expected (Fig. S2).
Electrophysiology.
Mice were dark adapted for at least 1 h before euthanasia. The retina was isolated under infrared illumination into oxygenated Ringer’s solution containing 110 mM NaCl, 2.5 mM KCl, 1 mM CaCl2, 1.6 mM MgCl2, and 25 mM NaHCO3, aerated with 95% O2, 5% CO2 at room temperature. A piece of retina, ∼3–4 mm on a side, was placed with ganglion cells facing up in a superfusion chamber on the stage of an upright fluorescence microscope. Fluorescent ganglion cells were detected by brief excitation (∼20–50 ms) with a blue LED and then targeted for recording. Action potentials were recorded in the cell-attached mode, and synaptic currents were recorded after forming a gigaseal and breaking the patch. For loose cell-attached recordings, the patch microelectrodes (4–7 MOhm) were filled with Ringer’s medium and had a final impedance of 4–7 MOhm. For whole-cell recordings, the patch microelectrodes were filled with an internal solution containing 120 mM Cs methanesulfonate, 0.5 mM CaCl2, 5 mM EGTA, 10 mM Hepes, 4 mM ATP, 0.5 mM GTP, 5 mM NaCl, and 5 mM QX-314, pH adjusted to 7.2 with CsOH. All reported membrane potential values are corrected for a −10-mV junction potential.
Current recordings were acquired using a Multiclamp 700B amplifier (Molecular Devices) and custom software. Signals were digitized at 10 kHz and low-pass filtered at 2 kHz. For all voltage-clamp experiments, series resistance (<20 MOhm) was not compensated. Stimulus-evoked synaptic conductance change was calculated as described by Taylor and Vaney (33). Briefly, stimulus-evoked synaptic currents were recorded at different holding potentials from −70 mV to +10 mV (Fig. S3). The I-V relationship was assumed to be linear. The reversal potential for excitation under our recording conditions was taken to be 0 mV, which was verified by blocking all inhibitory inputs to the cells. The reversal potential for chloride (inhibitory currents) is calculated to be −61 mV and was verified by a visual stimulus presented well outside of the dendritic arbor of the W3 cells, thus preventing excitatory inputs from bipolar cells.
Stimulation.
Light stimuli were delivered from a computer-driven video projector through a custom-made substage lens system and focused onto the photoreceptors (frame rate 60 Hz, magnification 5.75 μm/pixel). White light was used, and the average intensity for all stimuli was equivalent to the following photon flux values for the three mouse photoreceptors, each expressed at the wavelength of peak sensitivity: rod, 6.7 × 10⁴ photons⋅s−1⋅μm−2 at 500 nm; M cone, 8.2 × 10⁴ photons⋅s−1⋅μm−2 at 511 nm; and S cone, 1.2 × 10³ photons⋅s−1⋅μm−2 at 370 nm. For comparison the respective values for the blue LED used for brief fluorescence imaging were 6.8 × 10⁷, 5.6 × 10⁷, and 6.8 × 10⁵ photons⋅s−1⋅μm−2. Once a good recording was established on a RGC, we identified the receptive field center by probing with a small flashing spot and centered all subsequent stimuli on this point.
Spatiotemporal Receptive Field Measurement.
A white noise stimulus composed of a strip of randomly flickering bars (Fig. 3C) was presented to the retina centered on the W3 cell, and its action potentials were recorded. A 0.5-s stimulus epoch preceding each action potential was collected. Principal component analysis (PCA) of this spike-triggered stimulus ensemble (47) revealed that it can be separated into two distinct groups (Fig. 3C, ii). Two spatiotemporal receptive fields were then computed separately from the spikes in these two clusters: One turned out to be from the On pathway and the other from the Off pathway (Fig. 3C, iii).
Supplementary Material
Acknowledgments
We thank Jeremy Kay for advice and sharing results on retinal gene expression patterns. This work was supported by National Institutes of Health Grants NS29169, EY020426, EY019355, EY010020, and EY014737 and a Charles A. King fellowship (to Y.Z.).
Footnotes
The authors declare no conflict of interest.
See Author Summary on page 14297 (volume 109, number 36).
This article contains supporting information online at www.pnas.org/lookup/suppl/doi:10.1073/pnas.1211547109/-/DCSupplemental.
References
- 1.Masland RH. The fundamental plan of the retina. Nat Neurosci. 2001;4:877–886. doi: 10.1038/nn0901-877. [DOI] [PubMed] [Google Scholar]
- 2.Völgyi B, Chheda S, Bloomfield SA. Tracer coupling patterns of the ganglion cell subtypes in the mouse retina. J Comp Neurol. 2009;512:664–687. doi: 10.1002/cne.21912. [DOI] [PMC free article] [PubMed] [Google Scholar]
- 3.Wässle H. Parallel processing in the mammalian retina. Nat Rev Neurosci. 2004;5:747–757. doi: 10.1038/nrn1497. [DOI] [PubMed] [Google Scholar]
- 4.Buhl EH, Peichl L. Morphology of rabbit retinal ganglion cells projecting to the medial terminal nucleus of the accessory optic system. J Comp Neurol. 1986;253:163–174. doi: 10.1002/cne.902530204. [DOI] [PubMed] [Google Scholar]
- 5.Simpson JI. The accessory optic system. Annu Rev Neurosci. 1984;7:13–41. doi: 10.1146/annurev.ne.07.030184.000305. [DOI] [PubMed] [Google Scholar]
- 6.Do MT, Yau KW. Intrinsically photosensitive retinal ganglion cells. Physiol Rev. 2010;90:1547–1581. doi: 10.1152/physrev.00013.2010. [DOI] [PMC free article] [PubMed] [Google Scholar]
- 7.Dacey DM. The mosaic of midget ganglion cells in the human retina. J Neurosci. 1993;13:5334–5355. doi: 10.1523/JNEUROSCI.13-12-05334.1993. [DOI] [PMC free article] [PubMed] [Google Scholar]
- 8.Saito HA. Morphology of physiologically identified X-, Y-, and W-type retinal ganglion cells of the cat. J Comp Neurol. 1983;221:279–288. doi: 10.1002/cne.902210304. [DOI] [PubMed] [Google Scholar]
- 9.Enroth-Cugell C, Robson JG. The contrast sensitivity of retinal ganglion cells of the cat. J Physiol. 1966;187:517–552. doi: 10.1113/jphysiol.1966.sp008107. [DOI] [PMC free article] [PubMed] [Google Scholar]
- 10.Chalupa LM, Williams RW, editors. Eye, Retina, and Visual System of the Mouse. Cambridge, MA: MIT Press; 2008. [Google Scholar]
- 11.Kay JN, et al. Retinal ganglion cells with distinct directional preferences differ in molecular identity, structure, and central projections. J Neurosci. 2011;31:7753–7762. doi: 10.1523/JNEUROSCI.0907-11.2011. [DOI] [PMC free article] [PubMed] [Google Scholar]
- 12.Kim IJ, Zhang Y, Meister M, Sanes JR. Laminar restriction of retinal ganglion cell dendrites and axons: Subtype-specific developmental patterns revealed with transgenic markers. J Neurosci. 2010;30:1452–1462. doi: 10.1523/JNEUROSCI.4779-09.2010. [DOI] [PMC free article] [PubMed] [Google Scholar]
- 13.Münch TA, et al. Approach sensitivity in the retina processed by a multifunctional neural circuit. Nat Neurosci. 2009;12:1308–1316. doi: 10.1038/nn.2389. [DOI] [PubMed] [Google Scholar]
- 14.Huberman AD, et al. Genetic identification of an On-Off direction-selective retinal ganglion cell subtype reveals a layer-specific subcortical map of posterior motion. Neuron. 2009;62:327–334. doi: 10.1016/j.neuron.2009.04.014. [DOI] [PMC free article] [PubMed] [Google Scholar]
- 15.Kim IJ, Zhang Y, Yamagata M, Meister M, Sanes JR. Molecular identification of a retinal cell type that responds to upward motion. Nature. 2008;452:478–482. doi: 10.1038/nature06739. [DOI] [PubMed] [Google Scholar]
- 16.Huberman AD, et al. Architecture and activity-mediated refinement of axonal projections from a mosaic of genetically identified retinal ganglion cells. Neuron. 2008;59:425–438. doi: 10.1016/j.neuron.2008.07.018. [DOI] [PMC free article] [PubMed] [Google Scholar]
- 17.Yonehara K, et al. 2008. Expression of SPIG1 reveals development of a retinal ganglion cell subtype projecting to the medial terminal nucleus in the mouse. PLoS ONE 3:e1533.
- 18.Hattar S, Liao HW, Takao M, Berson DM, Yau KW. Melanopsin-containing retinal ganglion cells: Architecture, projections, and intrinsic photosensitivity. Science. 2002;295:1065–1070. doi: 10.1126/science.1069609. [DOI] [PMC free article] [PubMed] [Google Scholar]
- 19.Feng G, et al. Imaging neuronal subsets in transgenic mice expressing multiple spectral variants of GFP. Neuron. 2000;28:41–51. doi: 10.1016/s0896-6273(00)00084-2. [DOI] [PubMed] [Google Scholar]
- 20.Siegert S, et al. Genetic address book for retinal cell types. Nat Neurosci. 2009;12:1197–1204. doi: 10.1038/nn.2370. [DOI] [PubMed] [Google Scholar]
- 21.Sun W, Li N, He S. Large-scale morphological survey of mouse retinal ganglion cells. J Comp Neurol. 2002;451:115–126. doi: 10.1002/cne.10323. [DOI] [PubMed] [Google Scholar]
- 22.Badea TC, Nathans J. Quantitative analysis of neuronal morphologies in the mouse retina visualized by using a genetically directed reporter. J Comp Neurol. 2004;480:331–351. doi: 10.1002/cne.20304. [DOI] [PubMed] [Google Scholar]
- 23.Kong JH, Fish DR, Rockhill RL, Masland RH. Diversity of ganglion cells in the mouse retina: Unsupervised morphological classification and its limits. J Comp Neurol. 2005;489:293–310. doi: 10.1002/cne.20631. [DOI] [PubMed] [Google Scholar]
- 24.Coombs J, van der List D, Wang GY, Chalupa LM. Morphological properties of mouse retinal ganglion cells. Neuroscience. 2006;140:123–136. doi: 10.1016/j.neuroscience.2006.02.079. [DOI] [PubMed] [Google Scholar]
- 25.Jeon CJ, Strettoi E, Masland RH. The major cell populations of the mouse retina. J Neurosci. 1998;18:8936–8946. doi: 10.1523/JNEUROSCI.18-21-08936.1998. [DOI] [PMC free article] [PubMed] [Google Scholar]
- 26.Rodieck RW. The density recovery profile: A method for the analysis of points in the plane applicable to retinal studies. Vis Neurosci. 1991;6:95–111. doi: 10.1017/s095252380001049x. [DOI] [PubMed] [Google Scholar]
- 27.Szuts TA, et al. A wireless multi-channel neural amplifier for freely moving animals. Nat Neurosci. 2011;14:263–269. doi: 10.1038/nn.2730. [DOI] [PubMed] [Google Scholar]
- 28.Blanchard DC, Blanchard RJ. Ethoexperimental approaches to the biology of emotion. Annu Rev Psychol. 1988;39:43–68. doi: 10.1146/annurev.ps.39.020188.000355. [DOI] [PubMed] [Google Scholar]
- 29.Ghosh KK, Bujan S, Haverkamp S, Feigenspan A, Wässle H. Types of bipolar cells in the mouse retina. J Comp Neurol. 2004;469:70–82. doi: 10.1002/cne.10985. [DOI] [PubMed] [Google Scholar]
- 30.Enroth-Cugell C, Robson JG, Schweitzer-Tong DE, Watson AB. Spatio-temporal interactions in cat retinal ganglion cells showing linear spatial summation. J Physiol. 1983;341:279–307. doi: 10.1113/jphysiol.1983.sp014806. [DOI] [PMC free article] [PubMed] [Google Scholar]
- 31.Enroth-Cugell C, Robson JG. Functional characteristics and diversity of cat retinal ganglion cells. Basic characteristics and quantitative description. Invest Ophthalmol Vis Sci. 1984;25:250–267. [PubMed] [Google Scholar]
- 32.Wässle H, Puller C, Müller F, Haverkamp S. Cone contacts, mosaics, and territories of bipolar cells in the mouse retina. J Neurosci. 2009;29:106–117. doi: 10.1523/JNEUROSCI.4442-08.2009. [DOI] [PMC free article] [PubMed] [Google Scholar]
- 33.Taylor WR, Vaney DI. Diverse synaptic mechanisms generate direction selectivity in the rabbit retina. J Neurosci. 2002;22:7712–7720. doi: 10.1523/JNEUROSCI.22-17-07712.2002. [DOI] [PMC free article] [PubMed] [Google Scholar]
- 34.Ölveczky BP, Baccus SA, Meister M. Segregation of object and background motion in the retina. Nature. 2003;423:401–408. doi: 10.1038/nature01652. [DOI] [PubMed] [Google Scholar]
- 35.Pennycuick C. Actual and ‘optimum’ flight speeds: Field data reassessed. J Exp Biol. 1997;200:2355–2361. doi: 10.1242/jeb.200.17.2355. [DOI] [PubMed] [Google Scholar]
- 36.Benardete EA, Kaplan E. The receptive field of the primate P retinal ganglion cell, I: Linear dynamics. Vis Neurosci. 1997;14:169–185. doi: 10.1017/s0952523800008853. [DOI] [PubMed] [Google Scholar]
- 37.Demb JB, Zaghloul K, Haarsma L, Sterling P. Bipolar cells contribute to nonlinear spatial summation in the brisk-transient (Y) ganglion cell in mammalian retina. J Neurosci. 2001;21:7447–7454. doi: 10.1523/JNEUROSCI.21-19-07447.2001. [DOI] [PMC free article] [PubMed] [Google Scholar]
- 38.Baccus SA, Ölveczky BP, Manu M, Meister M. A retinal circuit that computes object motion. J Neurosci. 2008;28:6807–6817. doi: 10.1523/JNEUROSCI.4206-07.2008. [DOI] [PMC free article] [PubMed] [Google Scholar]
- 39.Famiglietti EV. Polyaxonal amacrine cells of rabbit retina: Morphology and stratification of PA1 cells. J Comp Neurol. 1992;316:391–405. doi: 10.1002/cne.903160402. [DOI] [PubMed] [Google Scholar]
- 40.van Wyk M, Taylor WR, Vaney DI. Local edge detectors: A substrate for fine spatial vision at low temporal frequencies in rabbit retina. J Neurosci. 2006;26:13250–13263. doi: 10.1523/JNEUROSCI.1991-06.2006. [DOI] [PMC free article] [PubMed] [Google Scholar]
- 41.Levick WR. Receptive fields and trigger features of ganglion cells in the visual streak of the rabbits retina. J Physiol. 1967;188:285–307. doi: 10.1113/jphysiol.1967.sp008140. [DOI] [PMC free article] [PubMed] [Google Scholar]
- 42.Amthor FR, Takahashi ES, Oyster CW. Morphologies of rabbit retinal ganglion cells with complex receptive fields. J Comp Neurol. 1989;280:97–121. doi: 10.1002/cne.902800108. [DOI] [PubMed] [Google Scholar]
- 43.Russell TL, Werblin FS. Retinal synaptic pathways underlying the response of the rabbit local edge detector. J Neurophysiol. 2010;103:2757–2769. doi: 10.1152/jn.00987.2009. [DOI] [PMC free article] [PubMed] [Google Scholar]
- 44.Isayama T, Berson DM, Pu M. Theta ganglion cell type of cat retina. J Comp Neurol. 2000;417:32–48. doi: 10.1002/(sici)1096-9861(20000131)417:1<32::aid-cne3>3.0.co;2-s. [DOI] [PubMed] [Google Scholar]
- 45.Dacey DM. In: The Cognitive Neurosciences. Gazzaniga MS, editor. Cambridge, MA: MIT Press; 2004. pp. 281–301. [Google Scholar]
- 46.Schiller PH. Parallel information processing channels created in the retina. Proc Natl Acad Sci USA. 2010;107:17087–17094. doi: 10.1073/pnas.1011782107. [DOI] [PMC free article] [PubMed] [Google Scholar]
- 47.Geffen MN, de Vries SE, Meister M. Retinal ganglion cells can rapidly change polarity from Off to On. PLoS Biol. 2007;5:e65. doi: 10.1371/journal.pbio.0050065. [DOI] [PMC free article] [PubMed] [Google Scholar]
- 48.Schleidt W, Shalter MD, Moura-Neto H. The hawk/goose story: The classical ethological experiments of Lorenz and Tinbergen, revisited. J Comp Psychol. 2011;125:121–133. doi: 10.1037/a0022068. [DOI] [PubMed] [Google Scholar]
