

Abstract
Cells use their dynamic actin network to control their mechanics and motility. These networks are made of branched actin filaments generated by the Arp2/3 complex. Here we study under which conditions the microscopic organization of branched actin networks builds up a sufficient stress to trigger sustained motility. In our experimental setup, dynamic actin networks or “gels” are grown on a hard bead in a controlled minimal protein system containing actin monomers, profilin, the Arp2/3 complex and capping protein. We vary protein concentrations and follow experimentally and through simulations the shape and mechanical properties of the actin gel growing around beads. Actin gel morphology is controlled by elementary steps including “primer” contact, growth of the network, entanglement, mechanical interaction and force production. We show that varying the biochemical orchestration of these steps can lead to the loss of network cohesion and the lack of effective force production. We propose a predictive phase diagram of actin gel fate as a function of protein concentrations. This work unveils how, in growing actin networks, a tight biochemical and physical coupling smoothens initial primer-caused heterogeneities and governs force buildup and cell motility.
Keywords: actin force generation, modeling, symmetry breaking
In eukaryotic cells, actin network formation and self-organization drive a variety of cellular processes including cell polarization, cell motility, and morphogenesis. Motile cells can change their speed and mechanical properties by controlling the biochemistry of network assembly. Polymerization of actin monomers into a branched network of filaments generates forces that are sufficient for lamellipodium formation and cell migration. In lamellipodia of crawling cells, filament nucleation and branching is triggered through the activation of the Arp2/3 complex on the side of a preexisting filament (the “primer”) by nucleation promoting factors (NPFs) such as proteins from the WASP family (1–3). This process of branching off filaments repeats itself, leading to the auto-catalytic formation of a network of entangled filaments (4). However, it is not clear how the microscopic structure, in particular heterogeneities in actin network, impacts the mechanical properties during the production of force at the onset of motility.
A major progress in understanding actin-based motility came with the introduction of reconstituted biomimetic systems inspired by motile pathogens such as Listeria monocytogenes (5, 6). These in vitro systems provided evidence for actin-driven force generation and paved the way to biophysical modeling. Over the last decade, several models have been proposed, each of them addressing phenomena on a different scale. One class of models describes actin networks at a macroscopic scale as a continuous elastic gel (6–9) that deforms due to the accumulation of an internal stress generated by actin polymerization. These macroscopic continuous approaches offer valuable insights into actin-driven force generation, stress buildup prior to symmetry breaking and network reorganization at a mesoscopic scale (7, 8, 10). The other class of models rely on the chemical mechanisms responsible for filament nucleation, filament branching and filament entanglement (1, 11, 12). However, despite experimental and modeling efforts, the link between microscopic properties of actin networks and the production of force at a macroscopic scale remains poorly understood.
In this study, our experimental conditions are designed for a true parallel between experiments and modeling. We use well-defined biochemical conditions where actin is maintained in its monomeric form in the bulk buffered by an excess of profilin. In these conditions, actin nucleation is essentially restricted to the surface of micrometer-sized beads coated with an NPF. Our aim is to allow a direct connection between the microscopic structure of the actin network—namely, its branch density, the entanglement of these filaments, and the resulting gel mechanical properties. To integrate these different scales in the description of the network, we design a model that includes (i) primer contact, (ii) network extension, (iii) filament entanglement, and network mechanics. We investigate how the primer-based mechanism of actin network formation influences the mesoscopic properties of the actin gel formed around the beads. Our results are summarized in a morphology diagram of actin gel and symmetry breaking occurrence around beads providing the link between observed macroscopic properties and microscopic parameters controlled by biochemical conditions.
Results
Reconstituted Motility System.
We use a G-actin motility system in the presence of excess of profilin (1) to fully control biochemical reactions on the bead surface. This allows for a thorough description of the different steps of actin network formation, spanning from a molecular to a mesoscopic scale.
Bead Motility Assay: Observations and Simulations.
Beads coated with the NPF (pWA, see SI Materials and Methods) are placed in the mixture of purified proteins [the Arp2/3 complex, actin, profilin and capping protein (CP)]. Network formation by primer contact is observed by evanescent wave microscopy (Fig. 1A1) and governed by the concentration of preformed actin filaments (1). In our conditions, 25 primers are necessary on average to trigger actin network formation. Accordingly, we simulate the contact of 25 primers (1.5 μm long on average) at random positions on the bead surface (Fig. 1A2, SI Materials and Methods, and Movie S1). In addition, we tested that in simulations, an initial number of primers ranging from 25 to 100 has only minor effects on the final outcome. Actin branches are initiated at the site of contact between the primer and the ternary complex constituted of the NPF, the Arp2/3 complex and an actin monomer (Fig. 1 B1 and B2 and Fig. S1, Left) (1). As the branched network expands, individual actin filaments are not distinguishable anymore using evanescent wave microscopy, and a larger-scale network appears both in epifluorescence microscopy and in simulations (Fig. 1 C1 and C2), made of actin filament subnetworks, each originating from one single primer. These subnetworks entangle depending on protein conditions (see below). At this stage, simulations are the only way to keep track of each filament, whereas epifluorescence observation gives only a mesoscopic view of the actin network (Fig. 1 C1 and D1). We model the effect of the filament entanglement during subnetwork growth by connecting the subnetwork barycenters with springs resulting in an elastic force (Fig. 1D2 and Fig. S1, Right). The spring stiffness is proportional to the number of entangled filaments. In addition to this elastic force, we take into account a pushing force due to polymerization, a lifting-up force, and a force due to friction between subnetworks (see SI Materials and Methods).
Fig. 1.

Side-by-side representation of experiment and model of actin network growth. (A1–F1) TIRFm/epifluorescence images corresponding to different actin gel growth stages around NPF coated beads in the presence of Arp2/3 complex, Alexa488 labeled G-actin, profilin, and CP. The time scale corresponds to several minutes. Scale bar, 2 μm from A1 to C1, Upper, and 4.5 μm from C1, Lower, to F1. (A2–E2) Actin network growth and symmetry-breaking event on a 4.5-μm bead in the simulation. (A2–C2) Kinetically-governed growth of independent subnetworks emanating from primers. (D2–E2) Mechanical interactions between subnetworks represented as springs can lead to symmetry-breaking event (E2, broken spring in red followed shortly by crack opening). See also Fig. S1 and Movie S1. SB: symmetry breaking.
Experimentally, we define symmetry breaking by the appearance of a visible heterogeneity in the actin gel around the bead, followed by comet formation (Fig. 1 E1 and F1). In simulations, symmetry breaking is triggered by the rupture of a spring that stretches twice the resting length D(t0) (see Fig. S1). Symmetry-breaking time is defined when an uncovered surface of at least 200 nm2 appears after the bead has been fully covered by actin filaments (see SI Materials and Methods and Fig. 1E2). Concentrations of the Arp2/3 complex and CP are varied and lead to different fates: either comet formation (Fig. 1F1), or no symmetry breaking. Interestingly, both situations are characterized by the appearance of heterogeneities. Because these two cases have different fates, we are prompted to investigate their morphological characteristics as a function of time.
Gel Heterogeneities Without Symmetry Breaking.
We first focus on the case that does not lead to symmetry breaking and comet formation. Angular fluorescence intensity profiles and computed thicknesses (Fig. 2 A and B) show that fluorescence increases over time (Fig. 2 C and D) because the actin network constantly grows and the angular profiles never overlap. To quantify gel heterogeneity, we use the relative standard deviation (RSD) (see SI Materials and Methods). A constant RSD of 0.02 corresponds to a homogeneous gel growth, in the absence or at low concentration of CP (10 nM), independently of the Arp2/3 complex concentration (bottom image and black circles in Fig. 2E, black solid curve in Figs. 2F and 3D). A heterogeneous gel is characterized by an RSD greater than 0.05 (Fig. 2 E, Top, and F). In this case, the time evolution of the RSD is characterized by constant growth after an initial fast increase (Fig. 2F). Therefore, the heterogeneities are amplified and persist over time.
Fig. 2.

Characterization of persistent heterogeneous growth not leading to symmetry breaking. (A and B) Measured angular fluorescence intensity (A) and computed local gel thickness (B) of the actin gel around the 4.5-μm bead (only three planes are shown for clarity; see SI Materials and Methods). (C) Time evolution of the angular fluorescence profile. Each solid line represents the intensity profile measured every 2 min, starting from Bottom red curve at 2 min to Top orange curve at 16 min. Experimental conditions: Arp2/3 25 nM, CP 50 nM. (D) Time evolution of the computed actin network thickness (conditions analogous to C; Bottom red curve at 2 min; Top orange curve at 16 min). (E) Fluorescence images of heterogeneous actin gels. Scale bar, 5 μm. White arrowheads point to visible heterogeneities. Experimental conditions: Upper Left, Arp2/3 25 nM, CP 50 nM; Upper Right, Arp2/3 25 nM, CP 40 nM; Lower, Arp2/3 25 nM, CP 0 nM. (F) RSD of fluorescence intensity profiles (symbols) and of computed thickness (solid lines) as a function of time. The black curve and the black circles correspond to a homogeneous case when no CP is present. Conditions: black circles and black solid line, Arp2/3 25 nM, CP 0 nM; red triangles and red solid line, Arp2/3 25 nM, CP 50 nM. Each symbol corresponds to one bead measurement. Lines are averages of 10 simulation runs. Bead size is 4.5 μm.
Fig. 3.

Heterogeneities as a signature of symmetry breaking. (A) Time evolution of the angular fluorescence profile. Each solid line represents the intensity profile measured every 2 min, starting from bottom red curve at 6 min to Top orange curve at 20 min. Experimental conditions: Arp2/3 50 nM, CP 20 nM, 4.5-μm bead. (B) Time evolution of the computed actin network thickness (conditions analogous to A; Bottom red curve at 2 min; top black curve at 14 min). Black arrows in A and B point to symmetry break site. (C) Fluorescence images corresponding to three distinct gel growth stages: homogeneous (Upper Left), onset of symmetry breaking (Upper Right, arrowhead), and comet formation (Lower) (scale bar, 5 μm). Experimental conditions: Arp2/3 50 nM, CP 20 nM, 4.5-μm bead. (D) RSD of fluorescence intensity profiles (symbols) and of computed thickness (solid lines) as a function of time. The black circles and black curve correspond to a homogeneous case when no CP is present. Conditions: black circles and black solid line, Arp2/3 50 nM, CP 0 nM; red triangles and red solid line, Arp2/3 25 nM, CP 20 nM; green squares and green solid line, Arp2/3 50 nM, CP 20 nM. Each symbol corresponds to one bead measurement. Lines are averages of 10 simulation runs. Bead size is 4.5 μm.
Emerging Heterogeneities as a Signature of Symmetry Breaking.
Compared to the case of no symmetry breaking, the intensity profiles show distinct features. In experiments and simulations (Fig. 3 A and B), the angular profiles show a homogeneous growth followed by an overlap between two subsequent profiles. This overlap always associates with the onset of a symmetry-breaking event (Fig. 3 A and B, black arrows). After a homogeneous growth of the actin shell, a notch appears (Fig. 3C, white arrowhead) and is followed by comet formation. This sequence of events (Fig. 3C) has the highest percentage of occurrence in a concentration window of 25 nM Arp2/3 complex and 20–30 nM CP for 4.5-μm-diameter beads. Increasing the Arp2/3 complex concentration to 50 nM still results in comet formation for 20–50 nM of CP but multiple comets appear (see below). In contrast to no symmetry-breaking conditions, the RSD parameter slowly increases as a function of time before an explosive raise corresponding to gel fracture (Fig. 3D, green arrow). These heterogeneities occur prior to fracture, which is a requirement for symmetry breaking (Fig. 3C, white arrowhead).
Evolution of Actin Gel Thickness as a Function of Time.
In the absence of CP, actin filaments grow radially away from the bead as described before (1, 13) (Fig. S2). In all other conditions, a fluorescent shell of actin is observed around the beads, which we characterize by the mean gel thickness (see SI Materials and Methods) that display a sharp initial increase followed by a plateau (Fig. 4 A, B, E, and F). Symmetry breaking occurs shortly before or once the plateau is reached (7), and symmetry-breaking times in simulations match the ones of experiments (Fig. 4 B and F).
Fig. 4.

Kinetics and mechanics influence the variation of actin gel thickness over time. Gel thicknesses are measured from epifluorescence images. Results are presented in two columns: Left (no symmetry-breaking conditions) and Right (symmetry-breaking conditions). (A–F) Experimental (points, each point corresponds to one bead measurement from three independent experiments) and computed (lines) gel thickness as a function of time [4.5-μm beads (A–D) and 6.0-μm beads (E and F)]. Protein concentrations as indicated in insets. The colour stars indicate the average computed time of symmetry breaking. The horizontal bars give the distributions of experimental symmetry-breaking times. (C and D) Influence of the magnitude of the spring constants K (10-fold) and KA (3-fold) used in the model (see SI Materials and Methods). (G and H) Overlay of fluorescence images of two-color experiments and intensity profiles along the white dashed line. The actin gel is first grown in the presence of green G-actin during 15 min, then red G-actin is added and an image is taken immediately (Left images) and 40 min later (Right images). Experimental conditions: Left, Arp2/3 25 nM, CP 10 nM; Right, Arp2/3 25 nM, CP 30 nM. Bead diameter is 6.0 μm. Scale bar, 5 μm.
For 4.5-μm beads, in protein concentration necessary for motility, symmetry breaks before the plateau, and the symmetry-breaking time distribution is a few minutes wide (Fig. 4B). To probe the role of mechanics, we vary the mechanical constants K (spring constant) and KA (force constant) (see SI Materials and Methods) and follow their impact on the thickness in simulations (Fig. 4D). An increase in both constants K and KA generates a decrease of the plateau thickness. Conversely, a decrease of the same constants induces an increase of the plateau thickness. This effect of the mechanical constants is consistent with the presence of mechanical stress during symmetry breaking (7). In striking contrast, in conditions where no symmetry breaking occurs, the curves of the modeled thickness over time are independent of the mechanical constants (Fig. 4C). Note that in these conditions, a true parallel between experiments and model is rendered difficult by the gel thickness close to the optical resolution limit.
For 6-μm-diameter beads, gel thickness plateaus (Fig. 4 E and F). In conditions for motility, symmetry-breaking time distribution can be as wide as 1 h (Fig. 4F) (7). In order to elucidate where the actin is incorporated in the gel once the plateau is reached, we use two colors of fluorescent actin sequentially (Fig. S3) (10). In conditions where no symmetry breaking occurs, we observe that new actin is incorporated everywhere in the gel (Fig. 4G), suggesting that not all actin filaments are capped. In conditions where symmetry breaking occurs, new actin is incorporated mostly at the site of nucleation at the bead surface in agreement with all barbed ends being capped away from the beads (Fig. 4H). Moreover, in the latter case, actin incorporation is limited, indicating that the plateau corresponds to a slowdown in polymerization due to accumulation of mechanical constraints at the bead surface.
Morphology Diagram and Probability Distribution of Symmetry Breaking and Comet Formation.
All different situations corresponding to the occurrence of symmetry breaking are illustrated in a “morphology diagram” (Fig. 5A). At zero or low CP concentrations, we observe long filaments around the beads (Fig. 5A, Left, and Fig. S2). For low Arp2/3 complex concentrations beads display very weak fluorescence (12.5 nM; Fig. 5A, Bottom). Symmetry breaking occurs only in a concentration window (Fig. 5A, black-dotted line, and Fig. S4) with single or multiple comets, as indicated by percentage values (Fig. 5A and Fig S4). The probability to observe multiple comets increases with increasing Arp2/3 complex or CP concentration (percentages indicated in red and brackets in Fig. 5). Experiments with 6-μm beads show a wider motility window with slightly less symmetry-breaking events (Fig. S5). Note that in these conditions, symmetry breaking occurs on the plateau with a wide distribution of symmetry-breaking times (Fig. 4F).
Fig. 5.

(A) Diagram of the experimental and simulated actin morphology around 4.5-μm beads as a function of concentrations in CP and the Arp2/3 complex. Experiments are displayed with inverted fluorescence images. In simulated actin networks, filaments are in black, free barbed ends are green, and capped barbed ends are red. The black-dotted line encloses the protein conditions leading to symmetry breaking. All images are taken when symmetry breaking occurs or after 1 h for non-symmetry-breaking conditions. Black percentages refer to the percentage of beads displaying a single comet; red percentages refer to the percentage of beads displaying multiple comets. (Inset) Examples of multiple symmetry breaking; black arrows indicate cracks. Colored rectangles: average number of neighboring subnetworks, color code on the right. The lengths in nanometers indicate mean network mesh sizes (standard deviation of the given values +/- 20%). Number of entangled filaments versus number of filaments per subnetwork is given by the value “ent.” (B) Schematic view of branched actin network fate. (Top) Initial heterogeneities due to primer activation and tight biochemical control of branched actin network growth can have two outcomes. Blue box path (Left): Smoothing of the initial heterogeneities during subnetwork entanglement allows mechanical stress buildup. This scenario results in the formation of a homogeneous actin gel capable of global force production. Gray box path (Right): Initial heterogeneities are amplified and persist due to the lack of entanglement, resulting in a noncohesive actin network and local force production, only.
Discussion
Choice of Experimental Conditions for Modeling.
A major limitation in understanding the link between molecular reaction, network structure and mechanical properties during onset of actin-based motility is due to a lack of quantitative data on the actin network structure and its dynamics (14). Distinct models have been developed to try to understand the basic principles of actin-based motility. Those models are either at the filament scale and based on a Brownian ratchet mechanism, or at a mesoscopic scale and based on the mechanical properties of the actin network, and no unified protrusion model could be developed yet (14, 15). One difficulty to span the whole scale from molecules to actin networks is that experiments are not always sufficiently controlled. We use here tightly-controlled experimental conditions—namely, a profilin-buffered G-actin medium and the prolin-linked Verprolin, Cofilin, Acidic (VCA) protein, pWA as an NPF. Instead of having actin filaments in the bulk that would compete with actin polymerization at the bead surface, we thus target actin assembly essentially at the bead surface. In such conditions, the contact of drifting “primers” on the bead surface is followed by actin subnetwork generation (1, 16), and simulations can be run in parallel in the same protein conditions (Fig. S6). It is then crucial to control the number of primers because it defines the number of independent networks that might merge to build up a stress and generate symmetry breaking. In this scheme, the number of primers is controlled by the concentration of profilin (1). In addition, profilin is also necessary to constrain nucleation to the bead surface. In the absence of profilin, a consequence of uncontrolled bulk nucleation is that both gel growth and symmetry-breaking times are variable. Thus, in the absence of profilin, simulations cannot correctly account for nucleation in the bulk.
Stress Buildup: Kinetics Versus Mechanics.
We show that stress buildup originates from both the chemical and the mechanical properties of the system. It depends on the relative concentrations of CP and the Arp2/3 complex that control the degree of entanglement of each growing subnetwork emanating from primers. We provide evidence that a sufficient entanglement of the actin filaments allows stress to accumulate in the network, and this effect is crucial to control gel thickness, the onset of gel fracture and symmetry breaking. This applies in conditions of symmetry breaking (Fig. 4, Right), where a change in the spring constant value affects the plateau value of the actin thickness and new actin is incorporated exclusively at the bead surface (Fig. 4H). Conversely, a limited entanglement prevents stress buildup and does not produce symmetry breaking. In this case, the plateau of the actin thickness is independent of the spring constant, showing that mechanics do not play a role in network growth (Fig. 4, Left, and C). As a conclusion, entanglement of the actin subnetworks growing from primers depends on branching and capping and control bead motility fate. Another aspect that is unveiled in this study is that symmetry breaks at the boundary between subnetworks. The rationale for this is given from simple energy estimation. Indeed, the energy for breaking a single actin filament is 31.6 kT (17). Consequently, fracture of a subnetwork costs an energy that is equal to 31.6 kT multiplied by the number of filaments that need to be cut. In comparison, subnetwork separation as modeled in this study requires only filament disentanglement and the filament-filament interactions (as in the actin bundles) range between 0.05 to 0.12 kT per binding site (18). In our model, it is therefore more favorable to separate entangled subnetworks than to break across a subnetwork (see Fig. S7). Experimental evidence for the fact that symmetry breaks more easily in between subnetworks is given in Fig. 5: When the CP (or the Arp2/3 complex) concentration is increased, the number of multiple symmetry-breaking events increases. Consistent with these experimental observations, simulations show that the ratio of entanglements versus number of branches per subnetwork decreases for increasing Arp2/3 complex or CP concentrations. In these conditions, fracturing within the subnetwork is proven to be less favorable than fracturing between subnetworks. Note that we do not take into account the branching/debranching of actin filaments. Mechanical weaknesses are initiated by the primer mechanism, but we cannot exclude that stress-mediated network debranching may also lead to the appearance of small heterogeneities in the actin gel that might create internal rupture of the network. Increasing the biochemical complexity of both experimental setup and model will open the possibility to address further this question.
Link between Heterogeneities and Symmetry Breaking.
We can distinguish two cases for heterogeneities during actin network formation. In the first case, initial heterogeneities due to primers are maintained throughout the course of actin polymerization. Therefore, independent actin networks grow from primer sites and do not merge significantly to fully cover the bead resulting in local and limited forces. In the second case, initial heterogeneities due to the primer-based mechanism are smoothened by network-merging through filament entanglement. Stress can build up sufficiently, then a crack will appear prior to symmetry breaking. We define this latter case as a productive heterogeneity. Our simulations allow us to predict the origin of this productive heterogeneity, as seen in Fig. 3. Indeed, the actin network growing from the bead keeps the memory of the boundaries between extending subnetworks creating weak points at which productive crack opens up. We thus provide an explanation for the suggested link (7) between local heterogeneity and the formation of a crack in the actin gel.
Model Parameters and their Influence on Actin Gel Properties.
In the model, we obtain a final average number of 75 primers. The distance between primers is at an intermediate scale much larger than the monomer size, and much smaller than the bead diameter, thus ensuring a correct description of a continuous network. If the number of primers is too low (< 10), the model is inconsistent with a continuous gel description. Simulations allow us to derive the mesh size of the network, and we note that when symmetry breaking occurs, the mesh size is in the 30- to 80 nm range (Fig. 5A). Denser networks or sparser networks do not lead to symmetry breaking.
Another parameter of the network is the number of springs connecting the neighboring subnetworks. There is an optimal range for this number, between 8 to 12. If this number is too low (< 7), symmetry does not break because there is no sufficient stress buildup (Fig. 5A and Fig. S8). If the number of springs per subnetwork is larger than 13, the network is too dense (smallest mesh-size) for symmetry to break.
The friction coefficient CT, obtained from best fit with experiments, has a value of 1.0 pN·s·μm-1. The related viscosity can be obtained by dividing this friction coefficient by the characteristic length of the actin gel, namely the size of an actin subnetwork. Given that there are 75 primers on a 4.5-μm-diameter bead, this size is on the order of 200 nm, thus giving a viscosity of 5 Pa·s, close to the 15 Pa·s viscosity of actin gels. This confirms the relevance of our modeling (18). The spring stiffness K is found to be 100 pN·μm-1; the value of KA is 30 pN for an actively polymerizing entangled filament. Young modulus estimates vary from 500 Pa (25 nM of Arp2/3, 50 nM of CP) to 1,000 Pa (25 nM of Arp2/3, 20 nM of CP) with, on average, 5 to 7 entangled filaments between two barycenters and an average spring length of 0.5–1.0 μm. This range of values for Young moduli agrees well with previous estimations or measurements of mechanical properties of actin networks (19–21).
Model Predictions: Coupling between Kinetics and Mechanics and Relevance for Cells and Cell Motility.
We show here that initial heterogeneities in the growing actin network are due to primer contact and have two different fates depending on local protein concentrations: Either these heterogeneities remain during network growth, leading to lack of symmetry breaking, or these heterogeneities are smoothened, leading to symmetry breaking. (Fig. 5A). To avoid spontaneous polymerization in cells, actin nucleation is perfectly controlled in space and time, and occurs exclusively at membranes (Fig. 5B). The geometry of the lamellipodium is different from the one of networks around beads, which is closer to the one of blebs. Nevertheless, it remains true in any geometry that heterogeneities arise in actin networks produced at an activating surface like the one of the membrane. In the spherical geometry, these heterogeneities are subsequently revealed through symmetry breaking. Our model highlights that the emergence of network heterogeneities is a consequence of a tight biochemical control (Fig. 5B, Top). When the concentrations of Arp2/3 complex and CPs are not optimal (Fig. 5A), heterogeneities persist and are even amplified over time. In these conditions, there is no cohesion of the actin network (Fig. 5B, Right). Directional motility should require interconnectivity of actin cortex over a length that is on the order of the cell size, because the lack of cohesion of the actin network results in the absence of persistent directionality in cells (22). Our model predicts that if protein concentration conditions allow subnetwork expansion and entanglement, the emerging mechanical properties prevail and smoothen the initial heterogeneities (Fig. 5B, Left). In these conditions, subnetworks merge into a cohesive gel enabling actin structures to generate a global force necessary for efficient directional cell migration (22). Because the actin network originates from subnetworks, local weaknesses still persist and favor cell response during migration. Indeed, a continuous gel made, for example, of an infinite number of primers would provide no weakness, thus preventing the cell from fast adaptation to external cues. In conclusion, the balance between biochemistry and mechanics during actin structure formation and the resulting variety of cell shapes allows the cell to produce different motility modes depending on its environment (23).
Materials and Methods
Experimental conditions (protein, bead preparation, actin gel growth and data processing of gel thickness measurement and symmetry-breaking detection) are given in SI Materials and Methods. Descriptions of the chemical reactions used in the model are also given in SI Materials and Methods and Table S1.
General Model Description.
Simulation of actin network growth is divided into two sequential parts (Fig. 1, Fig. S1, and Movie S1): (i) from time t0 to t1, the kinetics of nucleation, elongation, and capping of isolated actin subnetworks from primers at the surface of NPF-coated beads and (ii) after t1, the mechanical interactions that develop once individual subnetworks start to entangle and possibly build up a mechanical stress. The initial number of primers is fixed at 25, and new primers are allowed to contact the bead surface until total coverage of the bead. The final number of primers is 75 on average. The details of filament elongation and branching are given in SI Materials and Methods and in ref. 1.
Mechanical Interactions.
The N initial primers are assigned a number i running from 1 to N. At time t1, we associate to each different filament subnetwork i originating from primer i its barycenter denoted Ri(t) because its position depends on t (Fig. S1, Right, red dots). Actin subnetworks move in response to four forces:
- The pushing force FP. This force originates from actin filaments that polymerize against the neighboring subnetworks. The number of entangled filaments
 emanating from two neighboring subnetworks j and k is defined as the number of filaments emanating from subnetwork j and whose barbed ends are closer to the barycenter of the second subnetwork k than to the subnetwork j at time t. The pushing force exerted on subnetwork j by the neighboring subnetwork k reads
where ujk is the unit vector along the line through Rj and Rk. KA is a parameter that reflects force per filament.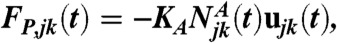
- The lifting-up force FL. This force results from the elongation of free barbed ends close to the bead surface. A single filament q, belonging to the actin subnetwork j and with its barbed end stalled against the bead, exerts a force given by the Euler buckling condition (1). The total lifting-up force for the subnetwork j is then sum of the force contributions from all stalled filaments. The resulting force is approximately directed along the normal vector nj to the bead. Therefore, the lifting-up force reads
where κ is the filament bending rigidity (κ = LpkBT = 4.1·10-2 pN·μm2, Lp = 10 μm, kBT = 4.1·10-21 J), Lq is the filament q length, and γ is a dimensionless numerical prefactor depending on filament geometrical conditions. Here, γ = 1 becasue filaments are considered as rigid rods since their length is smaller than 10 μm, the persistence length of actin filaments.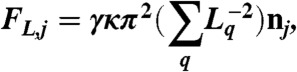
- The drag force FG. We assume that the relative displacement of subnetworks j and k generates frictional forces proportional to the velocity of the displacement
where CT is a friction coefficient.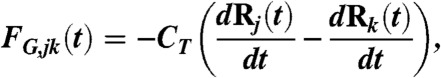
- The entanglement elastic force FE. We define the distance Djk(t) as the distance between subnetworks j and k:
The elastic force due to entanglements thus reads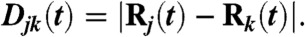
The number of entangled filaments Njk(t) is defined as the number of filaments emanating from subnetwork j and entering the subnetwork k at time t (Fig. S1). The parameter K is a spring constant per filament, and Djk(t1) represents the distance between subnetworks j and k at time t1.
The dynamics of network growth is controlled by balancing all four forces applied to the subnetworks:
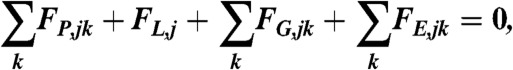 |
where the summation  extends over the neighbors of subnetwork j. Note that the elastic force
  and the drag force
  favor the cohesion of the actin gel, whereas the lifting-up force FL,j favors an outward expansion and the pushing force
  favors a tangential expansion. The mechanical parameters (spring constant K, force constant KA, friction coefficient CT) are once determined to give the best fit of experimental data for conditions: 50 nM of Arp2/3 and 20 nM of CP. These values are used for all other concentration conditions. Unless otherwise stated, K = 100 pN·μm-1, KA = 30 pN, and CT = 1 pN·s·μm-1. The equation of force balance is solved by an implicit second-order method.
Supplementary Material
ACKNOWLEDGMENTS.
We thank Philippe Noguera for his help with the bead assay, Xavier Mezanges for the Matlab scripts, and Julie Plastino for many scientific discussions. We thank François Graner for his critical reading of the manuscript. This work was supported by the Agence Nationale de la Recherche (ANR-08-BLAN-0012-12) and (ANR-08-SYSC-013-03). K.C. thanks the Association pour la Recherche sur le Cancer for his postdoctoral fellowship.
Footnotes
The authors declare no conflict of interest.
This article is a PNAS Direct Submission. A.M. is a guest editor invited by the Editorial Board.
This article contains supporting information online at www.pnas.org/lookup/suppl/doi:10.1073/pnas.1117096109/-/DCSupplemental.
References
- 1.Achard V, et al. A “primer”-based mechanism underlies branched actin filament network formation and motility. Curr Biol. 2010;20:423–428. doi: 10.1016/j.cub.2009.12.056. [DOI] [PubMed] [Google Scholar]
- 2.Machesky LM, et al. Scar, a WASp-related protein, activates nucleation of actin filaments by the Arp2/3 complex. Proc Natl Acad Sci USA. 1999;96:3739–3744. doi: 10.1073/pnas.96.7.3739. [DOI] [PMC free article] [PubMed] [Google Scholar]
- 3.Mullins RD, Machesky LM. Actin assembly mediated by Arp2/3 complex and WASP family proteins. Methods Enzymol. 2000;325:214–237. doi: 10.1016/s0076-6879(00)25445-1. [DOI] [PubMed] [Google Scholar]
- 4.Svitkina TM, Borisy GC. Arp2/3 complex and actin depolymerizing factor/cofilin in dendritic organization and treadmilling of actin filament array in lamellipodia. J Cell Biol. 1999;145:1009–1026. doi: 10.1083/jcb.145.5.1009. [DOI] [PMC free article] [PubMed] [Google Scholar]
- 5.Loisel TP, Boujemaa R, Pantaloni D, Carlier MF. Reconstitution of actin-based motility of Listeria and Shigella using pure proteins. Nature. 1999;401:613–616. doi: 10.1038/44183. [DOI] [PubMed] [Google Scholar]
- 6.Bernheim-Groswasser A, Wiesner S, Golsteyn RM, Carlier M-F, Sykes C. The dynamics of actin-based motility depend on surface parameters. Nature. 2002;417:308–311. doi: 10.1038/417308a. [DOI] [PubMed] [Google Scholar]
- 7.van der Gucht J, Paluch E, Plastino J, Sykes C. Stress release drives symmetry breaking for actin-based movement. Proc Natl Acad Sci USA. 2005;102:7847–7852. doi: 10.1073/pnas.0502121102. [DOI] [PMC free article] [PubMed] [Google Scholar]
- 8.Dayel MJ, et al. In silico reconstitution of actin-based symmetry breaking and motility. PLoS Biol. 2009;7:e1000201. doi: 10.1371/journal.pbio.1000201. [DOI] [PMC free article] [PubMed] [Google Scholar]
- 9.Gerbal F, et al. On the Listeria propulsion mechanism. Pramana-J Phys. 1999;53:155–170. [Google Scholar]
- 10.Paluch E, van der Gucht J, Joanny JF, Sykes C. Deformations in actin comets from rocketing beads. Biophys J. 2006;91:3113–3122. doi: 10.1529/biophysj.106.088054. [DOI] [PMC free article] [PubMed] [Google Scholar]
- 11.Schaus TE, Taylor EW, Borisy GG. Self-organization of actin filament orientation in the dendritic-nucleation/array-treadmilling model. Proc Natl Acad Sci USA. 2007;104:7086–7091. doi: 10.1073/pnas.0701943104. [DOI] [PMC free article] [PubMed] [Google Scholar]
- 12.Carlsson AE. Growth velocities of branched actin networks. Biophys J. 2003;84:2907–2918. doi: 10.1016/S0006-3495(03)70018-6. [DOI] [PMC free article] [PubMed] [Google Scholar]
- 13.Akin O, Mullins RD. Capping protein increases the rate of actin-based motility by promoting filament nucleation by the Arp2/3 complex. Cell. 2008;133:841–851. doi: 10.1016/j.cell.2008.04.011. [DOI] [PMC free article] [PubMed] [Google Scholar]
- 14.Mogilner A. On the edge: Modeling protrusion. Curr Opin Cell Biol. 2006;18:32–39. doi: 10.1016/j.ceb.2005.11.001. [DOI] [PubMed] [Google Scholar]
- 15.Plastino J, Sykes C. The actin slingshot. Curr Opin Cell Biol. 2005;17:62–66. doi: 10.1016/j.ceb.2004.12.001. [DOI] [PubMed] [Google Scholar]
- 16.Sykes C, Plastino J. Cell biology: Actin filaments up against a wall. Nature. 2010;464:365–366. doi: 10.1038/464365a. [DOI] [PubMed] [Google Scholar]
- 17.Sept D, McCammon JA. Thermodynamics and kinetics of actin filament nucleation. Biophys J. 2001;81:667–674. doi: 10.1016/S0006-3495(01)75731-1. [DOI] [PMC free article] [PubMed] [Google Scholar]
- 18.Streichfuss M, et al. Measuring forces between two single actin filaments during bundle formation. Nano Lett. 2011;11:3676–3680. doi: 10.1021/nl201630y. [DOI] [PubMed] [Google Scholar]
- 19.MacKintosh FC, Käs J, Janmey PA. Elasticity of semiflexible biopolymer networks. Phys Rev Lett. 1995;75:4425–4428. doi: 10.1103/PhysRevLett.75.4425. [DOI] [PubMed] [Google Scholar]
- 20.Marcy Y, Prost J, Carlier M-F, Sykes C. Forces generated during actin-based propulsion: A direct measurement by micromanipulation. Proc Natl Acad Sci USA. 2004;101:5993–5997. doi: 10.1073/pnas.0307704101. [DOI] [PMC free article] [PubMed] [Google Scholar]
- 21.Pujol T, du Roure O, Fermigier M, Heuvingh J. Impact of branching on the elasticity of actin networks. Proc Natl Acad Sci USA. 2012;109:10364–10369. doi: 10.1073/pnas.1121238109. [DOI] [PMC free article] [PubMed] [Google Scholar]
- 22.Wu C, et al. Arp2/3 is critical for lamellipodia and response to extracellular matrix cues but is dispensable for chemotaxis. Cell. 2012;148:973–987. doi: 10.1016/j.cell.2011.12.034. [DOI] [PMC free article] [PubMed] [Google Scholar]
- 23.Machesky LM. Sharks’ teeth and dunes. Nature. 2002;417:494–497. doi: 10.1038/417494a. [DOI] [PubMed] [Google Scholar]
Associated Data
This section collects any data citations, data availability statements, or supplementary materials included in this article.