

Abstract
Lymphocytic choriomeningitis virus (LCMV) infection of mice is non-cytopathic, producing well-characterized changes reflecting host immune response. Untargeted metabolomics using mass spectrometry identified endogenous small molecule changes in blood from mice inoculated with LCMV, sampled at days 1, 3, 7 and 14 post infection. These represent well-characterized time points in acute LCMV infection and the immune response. Diverse pathways were altered, including TCA cycle intermediates, γ-glutamyl dipeptides, lysophosphatidyl cholines, and fatty acids. The kynurenine pathway was activated, surprising because it is stimulated by IFN-γ, which LCMV suppresses, thus suggesting alternative activators. In contrast, biopterin/neopterin, another IFN-γ stimulated pathway, was not activated. Many metabolites followed “response and recovery” kinetics, decreasing after infection to a minimum at days 3–7, and returning to normal by day 14. The TCA pathway followed this pattern, including citrate, cis-aconitate and α-ketoglutarate, intriguing because succinate has been shown to mediate cellular immunity. This response and recovery dynamic tracks the immune response, including the rise and fall of natural killer cell populations, serum TNF receptor concentration, and viral clearance. Metabolomics can provide target pathways for molecular diagnostics or therapeutics of viral infection and immunity.
Keywords: untargeted metabolomics, systems biology, mass spectrometry, metabolism, innate immunity
Introduction
Lymphocytic choriomeningitis virus (LCMV), an enveloped RNA virus and the prototypic arenavirus, is a natural pathogen of mice that can be transmitted to humans, and a model virus for study of the immune system 1. LCMV is non-cytopathic, causing little or no disease when inoculated peripherally, and therefore the observed effects reflect the host immune response 2, 3. The time course of acute LCMV infection in adult mice is highly predictable, with a peak of natural killer cell (NK) activity at day 3 post-infection, following a spike in α/β-interferon, and peak viral load at about seven days followed by peak cytotoxic T lymphocyte (CTL) activity at 7–9 days. Most of the virus is cleared by day 14 4.
The infection process and immune response to LCMV in human and primate models have been extensively characterized, including T-cell responses, cytokine responses, and microarray assays of transcriptional profiles in response to infection 5, 6. There are significant differences between the immune response to LCMV and other viruses, such as HIV-1, hepatitis A and hepatitis B. Although an NK response is induced in LCMV, NK cells do not produce detectable levels of interferon-γ(IFN-γ) in plasma7. Induction of IFN-γ is a major component of the host response to most viruses, whereas in LCMV the response is suppressed, along with interleukin-12 by a process thought to be controlled largely by the early kinetics of interferon α/β 8. The coordination mechanism of these responses is not known and thus investigation of how LCMV affects the chemical physiology of the host could provide insight about how these responses are linked, and may provide novel targets for modulating viral infection or immune responses generally.
Metabolomics is a branch of systems biology which involves the profiling and measurement of small molecules. Two metabolomics studies examined viral infection in tissue culture systems, FHV infection of Drosophila cells 9 and human cytomegalovirus (HCMV) infection of fibroblasts 10. These provide measures of the metabolic response at the cellular level, but do not necessarily reflect phenomena at higher levels of organization such as tissue, organ, or organism. System-wide effects or mechanisms involving coordination between tissues and organs, such as activation of the immune response require in vivo studies. Only one study investigated the metabolomic response to viral infection in a whole organism, the progression of monkeys to neuroAIDS and viral encephalitis 11. In this study, we demonstrated widespread lipid-related metabolite alterations in CSF caused by viral encephalitis, and tracked the mechanism to altered phospholipase activity in the brain, changes not previously identified by other methods.
Some specific metabolic changes are associated with the acute immune response. IFN-γ induces indoleamine 2,3-dioxygenase, on the kynurenine pathway, which converts tryptophan to formylkynurenine, reducing tryptophan levels raising kynurenine and quinolinic acid levels 12. The pteridine pathway is stimulated in macrophages by IFN-γ, inducing biopterin and neopterin, markers for the activation of cell-mediated immunity.
Here we apply metabolomics to the murine response to acute infection with LCMV, over a time course from infection through development of the NK/IFN-α/β response, and viral clearance. A non-targeted metabolomics approach identified host changes during the time course of infection. Complementary to the untargeted analysis, specific pathways associated with the immune response were targeted to determine if LCMV infection produced these IFN-γ associated metabolic changes. Fourier transform ion cyclotron mass spectrometry (FT-ICR) was used to assist with metabolite identification. This is the first application of metabolomics to investigate the innate immune response.
Materials and Methods
Adult male C57Bl/6J mice were obtained from the TSRI rodent breeding colony and were inoculated intraperitoneally with 2×10⁵ PFU of LCMV strain Armstrong. LCMV was a gift of Dr. Juan Carlos de la Torre (TSRI) and was grown and titered as described 13. At days 1, 3, 7, and 14 post-inoculation, blood was collected by retroorbital bleed in heparinized collection tubes. Plasma was prepared by spinning blood samples in an Eppendorf microcentrifuge at 2,000× g for 5 minutes at 4°C to remove cells. Plasma was stored at −80°C until analysis. All animals were handled in accordance with Institutional Animal Care and Use Committee (IACUC) guidelines. Two sets of mice were infected with LCMV, the first experiment had n=4 and the second experiment n=2, and were performed six months apart. The metabolomics experiments were then run together and analyzed as a single group at the same time. Due to this experimental design in which samples were collected at different times, the biological variation would be expected to be higher than in a typical experiment involving n=6 animals.
Metabolites were extracted from plasma with methanol. Four volumes of cold methanol were added to 50 μl of plasma, vortexed, and incubated at −20°C for one hour. Samples were centrifuged 10 min. at 14,000 g, the supernatant was collected, and the centrifugation was repeated. The supernatant was dried in a SpeedVac and resuspended in 50 μl 95:5 water:acetonitrile, and clarified for 5 min at 14,000 g.
4 μl of extracted plasma maintained at 4°C in an autosampler was applied to a capillary reversed-phase column (Zorbax C18, Agilent) with dimensions 300 μm internal diameter × 150 mm length. The flow rate was 6 μl/min with solvent A composed of water containing 0.1% formic acid, and solvent B composed of acetonitrile containing 0.1% formic acid. The gradient consisted of 5% B for 5 min, followed by a gradient to 95% B over 45 min, hold at 95% B for 5 min, and a re-equilibration at 5% B for 10 min. The total run time was 60 min with an injection-to-injection time of 65 min. Data were collected separately in positive and negative ion electrospray mode on a TOF 6210 (Agilent) operated in full scan mode from 100–1000 m/z. The capillary voltage was 3000 V, and the fragmentor voltage was 120V, with a scan rate of 0.33 scan/sec; nebulizer pressure was 10 psig, with drying gas at 5 L/min. The parameters were identical for positive and negative mode, except for the polarity.
A third run was performed for more polar metabolites using a Waters T3 column (2.1 mm ID × 150 mm length). The flow rate was 200 μl/min, with identical solvent composition, and a gradient from 0% (hold for 2 min) to 95% B over 20 min, followed by a hold for 1 min at 95% B, a gradient to 10% B over 1 min, at which point the flow rate is increased to 300 μl/min, and a gradient back to 95% B over 5 min, hold for 0.5 min, and a gradient back to 0% B over 1 min, and 5 min for re-equilibration. This method incorporates a wash, and the data collection ends at 30 min, with a total injection-to-injection time of 36.5 min. The MS parameters were capillary 3500V, nebulizer 30 psig, drying gas 10 L/min, gas temp 325°C, fragmentor 120V. The mass range was scanned from m/z 50 – 1000, at ~1 scan/sec. Autotuning, including calibration, was performed immediately before the run.
To reduce systematic error associated with instrument drift, samples were run in random order. Data in instrument specific format were converted to cdf or mzXML format files. The program XCMS 14 was used for non-linear alignment of the data in the time domain and automatic integration and extraction of the peak intensities. The TIC intensity was monitored for large variation, which would indicate changes in instrument sensitivity, and the CV for the experiment was 0.105.
A combination of approaches was used for metabolite identification using mass spectrometry. Firstly, accurate mass information from the TOF (within 5ppm) was available from the profiling data. This accurate mass information was used to search metabolite databases for matches based on mass, and these hits were used to provide a list of “informed guesses” as to the identity of the metabolites of interest. This was followed by LC/MS using a QTOF, reproducing the LC conditions so that the retention time of each metabolite would be the same as from the profiling experiment. Then each metabolite (consisting of an accurate m/z, retention time pair) was targeted for MS/MS using the QTOF.
The experiment used an Agilent 6510 QTOF, with source parameters set identically to those on the TOF. Both the TOF and the quadrupole were tuned, including calibration, immediately before use. After an initial run with a collision energy of 15V, the fragmentation patterns were evaluated and the collision energy adjusted when necessary, and the run repeated. Metabolite standards for comparison were run under identical conditions.
Three metabolomics databases were used for compound identification: METLIN15, LIPIDMAPS16, and HMDB17. In addition, PUBCHEM and SciFinder Scholar were used for chemical searches. KEGG18 was used for pathway analysis. The TCA cycle depicted in Figure 5 was adapted from the figure at: http://en.wikipedia.org/wiki/Citric_acid_cycle.
Figure 5. Changes in the TCA cycle during the LCMV immune response.
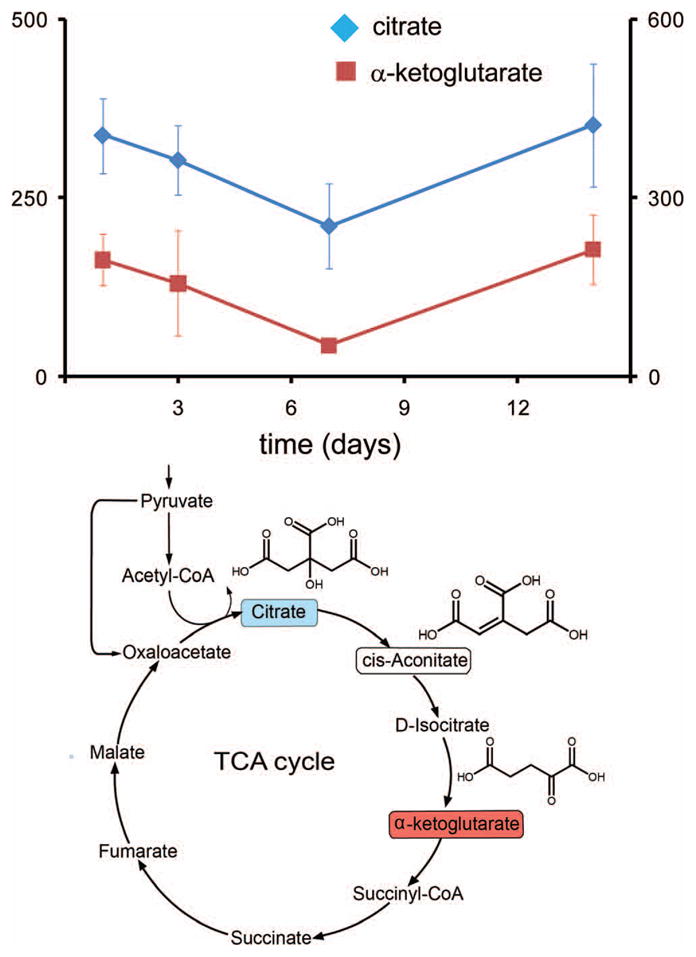
Three metabolites from the TCA cycle (below) were found to change significantly in concentration, and in a concerted fashion, following a response and recovery pattern. (above) Concentrations of citrate (red), α-ketoglutarate (blue) and cis-aconitate (Table II, not shown in figure) decrease at day 3, reaching a minimum concentration at day 7, and return to the initial concentration at day 14. Vertical axes are in relative units of integrated intensity (left, x10,000; right, x1,000). (below) TCA cycle, showing altered compounds (color coding as in graph).
To obtain mass measurements with higher accuracy, the samples were analyzed by LC-ESI- Fourier transform ion cyclotron resonance (FT-ICR) mass spectrometry on a 7.0 T FT-ICR system (Bruker Daltonics). A relative rms error of < 1 ppm was achieved using dual-ESI with reference ions sprayed simultaneously with the column eluant using a customized spray chamber fitted with a second nebulizer. A reference solution was infused through the second nebulizer at 3 μL/min using a syringe pump. Individual spectra extracted from single time points in the LC-FT-ICR experiment were internally calibrated using four or more masses from the reference mix by applying a linear calibration curve. The reference mix consisted of a 1:5 dilution of the Agilent tune mix in acetonitrile. Several other low molecular weight compounds: quinocrine, indoxyl sulfate and 19-hydroxy-17-oxoandrost-5-EN-3-beta-yl sulfate were added at 1μM to generate reference ions to bracket the ions of interest. The use of a single spectrum instead of several averaged spectra is necessary for achieving the highest mass accuracy, since internal calibration corrects for the transient ion population differences in the ICR cell which impart a mass error in measurement. The source was maintained at 200 °C with a drying gas flow of 5 ml/min and nebulizing gas flows were optimized to maximize signal from both ESI probes. A high vacuum of 5.6 × 10⁻¹¹ Torr was achieved in the analyzer region, and argon was introduced at a pressure of 1 × 10⁻⁵ Torr in the external collision cell. A scan range of 183–2000 m/z was used for the analysis and each transient signal was acquired for 0.89 seconds. A one megaword file size was used to provide a high resolving power (>100,000) with a minimal compromise in duty cycle. A scan rate of 1.59 seconds per scan was achieved that included ion accumulation time in the hexapole ion guide for 0.4 seconds for increasing sensitivity through injection of a greater number of ions. One set of ions were accumulated in the hexapole ion guide, while another set was injected to maximize the duty cycle during the relatively long acquisition time required for the FT-ICR for high resolving power. Using accurate masses measured for features of interest in each internally calibrated mass spectrum, a theoretical isotopic pattern, and possible formulas were generated using DataAnalysis software (Bruker Daltonics) using a 2 ppm error window and rules governing the structure of ions with even electrons.
A set of compounds which are implicated in the interferon-mediate immune response were specifically targeted using an Agilent 6410 triple quadrupole mass spectrometer. The gradient was 0% B for 1 min, followed by a gradient to 30% B over 15 minutes. The compounds of interested eluted between 2–16 minutes of the run. The following MRM’s were used for the eight compounds in the following format: precursor → product 1 (collision energy), product 2 (collision energy), etc.. Neopterin 254.1 → 236 (10), 206 (10); biopterin 238 → 220 (15), 194.1 (15), 178.1 (20); 3-OH-kynurenine 225.1 → 162.1 (15), 110.1 (15); kynurenine 209.1 → 146.1 (15), 94 (10); tryptophan 205.1 → 188.1 (5), 146 (15); quinolinic acid 168 → 150 (5), 124 (5), 78 (15); 3-OH-anthranilate 154 → 136 (10), 108 (20), 80 (20); hypoxanthine 137 → 110 (22), 55 (35). The MRM’s and chromatographic retention times were determined by using an authentic standard for each compound. Basic data manipulation and calculations, including t-tests and ANOVA calculations used EXCEL.
Results and Discussion
Two sets of independent experiments were conducted in mice using the same stock of LCMV, separated by six months, the first with n=4 and the second with n=2, and these were analyzed at the same time. Because the samples were collected at two different times, the biological variation is expected to be higher than in a typical n=6 experimental design. Plasma was sampled at four time points during the well-characterized course of infection: at days 1, 3, 7, and 14. These times were chosen to sample the course of the LCMV-induced immune response, in which NK-activity peaks after 3 days 4, viral load peaks at about seven days, and cytotoxic T lymphocyte (CTL) activity peaks at 7–9 days; most virus is cleared by day 14 4.
The basic metabolomics profiling method is outlined in Figure 1a 11. The untargeted metabolomics experiments demonstrated that significant changes occurred in the plasma metabolome of mice during the course of the LCMV-induced acute immune response. These changes included a variety of structural and chemical classes of metabolites, including small, polar molecules, fatty acids, phospholipids, and peptides, on several different metabolic pathways. The compounds displayed different kinetic profiles, depending on metabolite class, but were correlated and synchronized within each metabolic pathway. The most common was the “response and recovery” pattern in which the concentration decreased at days 3 and 7, and returned to at or near the initial level at day 14. In a second pattern, the metabolite concentrations are reduced rapidly and remain low through day 14.
Figure 1. Metabolomics workflow.

(a) Profiling. Mice were infected intraperitoneally with LCMV Armstrong, and plasma was collected at days 1, 3, 7 and 14. Metabolites from plasma were extracted with methanol and applied to a capillary reversed-phase column run with a gradient. Electrospray ionization in positive mode was used, with TOF data collected from m/z 100 to 1,000. Each sample produced a three dimensional data set. Automatic peak finding, followed by nonlinear alignment in the time domain and peak integration, was performed using the XCMS program. A feature table was produced consisting of m/z, retention time, and integrated intensity for each sample. An extracted ion chromatogram was automatically generated for each feature. (b) Compound identification. The compound identification workflow begins (left) with the routine identification of compounds using a QTOF. The LC conditions used in profiling are replicated, and ions of interest (eg those found to be significantly changing over time) For more difficult compounds, Fourier Transform Ion Cyclotron Resonance Mass Spectrometer (FT-ICR) can be used for identification (right). Three aspects of FT-ICR are important: high mass accuracy, high resolution, and MS/MS. When there is no match of the ion to one of the metabolite databases, it is necessary to determine the identity of the compound de novo, the starting point for which is determination of the molecular formula. For this purpose, having high resolution and mass accuracy is essential, and both can be achieved using an FT-ICR instrument. Using LC in combination with a 7 Tesla FT-ICR with internal calibration coming from a dual electrospray configuration, it was possible to obtain a mass accuracy of less than 1 ppm. This accuracy often allows for the calculation of a unique molecular formula, which can substantially narrow the task of compound identification (Table III). This molecular formula can then be used to search chemical databases, such as PUBCHEM. The FT-ICR resolving power was just over 110,000 for the largest metabolites, and exceeded 200,000 for the smaller molecules. The high resolution allows for the measurement of isotopic fine structure (Figure 2), which when compared with a simulated mass spectrum, can be used to confirm the elemental composition that was obtained from the accurate mass measurement, and eliminate candidates if there is more than one possible molecular formula.
Untargeted metabolomics is divided into two stages: profiling and metabolite identification. Probably the most challenging aspect is identification, which begins with only the observed m/z value and chromatographic retention time. Instruments with accurate mass capability such as a time-of-flight (TOF) mass spectrometer, streamline this task by reducing the number of possible compounds corresponding to each mass. Metabolites were identified using a multi-step procedure (Fig. 1b). This involved first using the accurate mass ( < 8ppm) obtained from the TOF profiling data to search metabolite databases, including METLIN15, KEGG18, HMDB17 and LIPIDMAPS16; matches provide an initial hypothesis of molecular identity. Next, the observed isotope pattern is compared with the simulated isotope pattern of the candidates, and then LC/MS/MS using a QTOF mass spectrometer, to compare the fragmentation pattern of the unknown ion with that of the authentic model compound(s) (Fig. 1).
If the mass does not match any of the metabolite databases, a de novo or quasi de novo approach is necessary for identification (Fig. 1b). All possible molecular formulas are calculated within the instrumental mass accuracy, and restricted with an isotope pattern filter. These molecular formulas can be used to search chemical databases, such as PUBCHEM, SciFinder, or Beilstein. As the measured m/z of the compound increases, the number of possible molecular formulas increases and becomes unwieldy; this problem can be controlled by increasing the measured mass accuracy. We addressed this problem by using an FT-ICR Mass Spectrometer, which provides both ultra high resolution and mass accuracy less than 1ppm, for the identification of these difficult unknowns. While the FT-ICR can yield ultra-high resolution and isotopic fine structure, it is subject to space-charge effects during the course of a chromatographic elution and differing ion-populations which can impart a significant mass error for 7.0T mass spectrometers with external calibration. Internal calibration corrects for ion population changes and can provide mass accuracy of < 1 ppm on a 7.0T FT-ICR, while taking full advantage of the very high resolution (>100,000). A custom dual-spray ESI source was developed, in which one channel takes the LC effluent, and the second channel takes a mixture of reference ions delivered with a syringe pump. Dual-spray ESI introduces calibrant ions without ionization suppression or band-broadening which result from post-column calibrant addition.
FT-ICR was used to identify three compounds in this study that could not be identified using the accurate mass from the TOF instrument and MS/MS from the QTOF alone. Two ions that were found to significantly change during the course of LCMV infection were observed in positive ESI mode: m/z 247.13 and 261.15. These had no obvious hits when searching the metabolite databases. Using the observed mass, it is possible to generate a series of molecular formulas within the mass accuracy of the experiment. Even within 8 ppm error, there were multiple possible molecular formulas corresponding to each of these masses. Using a 7T FT-ICR instrument, in combination with internal mass calibration, mass accuracy less than 1 ppm was consistently obtained. The unknown masses were measured as m/z 247.12877 and 261.14428, the mass accuracy allowing each of these ions to be immediately pinpointed to a single molecular formula, C10H18N2O5, and C11H20N2O5, respectively (Table III). The formulas were also confirmed by the presence of isotopic fine structure in the M+2 isotope (Fig. 2a). This additional splitting which is highly characteristic of elemental composition, and in this case the number of nitrogen atoms, cannot be observed in TOF type instruments due to their limited resolution. The similarity of the formulas suggests a structural relationship, and searches in PUBCHEM and SciFinder, filtered by biological compounds, suggested the possibilities that these compounds were the dipeptides Glu-Val or γ-Glu-Val, Glu-Leu, Glu-Ile, or the gamma versions of these. QTOF data were collected and the MS/MS patterns were examined for characteristic amino acid/peptide fragmentation patterns, and indeed, characteristic ESI positive y-ions were found, indicating valine and leucine or isoleucine, respectively (Table I, Fig. 2b). To determine the specific sequence and peptide linkage, MS/MS data were required in negative ion mode, because gamma-glutamyl peptides have distinctive negative ion fragmentation patterns, distinguishing them from the standard peptide linkage 19. Indeed, for both ions, the major CID (QTOF) fragment in negative mode is m/z 128.03, indicating that these are both γ-glutamyl dipeptides. This illustrates the process of combining multiple datasets for the de novo identification of metabolites, including ultra high mass accuracy, ultra high resolution, and multiple fragmentation methods, from untargeted metabolomics profiling, and underscores some of the major technical challenges in identification of metabolites. The dipeptide concentrations follow a response and recovery time course, which decreases 30–40% by day 3, and reaches a minimum of 40–60% on day 7, followed by a recovery by day 14 (Fig. 3). This tracks the kinetics of LCMV infection, which reaches peak viral load at seven days followed by peak CTL activity at 7–9 days, and viral clearance by day 14. Dipeptides have not been extensively characterized in plasma, in part because of the difficulty of identification. The term peptidomics was coined recently to characterize the study of native peptides in biological matrices; plasma peptidomics may be a fertile area for new biomarker discovery 20. γ-glutamylvaline was identified in urine 21 and both γ-glutamylvaline and γ-glutamylisoleucine were isolated from primate brains 22. Gamma glutamyl transferase is an enzyme found in both liver and plasma that transfers the gamma-glutamyl moiety to various amino acids, including the cysteine residue in glutathione. The changes in gamma-glutamyl dipeptides found here suggest possible changes in the concentration or activity of this enzyme during the LCMV viral immune response.
Table III. Identification of metabolites using FTMS.
FTMS was used to obtain ultra high resolution and mass accuracy (with internal calibration from a reference spray). This allowed identification of metabolites which could not be identified from the standard approach of TOF data and database searching. All masses were within 1 ppm error (column 4). With this mass accuracy there are a limited number of possible molecular formulas, thus significantly simplifying the process of metabolite identification.
| molecule ID | m/z observed | m/z calculated | error ppm | ion formula | formulas within 1 ppm | ion mode |
|---|---|---|---|---|---|---|
| γ-glutamyl-Val | 247.12877 | 247.12885 | 0.3 | C10H19N2O5 | 1 | pos |
| γ-glutamyl-Leu | 261.14428 | 261.14450 | 0.8 | C11H21N2O5 | 1 | pos |
| myristoyl lysophosphocholine (14:0) | 468.30880 | 468.30847 | 0.7 | C22H47NO7P | 2 | pos |
| lysophosphocholine (14:0/O-1:0) | 482.32383 | 482.32412 | 0.6 | C23H49NO7P | 2 | pos |
| palmitoleoyl lysophosphocholine (16:1) | 494.32377 | 494.32412 | 0.7 | C24H49NO7P | 2 | pos |
| lysophosphocholine | 512.33490 | 512.33468 | −0.4 | C24H51NO8P | 3 | pos |
| oleoyl lysophosphocholine (18:1) | 522.35548 | 522.35542 | −0.1 | C26H53NO7P | 1 | pos |
| stearoyl lysophosphocholine (18:0) | 524.37057 | 524.37107 | 1.0 | C26H55NO7P | 2 | pos |
| undetermined unsaturated fatty acid | 315.19545 | 315.19547 | 0.1 | C20H27O3 | 1 | pos |
| sebacic acid | 201.11323 | 201.11323 | 0.0 | C10H17O4 | 1 | neg |
Figure 2. Identification of γ-glutamyl dipeptides in plasma.

Because these peptides do not match compounds in the metabolite databases, FTMS was used for identification. The accurate mass within 1 ppm (Table III) indicated unique molecular formulas within this upper limit of mass error of C11H20N2O5 and C10H18N2O5. a) These formulas were confirmed by taking advantage of the ultra high resolution of the FTMS to obtain the isotopic fine structure of the M + 2 isotope, which demonstrates splitting due to the presence of N and O atoms for γ-glutamyl-leucine (top, red arrow), in agreement with the simulated pattern (bottom). Both positive and negative ion MS/MS fragmentation using a QTOF provide complementary information for identification; b) positive mode data provide classic b and y ions and thus the amino acid composition, while c) negative mode fragmentation allows α vs γ peptide linkages to be distinguished. Shown is the match in negative ion mode data for the plasma unknown (c, top) and a γ-glutamyl-leucine standard (c, bottom). A standard glutamyl-leucine dipeptide lacks the major fragment at m/z 128.0 that is found only in the gamma-dipeptides.
Table I. Identification of significant compounds in plasma.
TOF and QTOF data. Compounds were identified using a combination of accurate mass (TOF and QTOF) and MS/MS fragmentation using a QTOF. Data were collected using ESI in either positive or negative mode, or in some cases both modes. All masses were within 9 ppm error without internal calibration (column 4) indicating the stability and robustness of the system. Masses of major MS/MS fragments (column 8) are indicated in decreasing order of intensity, and are in agreement with the fragmentation patterns of authentic standards.
| molecule ID | Formula | m/z obs | ppm err | ESI mode | CE | mode QTOF | major CID fragments |
|---|---|---|---|---|---|---|---|
| γ-glutamyl-Val | C10H18N2O5 | 247.1297 | 3.4 | pos | 15 | pos | 72.080, 118.085, 84.045, 184.094, 230.101, 130.046 |
| γ-glutamyl-Val | C10H18N2O5 | 245.1136 | 2.8 | neg | 15 | neg | 128.034, 116.070, 183.111, 209.091, 227.100 |
| γ-glutamyl-Leu | C11H20N2O5 | 261.1451 | 2.2 | pos | 15 | pos | 86.097, 132.102, 198.111, 244.117 |
| γ-glutamyl-Leu | C11H20N2O5 | 259.1300Q | −0.3 | neg | 15 | neg | 128.035, 197.130, 223.106, 241.119 |
| prolyl-hydroxyproline | C10H16N2O4 | 229.1191 | −3.6 | pos | 20 | pos | 70.066, 132.065 |
| myristoyl lysophosphocholine (14:0) | C22H46NO7P | 468.3102 | 3.7 | pos | 20 | pos | 184.073, 104.107 |
| lysophosphocholine (14:0/O-1:0) | C23H49NO7P | 482.3281Q | −7.1 | pos | 25 | pos | 184.073, 104.107 |
| lysophosphocholine (16:1) | C24H48NO7P | 494.3257 | 3.2 | pos | 20 | pos | 184.073, 104.107 |
| Oleoyl lysophosphocholine (18:1) | C26H52NO7P | 522.3561 | 1.3 | pos | 10 | pos | 104.108, 184.074 |
| Stearoyl lysophosphocholine (18:0) | C26H54NO7P | 524.368 | −5.9 | pos | 20 | pos | 184.075, 104.108 |
| lysophosphocholine | C24H51NO8P | 512.3345 | 1.6 | pos | 20 | pos | 184.074, 104.107 |
| undetermined unsaturated fatty acid | C20H26O3 | 315.1955 | −0.1 | pos | 20 | pos | 187.111, 269.189 |
| sebacic acid | C10H18O4 | 201.1133Q | −0.3 | neg | 15 | neg | 139.114, 183.103 |
| phenyl sulfate | C6H6O4S | 172.9913Q | 0.3 | neg | 15 | neg | 93.035, 79.958 |
| xanthine | C5H4N4O2 | 153.0412 | −3.3 | pos | 20 | pos | 110.035, 136.014, 74.097, 55.030 |
| xanthine | C5H4N4O2 | 151.0260 | 1.0 | neg | 20 | neg | 108.019, 80.025, 65.998 |
| hypoxanthine | C5H4N4O | 137.0464 | 8.4 | pos | 25 | pos | 110.036, 119.036, 55.030, 82.406, 94.041 |
| hypoxanthine | C5H4N4O | 135.0306 | 4.7 | neg | 20 | neg | 92.024, 65.014 |
| citrate | C6H8O7 | 191.0187 | 5.4 | neg | 10 | neg | 111.009, 87.009, 85.030, 57.035 |
| α-ketoglutarate | C5H6O5 | 145.0131 | 7.9 | neg | 5 | neg | 101.023, 57.036 |
| aconitate | C6H6O6 | 173.0086 | 3.3 | neg | 5 | neg | 85.029, 111.008 |
| Qaccurate MS from QTOF |
Figure 3. Time course of γ-glutamyl dipeptides in plasma.

(top) Time course of γ-glutamyl-leucine (red, left axis) and γ-glutamyl-valine (blue, right axis), with standard deviation. The concentrations follow a correlated response and recovery time course, decreasing 40% by day 3, and reaches a minimum of 60% on day 7 (γ-Glu-Val), followed by a recovery by day 14. Vertical axes are in relative units of integrated intensity (x1,000). (bottom) Formation of γ-glutamyl peptides is catalyzed by γ-glutamyltransferase, an enzyme found in both liver and plasma.
Several lysophosphocholines changed significantly in concentration during the immune response. The general trend was that plasma lysophosphocholines decrease in concentration at days 3 and 7 during by as much as 2-fold, returning to pre-infection levels at day 14 (Table II). Both saturated lysophosphocholines, for example myristoyl lysophosphocholine (C14:0) and unsaturated lysophosphocholine, for example C18:1 and C16:1 displayed this pattern. The changes in lysophosphocholines found here are similar to some other systems involving viral infection and inflammation. Up-regulating liver stearoyl-CoA desaturase increases oleic acid and oleoyl lysophosphocholine, inducing the inflammatory response, and suggesting that they protect against pro-inflammatory signaling 23. Plasma lysophosphocholines originate primarily in the liver and are released from larger lipids by phospholipase A2 cleavage24, thus suggesting their reduction in plasma during the immune response may involve regulation by this mechanism in the liver. In a plasma metabolomics study comparing severe viral hepatitis patients versus normal individuals, lysophosphocholines (18:0, 16:0, 18:1, 18:2) were down-regulated in disease, although the extent or statistical significance of the change was specified 25. Lysophosphocholines have been implicated as a factor in immunoregulation 26. Plasma lysophosphocholines were systematically reduced in sepsis 27, and administration to mice in a sepsis model improved survival 28 and reduced organ damage in endotoxic shock 29. Lysophosphocholines are reduced in colorectal cancer 30, but in ovarian cancer, palmitoyl and stearoyl lysophosphatidylcholines were elevated, and oleoyl and linoleoyl lysophosphatidylcholines were reduced 31. Specific metabolites related to lipid metabolism decrease when fibroblasts are infected with HCMV, including carnitine, and glycerol-phosphate, a precursor of phospholipid synthesis 10. This may be functionally analogous to the reduction of lysophospholipids and sebacic acid that we observe in plasma at day 3 and 7 post-infection, although it is not known if the mechanisms are related. We found the alteration is specific for lysophosphocholines: their cognate fatty acids did not change in parallel. For example, myristoyl lysophosphocholine decreased during infection, but myristic acid did not change significantly (ANOVA p-value = 0.14) (Table II).
Table II. Metabolome Dynamics.
Dynamic changes of the metabolome during the experiment are represented as a heat map. Relative intensities or concentrations are scaled to day 1 for each metabolite, and represented as fractional change relative to day 1 concentrations (scale, lower right). The structure of each metabolite is shown, along with the major corresponding metabolic pathway. Metabolites from the same pathway were found to undergo correlative concentration changes, for example the TCA metabolites and purine metabolism intermediates. The significance of the change was determined using a one way ANOVA (p-value).
 |
The only fatty acid that changed significantly during infection was sebacic acid, a dicarboxylic acid. The concentration of sebacic acid changed significantly and substantially during infection (ANOVA p-value 2.9 × 10⁻⁵), with a 45% reduction at day 3, and a three-fold reduction by day 7; by day 14, levels returned to within 10% of day 1. Sebacic acid, the dicarboxylic acid of decanoic acid, arises from the omega hydroxylation of decanoic acid via cytochrome P450 32 and decreases in concentration in response to the nephrotoxin D-serine 33 and is highly elevated in patients with Zellweger syndrome 34. As with the changes in plasma lysophosphocholine, the alteration in plasma concentration of sebacic acid also suggests that the liver is the primary organ system involved.
Reduction of plasma glutamine concentration was associated with the immunocompromised state in athletes and implicated in many aspects of immune function 35. However, there was no significant change in plasma glutamine concentration during the LCMV-induced immune response (ANOVA p-value = 0.33). The possibility that LCMV infection produced changes in kidney function and caused the some of the large metabolomics effects in plasma, was eliminated by examining the relative creatinine concentration during infection, which is a general measure of kidney function. There was no difference in the plasma creatinine concentration at the different time points over the course of the experiment (ANOVA p-value = 0.29). Therefore, renal function should not be a major factor in the differences seen here.
There are two biochemical pathways that were previously identified as being associated with the immune response, and producing changes in plasma small molecule concentrations when stimulated: the tryptophan/kynurenine pathway, and folate/pteridine pathway. IFN-γ, and to a lesser extent IFN-α, induced indoleamine 2,3-diogygenase 12 (IDO), on the kynurenine pathway, depleting tryptophan, and increasing kynurenine and other downstream molecules on the pathway36. It is not known if other interferons can stimulate these pathways or metabolites.
In contrast to other viruses, IFN-γ is not strongly up-regulated during acute LCMV infection 7, being suppressed by the kinetics of IFN α/β expression 8. Therefore, it was not expected that IDO and the kynurenine pathway would be activated. In an experiment separate from the untargeted metabolomics profiling, both kynurenine and pteridine classes of metabolites were targeted to determine whether either of these pathways is activated in acute LCMV infection. A triple quadrupole mass spectrometer was used to target the following metabolites involved in indoleamine dioxygenase activation: tryptophan, kynurenine, 3-hydroxy-kynurenine, 3-hydroxy-anthranilic acid, and quinolinic acid. The folate pathway metabolites neopterin and 6-biopterin were also targeted. Tryptophan, kynurenine, 3-hydroxy-kynurenine, and 3-hydroxyanthranilic acid are part of the kynurenine pathway, which is activated by IFN-γ, during which tryptophan is depleted and the concentrations of the other compounds increases. The plasma kynurenine increased significantly during infection (ANOVA p-value = 0.037) (Table II). The most powerful way of assessing activation of the kynurenine pathway is the kynurenine/tryptophan ratio 36. When kynurenine/tryptophan was measured, the effect is clearly significant (ANOVA p-value = 6.1 × 10⁻⁴), with a 2-fold increase at day 3, and a 3-fold increase at day 7 (Table II). This clearly indicated that the kynurenine pathway was activated during the LCMV-induced immune response. This activation of the kynurenine pathway was surprising, because of the known suppression of the IFN-γ response during acute infection, and the expectation that this pathway is IFN-γ induced. Production of IFN α/β during the immune response regulates other immunomodulatory cytokines, specifically inhibiting production of IFN-γ and interleukin-12, in a manner that depends upon α/β levels and kinetics; this effect is pronounced during LCMV infection 8. Therefore, effects associated with the IFN-γ mediated immune response, such as activation of the kynurenine pathway, were unexpected.
The folate pathway, also stimulated by IFN-γ, was also targeted. GTP-cyclohydrolase, converts GTP to neopterin, which further transformed to biopterin, in macrophages and dendritic cells after IFN-γ stimulation 37. Plasma and urine neopterin levels increase in HIV/AIDS 38, cytomegalovirus infection, hepatitis A and B virus 39, and in other conditions which mediate the Th1 response 38. Neopterin is induced by IFN α/β and was recently shown to be produced in vivo independently of IFN-γ 40, indicating that other factors may be able to stimulate neopterin. Biopterin is biotransformed from neopterin, and similarly increased during the IFN-γ stimulated immune response. In this experiment, neither neopterin nor biopterin, which were measured in a targeted experiment on a triple quadrupole, increased significantly during the LCMV immune response. While biopterin could be measured consistently in all of the samples, neopterin concentrations in plasma were close to the detection limit. Although concentrations could therefore not be measured consistently, if there were a significant increase in concentration, this would have been evident from the experiment. The mean biopterin concentration actually decreased after day 1, and was reduced by almost 3-fold at day 7 (ANOVA p-value = 0.03). Therefore, the folate pathway is not stimulated by LCMV infection.
Two of the most dramatic changes are in the purine metabolism pathway: xanthine, a purine base, and hypoxanthine, which is converted from xanthine by the enzyme xanthine oxidase (Fig. 4). After day 1, the plasma concentration of both hypoxanthine and xanthine drop precipitously, by 5- and 10-fold, respectively on day 3, and by days 7 and 14, have dropped 100-fold. The concentration of hypoxanthine and xanthine remain depleted in plasma, and do not recover during the experiment. Xanthine oxidoreductase, on the purine catabolism pathway, catalyzes the conversion of hypoxanthine to xanthine, which is subsequently converted to urate. Xanthine oxidoreductase is associated with the innate immune response 41, and is activated in response to oxidative stress in lung tissue during influenza virus infection 42. Plasma levels of Xanthine oxidoreductase were elevated in patients with hepatitis C virus infection compared to normal subjects 43. Thus depletion of plasma xanthine and hypoxanthine concentrations in plasma during LCMV infection may be related to these elevated enzyme levels, provide a tantalizing link to virus-induced oxidative stress. There are some parallels between these changes in LCMV and the metabolic changes when HCMV infects fibroblasts. In that system, adenosine and uridine decrease during infection, which is qualitatively similar to the decrease in xanthine and hypoxanthine concentrations found in LCMV 10.
Figure 4. Changes in purine metabolism during the LCMV immune response.

Purine metabolism (bottom, part of pathway shown) intermediates undergo a completely different time course in response to LCMV infection, compared to other measured pathways. Plasma xanthine (blue, left axis) and hypoxanthine (red, right axis) decrease rapidly and substantially in concentration beginning on day 3, and continuing through day 14. Vertical axes are in relative units of integrated intensity (x1000).
Three TCA cycle intermediates were identified that change significantly during infection in the response and recovery pattern described earlier: citrate, α-ketoglutarate, and cis-aconitate (Fig. 5). The plasma concentrations of these compounds changes in a concerted fashion, indicating that there is a systemic alteration of central metabolism at day 7, when viral infection peaks. A recent report indicates that succinate, another TCA cycle intermediate, acts as an extracellular mediator triggering G-coupled receptors and simulating cellular immunity 44.
In conclusion, the concentration of an array of small molecules in plasma tracks the immune response to LCMV infection, with kinetics that can be described as “response and recovery”. These small molecules include two γ-glutamyl dipeptides, four lysophosphocholines, and three TCA cycle intermediates. The purine metabolites xanthine and hypoxanthine, are dramatically reduced, and remain depleted in plasma through day 14. Unlike viral infections that trigger primarily an IFN-γ mediated immune response, the concentration of biopterin did not increase, but there was a dramatic increase in the kynurenine/tryptophan ratio, indicating that indoleamine 2,3-dioxygenase, and the kynurenine pathway were activated. Metabolomics provides a new set of experimental tools for hypothesis generation in immunopathogenesis at the level of systems biology. These metabolic changes provide potential target pathways for molecular diagnostics or therapeutics.
Abbreviations
- LCMV
Lymphocytic choriomeningitis virus
- FT-ICR
Fourier Transform Ion Cyclotron Resonance
- IFN
interferon
- NK
natural killer cells
- ESI
Electrospray ionization
- m/z
mass-to-charge ratio
References
- 1.Oldstone MB. Biology and pathogenesis of lymphocytic choriomeningitis virus infection. Curr Top Microbiol Immunol. 2002;263:83–117. doi: 10.1007/978-3-642-56055-2_6. [DOI] [PubMed] [Google Scholar]
- 2.Buchmeier MJ, Welsh RM, Dutko FJ, Oldstone MB. The virology and immunobiology of lymphocytic choriomeningitis virus infection. Adv Immunol. 1980;30:275–331. doi: 10.1016/s0065-2776(08)60197-2. [DOI] [PubMed] [Google Scholar]
- 3.Guidotti LG, Borrow P, Brown A, McClary H, Koch R, Chisari FV. Noncytopathic clearance of lymphocytic choriomeningitis virus from the hepatocyte. J Exp Med. 1999;189(10):1555–64. doi: 10.1084/jem.189.10.1555. [DOI] [PMC free article] [PubMed] [Google Scholar]
- 4.Welsh RM. Cytotoxic Cells Induced during Lymphocytic Choriomeningitis Virus-Infection of Mice .1. Characterization of Natural Killer Cell Induction. Journal of Experimental Medicine. 1978;148(1):163–181. doi: 10.1084/jem.148.1.163. [DOI] [PMC free article] [PubMed] [Google Scholar]
- 5.Zuniga EI, Hahm B, Oldstone MB. Type I interferon during viral infections: multiple triggers for a multifunctional mediator. Curr Top Microbiol Immunol. 2007;316:337–57. doi: 10.1007/978-3-540-71329-6_16. [DOI] [PubMed] [Google Scholar]
- 6.Kunz S, Rojek JM, Roberts AJ, McGavern DB, Oldstone MB, de la Torre JC. Altered central nervous system gene expression caused by congenitally acquired persistent infection with lymphocytic choriomeningitis virus. J Virol. 2006;80(18):9082–92. doi: 10.1128/JVI.00795-06. [DOI] [PMC free article] [PubMed] [Google Scholar]
- 7.Orange JS, Biron CA. An absolute and restricted requirement for IL-12 in natural killer cell IFN-gamma production and antiviral defense. Studies of natural killer and T cell responses in contrasting viral infections. J Immunol. 1996;156(3):1138–42. [PubMed] [Google Scholar]
- 8.Cousens LP, Orange JS, Su HC, Biron CA. Interferon-alpha/beta inhibition of interleukin 12 and interferon-gamma production in vitro and endogenously during viral infection. Proc Natl Acad Sci U S A. 1997;94(2):634–9. doi: 10.1073/pnas.94.2.634. [DOI] [PMC free article] [PubMed] [Google Scholar]
- 9.Go EP, Wikoff WR, Shen ZX, O'Maille G, Morita H, Conrads TP, Nordstrom A, Trauger SA, Uritboonthai W, Lucas DA, Chan KC, Veenstra TD, Lewicki H, Oldstone MB, Schneemann A, Siuzdak G. Mass spectrometry reveals specific and global molecular transformations during viral infection. Journal of Proteome Research. 2006;5(9):2405–2416. doi: 10.1021/pr060215t. [DOI] [PMC free article] [PubMed] [Google Scholar]
- 10.Munger J, Bajad SU, Coller HA, Shenk T, Rabinowitz JD. Dynamics of the cellular metabolome during human cytomegalovirus infection. Plos Pathogens. 2006;2(12):1165–1175. doi: 10.1371/journal.ppat.0020132. [DOI] [PMC free article] [PubMed] [Google Scholar]
- 11.Wikoff WR, Pendyala G, Siuzdak G, Fox HS. Metabolomic analysis of the cerebrospinal fluid reveals changes in phospholipase expression in the CNS of SIV-infected macaques. J Clin Invest. 2008 doi: 10.1172/JCI34138. [DOI] [PMC free article] [PubMed] [Google Scholar]
- 12.Yasui H, Takai K, Yoshida R, Hayaishi O. Interferon Enhances Tryptophan- Metabolism by Inducing Pulmonary Indoleamine 2,3-Dioxygenase - Its Possible Occurrence in Cancer-Patients. Proceedings of the National Academy of Sciences of the United States of America. 1986;83(17):6622–6626. doi: 10.1073/pnas.83.17.6622. [DOI] [PMC free article] [PubMed] [Google Scholar]
- 13.Dutko FJ, Oldstone MB. Genomic and biological variation among commonly used lymphocytic choriomeningitis virus strains. J Gen Virol. 1983;64 (Pt 8):1689–98. doi: 10.1099/0022-1317-64-8-1689. [DOI] [PubMed] [Google Scholar]
- 14.Smith CA, Want EJ, O'Maille G, Abagyan R, Siuzdak G. XCMS: processing mass spectrometry data for metabolite profiling using nonlinear peak alignment, matching, and identification. Anal Chem. 2006;78(3):779–87. doi: 10.1021/ac051437y. [DOI] [PubMed] [Google Scholar]
- 15.Smith CA, O'Maille G, Want EJ, Qin C, Trauger SA, Brandon TR, Custodio DE, Abagyan R, Siuzdak G. METLIN: a metabolite mass spectral database. Ther Drug Monit. 2005;27(6):747–51. doi: 10.1097/01.ftd.0000179845.53213.39. [DOI] [PubMed] [Google Scholar]
- 16.Fahy E, Sud M, Cotter D, Subramaniam S. LIPID MAPS online tools for lipid research. Nucleic Acids Res. 2007;35(Web Server issue):W606–12. doi: 10.1093/nar/gkm324. [DOI] [PMC free article] [PubMed] [Google Scholar]
- 17.Wishart DS, Tzur D, Knox C, Eisner R, Guo AC, Young N, Cheng D, Jewell K, Arndt D, Sawhney S, Fung C, Nikolai L, Lewis M, Coutouly MA, Forsythe I, Tang P, Shrivastava S, Jeroncic K, Stothard P, Amegbey G, Block D, Hau DD, Wagner J, Miniaci J, Clements M, Gebremedhin M, Guo N, Zhang Y, Duggan GE, Macinnis GD, Weljie AM, Dowlatabadi R, Bamforth F, Clive D, Greiner R, Li L, Marrie T, Sykes BD, Vogel HJ, Querengesser L. HMDB: the Human Metabolome Database. Nucleic Acids Res. 2007;35(Database issue):D521–6. doi: 10.1093/nar/gkl923. [DOI] [PMC free article] [PubMed] [Google Scholar]
- 18.Kanehisa M, Goto S. KEGG: kyoto encyclopedia of genes and genomes. Nucleic Acids Res. 2000;28(1):27–30. doi: 10.1093/nar/28.1.27. [DOI] [PMC free article] [PubMed] [Google Scholar]
- 19.Harrison AG. Characterization of alpha- and gamma-glutamyl dipeptides by negative ion collision-induced dissociation. J Mass Spectrom. 2004;39(2):136–44. doi: 10.1002/jms.515. [DOI] [PubMed] [Google Scholar]
- 20.Tammen H, Peck A, Budde P, Zucht HD. Peptidomics analysis of human blood specimens for biomarker discovery. Expert Rev Mol Diagn. 2007;7(5):605–13. doi: 10.1586/14737159.7.5.605. [DOI] [PubMed] [Google Scholar]
- 21.Buchanan DL, Haley EE, Markiw RT. Occurrence of beta-aspartyl and gamma-glutamyl oligopeptides in human urine. Biochemistry. 1962;1:612–20. doi: 10.1021/bi00910a011. [DOI] [PubMed] [Google Scholar]
- 22.Reichelt KL. The isolation of gamma-glutamyl peptides from monkey brain. J Neurochem. 1970;17(1):19–25. doi: 10.1111/j.1471-4159.1970.tb00497.x. [DOI] [PubMed] [Google Scholar]
- 23.Chen C, Shah YM, Morimura K, Krausz KW, Miyazaki M, Richardson TA, Morgan ET, Ntambi JM, Idle JR, Gonzalez FJ. Metabolomics reveals that hepatic stearoyl-CoA desaturase 1 downregulation exacerbates inflammation and acute colitis. Cell Metab. 2008;7(2):135–47. doi: 10.1016/j.cmet.2007.12.003. [DOI] [PMC free article] [PubMed] [Google Scholar]
- 24.Dennis EA. Diversity of group types, regulation, and function of phospholipase A2. J Biol Chem. 1994;269(18):13057–60. [PubMed] [Google Scholar]
- 25.Yang J, Zhao XJ, Liu XL, Wang C, Gao P, Wang JS, Li LJ, Gu JR, Yang SL, Xu GW. High performance liquid chromatography-mass spectrometry for metabonomics: Potential biomarkers for acute deterioration of liver function in chronic hepatitis B. Journal of Proteome Research. 2006;5(3):554–561. doi: 10.1021/pr050364w. [DOI] [PubMed] [Google Scholar]
- 26.Kabarowski JH, Xu Y, Witte ON. Lysophosphatidylcholine as a ligand for immunoregulation. Biochem Pharmacol. 2002;64(2):161–7. doi: 10.1016/s0006-2952(02)01179-6. [DOI] [PubMed] [Google Scholar]
- 27.Drobnik W, Liebisch G, Audebert FX, Frohlich D, Gluck T, Vogel P, Rothe G, Schmitz G. Plasma ceramide and lysophosphatidylcholine inversely correlate with mortality in sepsis patients. J Lipid Res. 2003;44(4):754–61. doi: 10.1194/jlr.M200401-JLR200. [DOI] [PubMed] [Google Scholar]
- 28.Yan JJ, Jung JS, Lee JE, Lee J, Huh SO, Kim HS, Jung KC, Cho JY, Nam JS, Suh HW, Kim YH, Song DK. Therapeutic effects of lysophosphatidylcholine in experimental sepsis. Nat Med. 2004;10(2):161–7. doi: 10.1038/nm989. [DOI] [PubMed] [Google Scholar]
- 29.Murch O, Collin M, Sepodes B, Foster SJ, Mota-Filipe H, Thiemermann C. Lysophosphatidylcholine reduces the organ injury and dysfunction in rodent models of gram-negative and gram-positive shock. Br J Pharmacol. 2006;148(6):769–77. doi: 10.1038/sj.bjp.0706788. [DOI] [PMC free article] [PubMed] [Google Scholar]
- 30.Zhao ZW, Xiao YJ, Elson P, Tan HY, Plummer SJ, Berk M, Aung PP, Lavery IC, Achkar JP, Li L, Casey G, Xu Y. Plasma lysophosphatidylcholine levels: Potential biomarkers for colorectal cancer. Journal of Clinical Oncology. 2007;25(19):2696–2701. doi: 10.1200/JCO.2006.08.5571. [DOI] [PubMed] [Google Scholar]
- 31.Okita M, Gaudette DC, Mills GB, Holub BJ. Elevated levels and altered fatty acid composition of plasma lysophosphatidylcholine(lysoPC) in ovarian cancer patients. Int J Cancer. 1997;71(1):31–4. doi: 10.1002/(sici)1097-0215(19970328)71:1<31::aid-ijc7>3.0.co;2-4. [DOI] [PubMed] [Google Scholar]
- 32.Gregersen N, Mortensen PB, Kolvraa S. On the biologic origin of C6-C10- dicarboxylic and C6-C10-omega-1-hydroxy monocarboxylic acids in human and rat with acyl-CoA dehydrogenation deficiencies: in vitro studies on the omega- and omega-1- oxidation of medium-chain (C6-C12) fatty acids in human and rat liver. Pediatr Res. 1983;17(10):828–34. doi: 10.1203/00006450-198310000-00013. [DOI] [PubMed] [Google Scholar]
- 33.Williams RE, Major H, Lock EA, Lenz EM, Wilson ID. D-Serine-induced nephrotoxicity: a HPLC-TOF/MS-based metabonomics approach. Toxicology. 2005;207(2):179–90. doi: 10.1016/j.tox.2004.08.023. [DOI] [PubMed] [Google Scholar]
- 34.Bjorkhem I, Blomstrand S, Haga P, Kase BF, Palonek E, Pedersen JI, Strandvik B, Wikstrom SA. Urinary excretion of dicarboxylic acids from patients with the Zellweger syndrome. Importance of peroxisomes in beta-oxidation of dicarboxylic acids. Biochim Biophys Acta. 1984;795(1):15–9. doi: 10.1016/0005-2760(84)90099-7. [DOI] [PubMed] [Google Scholar]
- 35.Li P, Yin YL, Li D, Kim SW, Wu G. Amino acids and immune function. Br J Nutr. 2007;98(2):237–52. doi: 10.1017/S000711450769936X. [DOI] [PubMed] [Google Scholar]
- 36.Schrocksnadel K, Wirleitner B, Winkler C, Fuchs D. Monitoring tryptophan metabolism in chronic immune activation. Clin Chim Acta. 2006;364(1–2):82–90. doi: 10.1016/j.cca.2005.06.013. [DOI] [PubMed] [Google Scholar]
- 37.Huber C, Batchelor JR, Fuchs D, Hausen A, Lang A, Niederwieser D, Reibnegger G, Swetly P, Troppmair J, Wachter H. Immune response-associated production of neopterin. Release from macrophages primarily under control of interferon-gamma. J Exp Med. 1984;160(1):310–6. doi: 10.1084/jem.160.1.310. [DOI] [PMC free article] [PubMed] [Google Scholar]
- 38.Fuchs D, Hausen A, Reibnegger G, Werner ER, Dierich MP, Wachter H. Neopterin as a marker for activated cell-mediated immunity: application in HIV infection. Immunol Today. 1988;9(5):150–5. doi: 10.1016/0167-5699(88)91203-0. [DOI] [PubMed] [Google Scholar]
- 39.Reibnegger G, Auhuber I, Fuchs D, Hausen A, Judmaier G, Prior C, Werner ER, Wachter H. Urinary neopterin levels in acute viral hepatitis. Hepatology. 1988;8(4):771–4. doi: 10.1002/hep.1840080412. [DOI] [PubMed] [Google Scholar]
- 40.Sghiri R, Feinberg J, Thabet F, Dellagi K, Boukadida J, Ben Abdelaziz A, Casanova JL, Barbouche MR. Gamma interferon is dispensable for neopterin production in vivo. Clin Diagn Lab Immunol. 2005;12(12):1437–41. doi: 10.1128/CDLI.12.12.1437-1441.2005. [DOI] [PMC free article] [PubMed] [Google Scholar]
- 41.Vorbach C, Harrison R, Capecchi MR. Xanthine oxidoreductase is central to the evolution and function of the innate immune system. Trends Immunol. 2003;24(9):512–7. doi: 10.1016/s1471-4906(03)00237-0. [DOI] [PubMed] [Google Scholar]
- 42.Peterhans E, Grob M, Burge T, Zanoni R. Virus-induced formation of reactive oxygen intermediates in phagocytic cells. Free Radic Res Commun. 1987;3(1– 5):39–46. doi: 10.3109/10715768709069768. [DOI] [PubMed] [Google Scholar]
- 43.Yamamoto T, Moriwaki Y, Takahashi S, Tsutsumi Z, Yamakita J, Nasako Y, Hiroishi K, Higashino K. Determination of human plasma xanthine oxidase activity by high-performance liquid chromatography. Journal of Chromatography B-Biomedical Applications. 1996;681(2):395–400. doi: 10.1016/0378-4347(96)00071-0. [DOI] [PubMed] [Google Scholar]
- 44.Rubic T, Lametschwandtner G, Jost S, Hinteregger S, Kund J, Carballido-Perrig N, Schwarzler C, Junt T, Voshol H, Meingassner JG, Mao X, Werner G, Rot A, Carballido JM. Triggering the succinate receptor GPR91 on dendritic cells enhances immunity. Nat Immunol. 2008;9(11):1261–9. doi: 10.1038/ni.1657. [DOI] [PubMed] [Google Scholar]