

Abstract
Background
Two important plant pathogenic bacteria Acidovorax oryzae and Acidovorax citrulli are closely related and often not easy to be differentiated from each other, which often resulted in a false identification between them based on traditional methods such as carbon source utilization profile, fatty acid methyl esters, and ELISA detection tests. MALDI-TOF MS and Fourier transform infrared (FTIR) spectra have recently been successfully applied in bacterial identification and classification, which provide an alternate method for differentiating the two species.
Results
Characterization and comparison of the 10 A. oryzae strains and 10 A. citrulli strains were performed based on traditional bacteriological methods, MALDI-TOF MS, and FTIR spectroscopy. Our results showed that the identity of the two closely related plant pathogenic bacteria A. oryzae and A. citrulli was able to be confirmed by both pathogenicity tests and species-specific PCR, but the two species were difficult to be differentiated based on Biolog and FAME profile as well as 16 S rRNA sequence analysis. However, there were significant differences in MALDI-TOF MS and FTIR spectra between the two species of Acidovorax. MALDI-TOF MS revealed that 22 and 18 peaks were specific to A. oryzae and A. citrulli, respectively, while FTIR spectra of the two species of Acidovorax have the specific peaks at 1738, 1311, 1128, 1078, 989 cm-1 and at 1337, 968, 933, 916, 786 cm-1, respectively.
Conclusions
This study indicated that MALDI-TOF MS and FTIR spectra may give a new strategy for rapid bacterial identification and differentiation of the two closely related species of Acidovorax.
Background
Many researches have focused on the specific detection of the two important plant pathogenic bacteria Acidovorax oryzae (formerly Acidovorax avenae subsp. avenae) and Acidovorax citrulli (formerly Acidovorax avenae subsp. citrulli) [1,2]. However, the two species are closely related and often not easy to be differentiated from each other [3,4], which often resulted in a false identification between them based on traditional methods such as carbon source utilization profile, fatty acid methyl esters, PCR and ELISA detection tests [1,5]. Therefore, it is necessary to develop an alternate method for differentiating the two species.
Recently, MALDI-TOF MS and Fourier transform infrared (FTIR) spectra have been successfully applied in bacterial identification and classification [6-11]. MALDI-TOF MS allows bacterial identification at the species level by measuring molecular masses of proteins and other bacterial components obtained from whole bacterial extracts, while FTIR spectroscopy allows the analysis of small quantities of biomass, simultaneous characterization of different functional groups such as lipids, proteins, nucleic acids and polysaccharides in biological molecules and complex structures and without disturbing the systems, and requires no consumables or reagents [6,12,13]. However, little information was obtained about the applications of MALDI-TOF MS and FTIR spectra in plant pathogenic bacteria.
The objective of this study was to examine and compare the MALDI-TOF MS and FTIR spectra of bacteria from the two species of Acidovorax.
Methods
Bacterial strains
The 10 virulent strains of A. oryzae used in this study were isolated from diseased rice seed and seedling, while the 10 virulent strains of A. citrulli were isolated from diseased watermelon and melon (Table 1). The identities of bacterial strains were determined and confirmed based on the biochemical and physiological characteristics as described by Krieg and Holt [14] and Schaad et al. [15], whole-cell fatty acid and Biolog metabolic assays as described by Li et al. [3,16,17], species-specific PCR[1,15,18] and 16 S ribosomal RNA gene sequence analysis [3,16,17]. The representative A. oryzae strain R1001 (Collection no: ACCC05733) and A. citrulli strain Ab1 (Collection no: ACCC05732) were deposited in Agricultural Culture Collection of China (ACCC).
Table 1.
Strains of Acidovorax oryzae (Ao) and Acidovorax citrulli (Ac) used in this study
| Ao strains | Sources | Ac strains | Sources |
|---|---|---|---|
| R1001 |
Rice seedling, this lab |
A1 |
Watermelon leaf, CAAS, China |
| R1002 |
Rice seedling, this lab |
Aacf |
Watermelon leaf, FAFFU, China |
| R1003 |
Rice seedling, this lab |
Ab1 |
Watermelon leaf, this lab |
| R1004 |
Rice seedling, this lab |
Njf4 |
Watermelon leaf, NAU, China |
| CB97012 |
Rice seeds, this lab |
Ps96 |
Watermelon leaf, CAAS, China |
| CB97058 |
Rice seeds, this lab |
Ab3 |
Melon leaf, this lab |
| CB97063 |
Rice seeds, this lab |
Tw20 |
Melon leaf, CAAS, China |
| CB97181 |
Rice seeds, this lab |
Ab5 |
Melon leaf, this lab |
| CB97095 |
Rice seeds, this lab |
Ab8 |
Melon leaf, this lab |
| CB97128 | Rice seeds, this lab | Ab9 | Melon leaf, this lab |
CAAS: Chinese Academy of Agricultural Sciences; FAFFU: Fujian Agricultural and Forestry University; NAU: Nanjing Agricultural University.
MALDI-TOF MS
Sample preparation
One loop of bacterial cells grown on Luria-Bertani at 30°C for 48 h was suspended in 300 μl of Millipore water followed by adding 900 μl of absolute ethanol. Cell pellets were obtained by a centrifugation at 12000 rpm for 2 min and suspended in 50 μl of formic acid (70% v/v) followed by carefully adding 50 μl of acetonitrile. One microliter of supernatant after a centrifugation at 12000 rpm for 2 min was spotted on a steel target plate (Bruker Daltonic, Billerica, Massachusetts) and air dried at room temperature. Afterwards, 1 μl of matrix solution (saturated solution of α-cyanohydroxycinnaminic acid in 50% aqueous acetonitrile containing 2.5% trifluoroacetic acid) was quickly added onto the surface of each sample spot. Samples were prepared in duplicate.
MALDI-TOF MS analysis
Mass spectrometric measurements were preformed with an AUTOFLEX Analyzer (Bruker Daltonics) as described in previous studies using the linear positive ion extraction [10,11,19]. The method of identification included the m/z from 2 to 12 kDa. Escherichia coli DH5α was used as an external protein calibration mixture followed by the Bruker Test Standard [20]. Raw mass spectrum smooth, baseline correction and peak detection were performed using the corresponding programs installed in the MS system. Resulting mass fingerprints were exported to FLEX ANALYSIS (Bruker Daltonics) and analyzed. Spectral data were investigated for the presence of biomarkers characteristic for each of the two Acidovorax species. After visual inspection and comparison, the most intensive and predominantly present protein peaks were selected and screened in representatives of each species.
FTIR spectroscopy
Sample preparation
Bacterial cells were collected from overnight Luria-Bertani broth culture grown at 28°C by centrifugation at 10,000 rpm for 10 min. After removing the supernatants, the bacterial pellets were washed twice with double distilled water. After second wash in double distilled water, bacterial samples were stored at −70°C until lyophilisation. The samples for FTIR analysis were first grounded into fine particles using mortar and pestle. The 1 mg of each sample was then mixed with 100 mg potassium bromide (KBr) which extensively dried in microfuge tubes using a lyophiliser. These mixtures have been dried for an additional 2 h in the same microfuge tubes. The KBr based pellets were then compressed into a thin disk by establishing pressure of 100 kg/cm2 (1200 psi) for about 8 min.
FTIR spectroscopy and data analysis
The FTIR spectroscopy data were analysed as previously described by Garip et al. [21] with a small modification. Pellets were scanned at 4 cm-1 resolution with 100 scans in the spectral range of 4000–500 cm-1 at room temperature. The sample compartment in the FTIR spectrometer was continuously purged with dry air to prevent water vapour. Analysis of the spectral data was performed by using Grams 32 (Galactic Industries, Salem, NH, USA) software. The spectral range of 4000–500 cm-1 was analyzed. The band positions were measured according to the center of weight. The averages of the spectra belonging to the same experimental groups, baseline correction, normalisation and the band areas were obtained by using the same software program. The average spectra and normalisation process were applied only for visual representation of the differences, however for the determination of the spectral parameters and calculation of mean values and statistical analysis each baseline corrected original spectrum was taken into consideration.
Statistics
The software STATGRAPHICS Plus, version 4.0 (Copyright Manugistics Inc., Rockville, Md., USA) was used to perform the statistical analysis. Levels of significance (p < 0.05) of main treatments and their interactions were calculated by analysis of variance after testing for normality and variance homogeneity.
Results and discussion
Bacterial identity
Results from this study indicated the rice strains should be identified as A. oryzae with Biolog similarity of 0.72 to 0.73, FAME similarity of 0.73 to 0.74, 16 S rRNA sequence similarity of 99% and confirmed by both pathogenicity tests and species-specific PCR, while the watermelon and melon strains should be identified as A. citrulli with Biolog similarity of 0.70 to 0.73, FAME similarity of 0.73 to 0.74, 16 S rRNA sequence similarity of 99%, and confirmed by both pathogenicity tests and species-specific PCR in the newly proposed classification of subspecies of A. avenae. However, in general, the two species of Acidovorax were high similar, and difficult to be differentiated based on Biolog and FAME profile as well as 16 S rRNA sequence analysis.
MALDI-TOF MS
MALDI-TOF MS characterization of bacteria is based on differences in mass to charge ratio (m/z) fingerprints of whole cell proteins, mainly representing ribosomal proteins which are most abundantly expressed under all growth conditions [22]. In this type of mass spectrometry, samples were prepared by embedding analyte molecules in a crystal matrix of small acidic molecules. A brief laser pulse irradiates the sample and the matrix absorbs the laser energy resulting in ablation of a small volume of matrix and desorption of the embedded analyte molecules which are ionized. Subsequently, predominantly single charged analyte ions can be detected and analyzed [23].
Figure 1 presents a typical MALDI-TOF MS spectrum for the two species, which contain a contiguous sequence of about high-intensity ion peaks between 2000 and 12,000 Da. The obtained spectral profiles were further screened for the presence of recurring peaks or biomarker ions specific for both the species. Fifty selected m/z values were summarized in Table 2, while ten m/z values were detected in both species, making them characteristic for the genus Acidovorax. In addition, MALDI-TOF MS revealed that 22 and 18 peaks were specific to A. oryzae and A. citrulli, respectively (Table 2, Figure 1). These unique peaks for each species offer a strong proof in differentiating the two species. This result is consistent with the review of Moore et al. [24], which found that MALDI-TOF MS is a valuable and reliable tool for microbial identification in a number of studies.
Figure 1.
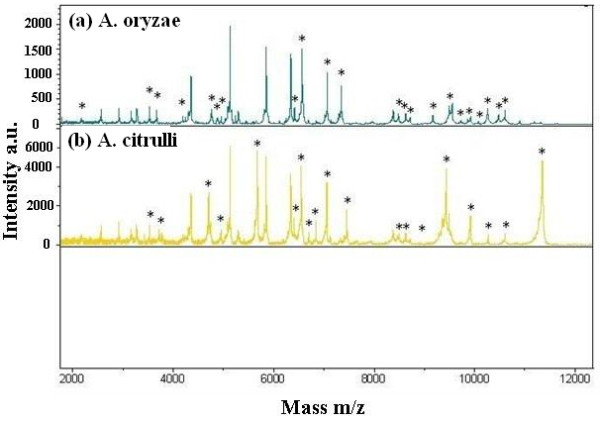
MALDI-TOF MS protein mass fingerprints of Acidovorax oryzae and Acidovorax citrulli. Similar and different marker masses for the identification of A. oryzae and A. citrulli are listed in Table 2. Intensity of ions is shown on the y axis and the mass (in Daltons) of the ions is shown on the x axis. The m/z values represent mass-to charge ratios. *: Unique peaks positions for each of species.
Table 2.
Characteristic MALDI-TOF masses (in Daltons) selected as possible biomarkers for identification of Acidovorax oryzae (Ao) and Acidovorax citrulli (Ac)
| Ao | Ac | Ao | Ac |
|---|---|---|---|
| 2178 |
|
|
6703 |
|
2568 |
2565 |
|
6845 |
|
2932 |
2930 |
|
7055 |
|
3169 |
3168 |
7067 |
|
|
3281 |
3285 |
7349 |
|
| |
3524 |
|
7461 |
| 3533 |
|
8387 |
8381 |
| 3675 |
|
8486 |
|
| |
3729 |
|
8494 |
| 4184 |
|
|
8636 |
|
4353 |
4351 |
8642 |
|
| |
4716 |
8709 |
|
| 4777 |
|
9181 |
|
| 4885 |
|
9545 |
|
| |
4956 |
|
9503 |
| 4965 |
|
9746 |
|
|
5135 |
5133 |
|
9919 |
|
5304 |
5305 |
9935 |
|
| |
5674 |
10097 |
|
|
5863 |
5861 |
10260 |
|
|
6339 |
6337 |
|
10271 |
| |
6413 |
10503 |
|
| 6420 |
|
|
10608 |
| |
6550 |
10609 |
|
| 6568 | 11349 |
Masses observed in both species are marked in bold while species unique mass values marked in Figure 1. Assigned proteins calculated using RMIDb.
FTIR spectroscopy
In agreement with the result of bacteriological characterization, the 10 strains of A. oryzae had a very similar FTIR spectrum while the 10 strains of A. citrulli had a very similar FTIR spectrum regardless of bacterial origin (data not shown), indicating the stability and reliability of the FTIR spectroscopic system. In addition, characterization and differentiation of the two species were performed based on the average FTIR spectrum of the 10 A. oryzae strains and the 10 A. citrulli strains, respectively (Figure 2). In general, there were significant differences in both the frequency and the intensity values of the 10 main functional groups between the two species except the frequency of PO2- asymmetric stretching (Table 3), which indicated that the method of FTIR spectrum maybe have a higher level of differentiation between the two species compared to the biochemical and physiological characteristics tested in this study.
Figure 2.

The average FTIR spectra in the 4000–500 cm-1region for both Acidovorax oryzae (n = 10) and Acidovorax citrulli (n = 10).
Table 3.
The band frequencies and absorption intensity of various functional groups in the Acidovorax oryzae (Ao) and Acidovorax citrulli (Ac) strains
| Functional groups |
Frequency (cm-1) |
Intensity |
||||
|---|---|---|---|---|---|---|
| Ao (n = 10) | Ac (n = 10) | P -value | Ao (n = 10) | Ac (n = 10) | P -value | |
| CH3 asymmetric stretching |
2965.25 ± 0.35 |
2962.68 ± 0.14 |
*** |
1.14 ± 0.02 |
1.19 ± 0.02 |
* |
| CH2 asymmetric stretching |
2930.14 ± 0.26 |
2927.85 ± 0.23 |
*** |
1.23 ± 0.02 |
1.25 ± 0.01 |
* |
| CH3 symmetric stretching |
2873.22 ± 0.47 |
2875.97 ± 0.36 |
*** |
0.83 ± 0.01 |
0.89 ± 0.02 |
* |
| CH2 symmetric stretching |
2853.15 ± 0.36 |
2855.22 ± 0.56 |
*** |
0.74 ± 0.05 |
0.86 ± 0.07 |
** |
| Amide I |
1653.85 ± 0.21 |
1651.61 ± 0.14 |
*** |
2.97 ± 0.15 |
1.84 ± 0.25 |
*** |
| Amide II |
1542.53 ± 0.33 |
1539.82 ± 0.11 |
*** |
1.98 ± 0.25 |
1.57 ± 0.36 |
** |
| CH2 bending |
1453.61 ± 0.43 |
1452.14 ± 0.14 |
** |
0.90 ± 0.03 |
0.96 ± 0.02 |
* |
| COO- symmetric stretch |
1394.20 ± 0.36 |
1397.09 ± 0.25 |
*** |
0.98 ± 0.02 |
0.92 ± 0.05 |
* |
| PO2- asymmetric stretching |
1239.61 ± 0.12 |
1239.48 ± 0.19 |
0.12 |
1.01 ± 0.02 |
0.91 ± 0.02 |
* |
| PO2- symmetric stretching | 1058.65 ± 1.78 | 1080.02 ± 0.56 | *** | 1.14 ± 0.19 | 0.89 ± 0.08 | *** |
Data are the mean of the 10 strains. *: p < 0.05, **: p < 0.01, ***: p < 0.001.
The average spectra in the 4000–500 cm-1 region indicated that the A. oryzae strains have a higher frequency of the CH3 asymmetric stretching vibration at 2959 cm-1, the CH2 asymmetric stretching vibration at 2927 cm-1, the Amide I band at 1657 cm-1, Amide II band at 1541 cm-1, and the CH2 bending band at 1452 cm-1 compared to the A. citrulli strains, while the A. citrulli strains have a higher frequency of the CH3 symmetric stretching vibration at 2876 cm-1, the CH2 symmetric stretching vibration at 2857 cm-1, the COO- symmetric stretch band at 1391 cm-1 and the PO2- symmetric stretching; phospholipids C-O stretch band at 1080 cm-1 compared to the A. oryzae strains (Figure 2; Table 3; Additional file 1). In addition, the A. oryzae strains have a higher intensity of the absorption in the Amide I band at 1657 cm-1, Amide II band at 1541 cm-1, the COO- symmetric stretch band at 1391 cm-1, the PO2- asymmetric stretching band at 1236 cm-1, the PO2- symmetric stretching; phospholipids C-O stretch band at 1080 cm-1 compared to the A. citrulli strains, while the A. citrulli strains have a higher intensity of the absorption in the CH3 asymmetric stretching vibration at 2959 cm-1, the CH2 asymmetric stretching vibration at 2927 cm-1, the CH3 symmetric stretching vibration at 2876 cm-1, the CH2 symmetric stretching vibration at 2857 cm-1, the CH2 bending band at 1452 cm-1 compared to the A. oryzae strains. However, there was not significant difference in the frequency value of the PO2- asymmetric stretching band at 1236 cm-1 between the two species (Figure 2; Table 3; Additional file 1).
The average spectra in the 2800–1800 cm-1 region were not detailed compared between the two species for no obvious peaks were found in the region (Figure 2; Table 3). Interestingly, this result indicated that five distinctive peaks around at 1738, 1311, 1128, 1078 and 989 cm-1 was observed in the A. oryzae strains, but not in the A. citrulli strains, while five distinctive peaks centered at 1337, 968, 933, 916 and 786 cm-1 was only observed in the A. citrulli strains, but not in the A. oryzae strains (Figure 2; Table 3; Additional file 1). These characteristic peaks are specific to either the A. citrulli strains or the A. oryzae strains. Therefore, it could be suggested that these characteristic peaks may be able to be used for the discrimination of the two species of Acidovorax.
Previous related reports have revealed that the prominent peak centered at 2959 cm-1 is mainly due to lipids, the prominent peak centered at 2927 cm-1 is mainly due to lipids and with little contribution from proteins, carbohydrates and nucleic acids, the prominent peak centered at 2876 cm-1 is mainly due to proteins, the prominent peak centered at 2857 cm-1 is mainly due to lipids, the band centered at 1739 cm-1 is mainly assigned to the C = O ester stretching vibration of triglycerides, the bands centered at 1657 cm-1 is mainly assigned to the stretching C = O (amide I) vibrational modes of the polypeptide and protein backbone, the band centered at 1541 cm-1 is mainly assigned to the bending N-H and stretching C-N (amide II), the band at 1452 cm-1 is mainly assigned to the CH2 bending mode of lipids [6-9,12,13,25-29], the band at around 1337 cm-1 was due to acetic acid which was produced by an acetate oxidation [30], the bands at 968, 933 and 916 cm-1 were assigned to the vibration of C-O-C ring deoxyribose, the lipid C = O stretching vibration band at 1738 cm-1 has been suggested as indicative of an increased concentration and difference in packing of the ester groups in bacteria [31]. Furthermore, the band at 1311 cm-1 was due to the stretching mode of C–O of carboxylic acids which suggested an exopolymer formation in bacteria [32], while these bands at 1128, 1078 and 989 cm-1 were due to DNA and RNA backbones, glycogen, and nucleic acids, respectively [6,21]. Therefore, the difference of FTIR spectra between the two species may be due mainly to the imparity of the macromolecular composition and concentration.
This study revealed that the protein-to-lipid ratio was significantly higher for the A. oryzae strains than for the A. citrulli strains in this study (Figure 2; Table 4), which was calculated by taking the ratio of the area of the CH3 symmetric stretching band at 2876 cm-1 to the area of the CH3 asymmetric stretching band at 2959 cm-1[6,21]. In agreement with the result of the protein-to-lipid ratio, the ratio of DNA-to-protein was higher for the A. citrulli strains than for the A. oryzae strains (Figure 2; Table 4), which was calculated by taking the ratio of the area of PO2- symmetric stretching band at 1080 cm-1 to the area of the band at 1541 cm-1[6,21].
Table 4.
The band area values of various functional groups and protein/lipid ratio values in Acidovorax oryzae (Ao) and Acidovorax citrulli (Ac) strains
| Functional groups | Ao (n = 10) | Ac (n = 10) | P-value |
|---|---|---|---|
| Band area value | |||
| CH3 asymmetric stretching |
0.152 ± 0.002 |
0.183 ± 0.010 |
* |
| CH3 symmetric stretching |
0.053 ± 0.004 |
0.036 ± 0.002 |
* |
| Amide I |
3.603 ± 0.021 |
1.668 ± 0.036 |
*** |
| Amide II |
1.931 ± 0.012 |
1.150 ± 0.011 |
** |
| PO2- asymmetric stretching |
0.379 ± 0.062 |
0.801 ± 0.008 |
** |
| PO2- symmetric stretching |
1.061 ± 0.051 |
1.182 ± 0.036 |
** |
| Protein/lipids ratio | |||
| CH3 symmetric/CH3 asymmetric |
0.349 ± 0.044 |
0.196 ± 0.015 |
*** |
| DNA/Protein ratio | |||
| PO2- asymmetric/Amide II | 0.196 ± 0.006 | 0.697 ± 0.007 | *** |
Data are the mean of the 10 strains. *: p < 0.05, **: p < 0.01, ***: p < 0.001.
The ratio of protein-to-lipid in the membranes is an important factor affecting the membrane structure and dynamics [33]. Interestingly, the frequency of Amide I and Amide II has been regarded as indicative of conformation and structure of cellular proteins [31,34], while the absorption intensity of Amide I and Amide II has been regarded as indicative of protein content in bacterial cells [6,21]. However, in this study, the A. oryzae strains not only have a higher value in the frequency and the absorption intensity of both Amide I and Amide II, but also in the triglyceride content that is indicative of the lipids compared to the A. citrulli strains. Therefore, the major contribution to the higher protein-to-lipid ratio in the A. oryzae strains comes from the significant increase of the area of both Amide I and Amide II.
Conclusions
In summary, our results indicated that there were significant differences in MALDI-TOF MS and FTIR spectra between the two species. In particular, several specific characteristic peaks were determined for each of the two species. Compared to the traditional time-consuming method, MALDI-TOF MS and FTIR spectroscopy is easy to implement and is an emergent physico-chemical technique in bacterial research. Therefore, result from this study may give a new strategy for the rapid bacterial identification and differentiation of the two species of Acidovorax.
Competing interests
None declared.
Authors’ contributions
Wang YL and Li B designed the experiments and wrote the paper. Liu BP, Zhou Q, Wu GX and Ibrahim M performed the experiments. Xie GL, Li HY and Sun GC coordinated the project. All authors have read and approved the manuscript.
Supplementary Material
The average FTIR spectra in the 4000–2800 cm-1(a); 1800–1400 cm-1(b); 1400–1000 cm-1(c); 1000–500 cm-1(d) region for both Acidovorax oryzae (n = 10) and Acidovorax citrulli (n = 10).
Contributor Information
Yanli Wang, Email: wangylaa@yahoo.com.cn.
Qing Zhou, Email: zhou-0725-qing@163.com.
Bin Li, Email: libin0571@zju.edu.cn.
Baoping Liu, Email: lbploveme@163.com.
Guoxing Wu, Email: wugx1@163.com.
Muhammad Ibrahim, Email: ibrahim@ciitsahiwal.edu.pk.
Guanlin Xie, Email: glxie@zju.edu.cn.
Hongye Li, Email: hyli@zju.edu.cn.
Guochang Sun, Email: sungc01@sina.com.
Acknowledgements
This work was supported by Zhejiang Provincial Natural Science Foundation of China (Y3090150), Zhejiang Provincial Project (2010R10091), the Fundamental Research Funds for the Central Universities, the Agricultural Ministry of China (nyhyzx 201003029; 201003066), and Key Subject Construction Program of Zhejiang for Modern Agricultural Biotechnology and Crop Disease Control (2010DS700124-KF1101).
References
- Walcortt RD, Gitaitis RD. Detection of Acidovorax avenae subsp. citrulli in watermelon seed using immunomagnetic sparation and the polymerase chain reaction. Plant Dis. 2000;84:470–474. doi: 10.1094/PDIS.2000.84.4.470. [DOI] [PubMed] [Google Scholar]
- Zhao LH, Wang X, Xie GL, Xu FS, Xie GX. Detection for pathogen of bacterial fruit blotch of watermelon by immuno-capture PCR. J Agr Biotechnol. 2006;14:946–951. [Google Scholar]
- Li B, Liu BP, Yu RR, Tao ZY, Wang YL, Xie GL, Li HY, Sun GC. Bacterial brown stripe of rice in soil-less culture system caused by Acidovorax avenae subsp. avenae in China. J Gen Plant Pathol. 2011;77:64–67. doi: 10.1007/s10327-010-0280-z. [DOI] [Google Scholar]
- Xie GL, Zhang GQ, Liu H, Lou MM, Tian WX, Li B, Zhou XP, Zhu B, Jin GL. Genome sequence of the rice pathogenic bacterium Acidovorax avenae subsp. avenae RS-1. J Bacteriol. 2011;193:5013–5014. doi: 10.1128/JB.05594-11. [DOI] [PMC free article] [PubMed] [Google Scholar]
- Xu LH, Qiu W, Zhang WY, Li B, Xie GL. Identification of the causal organism of bacterial brown stripe from rice seedling. Chinese J Rice Sci. 2008;22:302–306. [Google Scholar]
- Garip S, Cetin GA, Severcan F. Use of Fourier transform infrared spectroscopy for rapid comparative analysis of Bacillus and Micrococcus isolates. Food Chem. 2009;113:1301–1307. doi: 10.1016/j.foodchem.2008.08.063. [DOI] [Google Scholar]
- Samelis J, Bleicher A, Delbes-Paus C, Kakouri A, Neuhaus K, Montel MC. FTIR-based polyphasic identification of lactic acid bacteria isolated from traditional Greek Graviera cheese. Food Microbiol. 2011;28:76–83. doi: 10.1016/j.fm.2010.08.009. [DOI] [PubMed] [Google Scholar]
- Wang J, Kim KH, Kim S, Kim YS, Li QX, Jun S. Simple quantitative analysis of Escherichia coli K-12 internalized in baby spinach using Fourier Transform Infrared spectroscopy. Int J Food Microbiol. 2010;144:147–151. doi: 10.1016/j.ijfoodmicro.2010.09.013. [DOI] [PubMed] [Google Scholar]
- Vodnar DC, Socaciu C, Rotar AM, Stanila A. Morphology, FTIR fingerprint and survivability of encapsulated lactic bacteria (Streptococcus thermophilus and Lactobacillus delbrueckii subsp. bulgaricus) in simulated gastric juice and intestinal juice. Int J Food Sci Tech. 2010;45:2345–2351. doi: 10.1111/j.1365-2621.2010.02406.x. [DOI] [Google Scholar]
- Lista F, Reubsaet FAG, De Santis R, Parchen RR, de Jong AL, Kieboom J, van der Laaken AL, Voskamp-Visser IAI, Fillo S, Jansen HJ, Van der Plas J, Paauw A. Reliable identification at the species level of Brucella isolates with MALDI-TOF-MS. BMC Microbiol. 2011;11:267. doi: 10.1186/1471-2180-11-267. [DOI] [PMC free article] [PubMed] [Google Scholar]
- Ayyadurai S, Flaudrops C, Raoult D, Drancourt M. Rapid identification and typing of Yersinia pestis and other Yersinia species by matrix-assisted laser desorption/ionization time-of-flight (MALDI-TOF) mass spectrometry. BMC Microbiol. 2010;10:285. doi: 10.1186/1471-2180-10-285. [DOI] [PMC free article] [PubMed] [Google Scholar]
- Toyran N, Lasch P, Naumann D, Turan B, Severcan F. Early alterations in myocardia and vessels of the diabetic rat heart: An FTIR microspectroscopic study. Biochem J. 2006;397:427–436. doi: 10.1042/BJ20060171. [DOI] [PMC free article] [PubMed] [Google Scholar]
- Lau NS, Tsuge T, Sudesh K. Formation of new polyhydroxyalkanoate containing 3-hydroxy-4-methylvalerate monomer in Burkholderia sp. Appl Microbiol Biotechnol. 2011;89:1599–1609. doi: 10.1007/s00253-011-3097-6. [DOI] [PubMed] [Google Scholar]
- Krieg NR, Holt JG. Bergey’s Manual of Systematic Bacteriology. Williams and Wilkins, Baltimore; 1984. [Google Scholar]
- Schaad NW, Postnikova E, Sechler A, Claflin LE, Vidaver AK, Jones JB, Agarkova I, Ignatov A, Dickstein E, Ramundo BA. Reclassification of subspecies of Acidovorax avenae as A. avenae (Manns 1905) emend., A. cattleyae (Pavarino, 1911) comb. nov., A. citrulli (Schaad et al., 1978) comb. nov., and proposal of A. oryzae sp. nov. Syst Appl Microbiol. 2008;31:434–446. doi: 10.1016/j.syapm.2008.09.003. [DOI] [PubMed] [Google Scholar]
- Li B, Xie GL, Zhang JZ, Janssens D, Swings J. Identification of the bacterial leaf spot pathogen of poinsettia in China. J Phytopathol. 2006;151:711–715. [Google Scholar]
- Li B, Yu RR, Yu SH, Qiu W, Fang Y, Xie GL. First report on bacterial heart rot of garlic caused by Pseudomonas fluorescens in China. Plant Pathol J. 2009;25:91–94. doi: 10.5423/PPJ.2009.25.1.091. [DOI] [Google Scholar]
- Song WY, Kim HM, Hwang CY, Schaad NW. Detection of Acidovorax avenae ssp. avenae in rice seeds using BIO-PCR. J Phytopathol. 2004;152:667–676. doi: 10.1111/j.1439-0434.2004.00914.x. [DOI] [Google Scholar]
- Decristophoris P, Fasola A, Benagli C, Tonolla M, Petrini O. Identification of Staphylococcus intermedius group by MALDI-TOF MS. Syst Appl Microbiol. 2011;34:45–51. doi: 10.1016/j.syapm.2010.11.004. [DOI] [PubMed] [Google Scholar]
- Figueras MJ, Levican A, Collado L, Inza MI, Yustes C. Arcobacter ellisii sp. nov., isolated from mussels. Syst Appl Microbiol. 2011;34:414–418. doi: 10.1016/j.syapm.2011.04.004. [DOI] [PubMed] [Google Scholar]
- Garip S, Bozoglu F, Severcan F. Differentiation of mesophilic and thermophilic bacteria with Fourier transform infrared spectroscopy. Appl Spectrosc. 2007;61:186–192. doi: 10.1366/000370207779947486. [DOI] [PubMed] [Google Scholar]
- Ryzhov V, Fenselau C. Characterization of the protein subset desorbed by MALDI from whole bacterial cells. Anal Chem. 2001;73:746–750. doi: 10.1021/ac0008791. [DOI] [PubMed] [Google Scholar]
- Lay J. MALDI-TOF mass spectrometry of bacteria. Mass Spectrom. 2001;20:172–194. doi: 10.1002/mas.10003. [DOI] [PubMed] [Google Scholar]
- Moore ERB, Rosselló-Móra R. MALDI-TOF MS: A return to phenotyping in microbial identification? Syst Appl Microbiol. 2011;34:1. doi: 10.1016/j.syapm.2011.01.001. [DOI] [PubMed] [Google Scholar]
- Savic D, Jokovic N, Topisirovic L. Multivariate statistical methods for discrimination of lactobacilli based on their FTIR spectra. Dairy Sci Tech. 2008;88:273–290. doi: 10.1051/dst:2008003. [DOI] [Google Scholar]
- Dziuba B, Babuchowski A, Nalecz D, Niklewicz M. Identification of lactic acid bacteria using FTIR spectroscopy and cluster analysis. Int Dairy J. 2007;17:183–189. doi: 10.1016/j.idairyj.2006.02.013. [DOI] [Google Scholar]
- Rebuffo-Scheer CA, Schmitt J, Scherer S. Differentiation of Listeria monocytogenes serovars by using artificial neural network analysis of Fourier-transformed infrared spectra. Appl Environ Microbiol. 2007;73:1036–1040. doi: 10.1128/AEM.02004-06. [DOI] [PMC free article] [PubMed] [Google Scholar]
- Yu C, Irudayaraj J. Identification of pathogenic bacteria in mixed cultures by FTIR spectroscopy. T ASABE. 2006;49:1623–1632. [Google Scholar]
- Lamprell H, Mazerolles G, Kodjo A, Chamba JF, Noel Y, Beuvier E. Discrimination of Staphylococcus aureus strains from different species of Staphylococcus using Fourier transform infrared (FTIR) spectroscopy. Int J Food Microbiol. 2006;108:125–129. doi: 10.1016/j.ijfoodmicro.2005.10.015. [DOI] [PubMed] [Google Scholar]
- Liao LF, Lien CF, Lin JL. FTIR study of adsorption and photoreactions of acetic acid on TiO2. Phys Chem Chem Phys. 2001;3:831–837. [Google Scholar]
- Jackson M, Ramjiawan B, Hewko M, Mantsch HH. Infrared microscopic functional group mapping and spectral clustering analysis of hypercholesterolemic rabbit liver. Cell Mol Biol. 1998;44:89–98. [PubMed] [Google Scholar]
- Nichols PD, Henson JM, Guckert JB, Nivens DE, White DC. FTIR methods microbial ecology: Analysis of bacteria, bacteria-polymer mixtures and biofilms. J Microbiol Meth. 1985;4:79–94. doi: 10.1016/0167-7012(85)90023-5. [DOI] [PubMed] [Google Scholar]
- Szalontai B, Nishiyama Y, Gombos Z, Murata N. Membrane dynamics as seen by Fourier transform infrared spectroscopy in a cyanobacterium, Synechocystis PCC 6803. The effects of lipid unsaturation and the protein-tolipid ratio. Biochim Biophys Acta. 2000;1509:409–419. doi: 10.1016/S0005-2736(00)00323-0. [DOI] [PubMed] [Google Scholar]
- Haris PI, Severcan F. FTIR spectroscopic characterization of protein structure in aqueous and non-aqueous media. J Mol Catal B Enzym. 1999;7:207–221. doi: 10.1016/S1381-1177(99)00030-2. [DOI] [Google Scholar]
Associated Data
This section collects any data citations, data availability statements, or supplementary materials included in this article.
Supplementary Materials
The average FTIR spectra in the 4000–2800 cm-1(a); 1800–1400 cm-1(b); 1400–1000 cm-1(c); 1000–500 cm-1(d) region for both Acidovorax oryzae (n = 10) and Acidovorax citrulli (n = 10).