Abstract
Purpose
Age-related macular degeneration (AMD) is the leading cause of vision loss among Americans over the age of 65. Currently, no effective treatment can reverse the central vision loss associated with most AMD. Digital image-processing techniques have been developed to improve image visibility for peripheral vision; however, both the selection and efficacy of such methods are limited. Progress has been difficult for two reasons: the exact nature of image enhancement that might benefit peripheral vision is not well understood, and efficient methods for testing such techniques have been elusive. The current study aims to develop both an effective image-enhancement technique for peripheral vision and an efficient means for validating the technique.
Methods
We used a novel contour detection algorithm to locate shape-defining edges in images based on natural-image statistics. We then enhanced the scene by locally boosting the luminance contrast along such contours. Using a gaze-contingent display, we simulated central visual field loss in normally-sighted young (ages 18–30) and older adults (ages 58–88). Visual search performance was measured as a function of contour enhancement strength ("Original" (unenhanced), "Medium", and "High"). For preference task, a separate group of subjects judged which image in a pair "would lead to better search performance".
Results
We found that while contour enhancement had no significant effect on search time and accuracy in young adults, Medium enhancement resulted in significantly shorter search time in older adults (~13% reduction relative to Original). Both age groups preferred images with Medium enhancement over Original (2 to 7 times). Furthermore, across age groups, image content types and enhancement strengths, there was a robust correlation between preference and performance.
Conclusions
Our findings demonstrate a beneficial role of contour enhancement in peripheral vision for older adults. Our findings further suggest that task-specific preference judgments can be an efficient surrogate for performance testing.
Keywords: low vision questionnaire, rehabilitation, functional ability, Veterans Affairs Low-Vision Visual Functioning Questionnaire, Impact of Vision Impairment Questionnaire
People who lose their central retinal vision due to disease, such as macular degeneration, have to rely on their peripheral vision for form-vision tasks such as reading, recognizing faces and watching television. Pattern recognition in peripheral vision is known to suffer from reduced acuity 1, 2 and loss in contrast sensitivity.3–6 It is further limited by crowding, i.e. the impairment in recognition performance due to clutter.7, 8 It has been shown that even with unrestricted amount of magnification, reading in the periphery remains slow 9,10, and face recognition is poor.11
Age-related macular degeneration (AMD) is the leading cause of vision loss and blindness among Americans over the age of 65. About 1.75 million U.S. residents currently have advanced AMD with associated vision loss. 12 These individuals often report a great deal of difficulty in daily visual activities. Their numbers are expected to grow to almost 3 million by 2020.12 There is currently no effective medical treatment that can reverse the central vision loss associated with the vast majority of AMD. However, visual aids (mostly based on magnification) have been developed to improve image visibility in the periphery.
In theory, digital image processing techniques hold great potential for developing effective visual aids, since they are not as constrained by the physics of image formation as optical aids. A successful digital image-enhancement technique can be incorporated into the signal-processing pipeline in a variety of video output systems including television, computer, and smart phone video screens. Given the increasing prevalence of digital video media in use, the potential impact of visual aids based on image enhancement is large and growing.
At present, both the selection and efficacy of image-enhancement-based visual aids are very limited. Closed-circuit televisions (CCTVs) for low-vision applications typically include simple image-enhancement techniques such as boosting the overall image brightness and contrast, stretching and thresholding the contrast, contrast reversal, and digital magnification. Various digital filtering techniques have been proposed and tested, but few are commercially available, and several commercial devices have been discontinued.13 Only one product whose algorithms were developed in the context of low-vision research is marketed for general-purpose image improvements.14
Progress has been difficult because the exact requirements for image enhancement that best benefit peripheral vision are not known. Current approaches do not address certain core limitations of peripheral form vision, such as crowding, that are beyond the low contrast sensitivity of peripheral vision. Another obstacle in the development of image-enhancement technology for low-vision applications is the lack of efficient methods for measuring such benefits.13 There is no ‘eye chart’ to rapidly assess visual functions relevant for daily living in patients with central field loss (CFL). Even when more controlled laboratory testing is possible, it is not yet clear what tasks are most representative of the visual tasks of daily living. Adding to this difficulty, recruiting a large number of CFL patients for extensive laboratory testing is challenging. Lastly, while generic preference judgments (“Which image appears clearer or more understandable?”) are far easier to measure than performance, there is no established link between the two.
The present study addressed these challenges by (1) developing a novel image-enhancement technique for peripheral vision and testing its effectiveness; (2) simulating central field loss in age-matched normally sighted subjects using a gaze-contingent visual display; (3) demonstrating the utility of a simple visual-search task for assessing the benefit of image enhancement techniques; and (4) determining if task-specific preference and performance are correlated. The technology development part of the first objective is the topic of a separate report, and we shall limit our description here to the essential aspects of the enhancement method that are relevant to our other objectives.
We developed a novel image-statistics based contour-detection algorithm to locate shape-defining edges in a scene. Once shape-defining edges were identified in original images, the contrast of these edges was locally boosted while preserving their sharpness. Using a gaze-contingent display, we induced an artificial central scotoma (10° in diameter) in normally sighted subjects.
Visual search performance (speed and accuracy) was measured as a function of contour enhancement strength - ‘Original’ (i.e., unenhanced), ‘Medium’ enhanced and ‘High’ enhanced images. The search task was chosen because it is an ecologically relevant visual activity. It also engages multiple components of the visual and oculomotor systems in a way that demands speed as well as accuracy. With simulated central scotoma, we found that while contour enhancement had no significant effect on search performance in young adults (ages 18–30), a modest amount of enhancement resulted in substantially improved search performance for older adults (ages 58–88). In addition to task performance, we independently assessed task-specific subjective preference for the enhanced images relative to the Original. Both age groups under the simulated scotoma conditions preferred images with Medium enhancement compared to the Original. Across age groups, image content types, and enhancement levels, we found that a close relationship existed between preference and performance.
METHODS
Subjects
Study participants included 16 older adults (ages ranging from 58 to 88 years, 10 females) and 39 young adults (ages ranging from 18 to 30 years, 18 females). All subjects were free of eye diseases and without known cognitive or neurological impairments. The 16 older adults were recruited from the Los Angeles metropolitan area. Their mean distance acuity (Lighthouse distance acuity chart) was 0.11 logMAR (Snellen 20/25). Proper refractive correction for the viewing distance was used. The older adults received monetary compensation for their participation and transportation. The young adults were recruited from the University of Southern California campus. Their mean distance acuity (Lighthouse distance acuity chart) was −0.1 logMAR (Snellen 20/15). The young adults received either monetary compensation or class credit for their participation. The experimental protocols were approved by the Internal Review Board (IRB) of the University of Southern California, and written informed consent was obtained from each subject prior to the experiment.
Stimuli and Apparatus
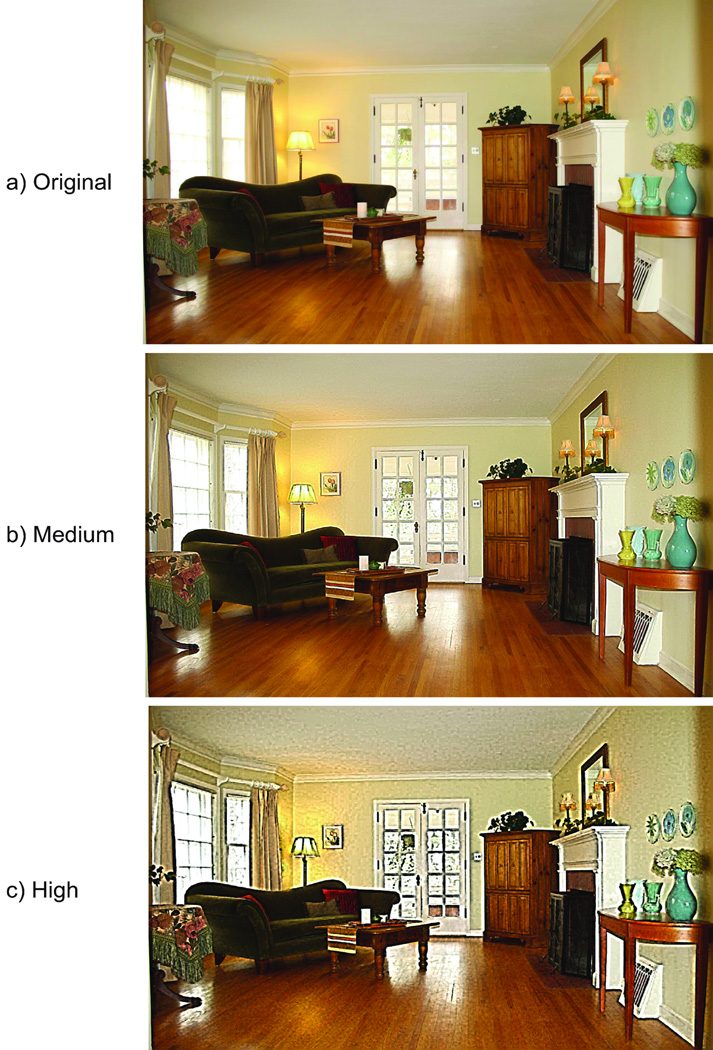
Stimuli were high contrast 24-bit RGB color images of three types of contents: faces, indoor scenes, and collections of objects (Fig. 1). 157 images (1024 × 768 pixels) were selected from an image database.15 150 images were used for the experiments and the remaining 7 images were set aside for practice trials prior to the experiments. The same set of 150 images was used both for visual search and preference tasks. Two different contour enhancement levels were applied to the images, resulting in three enhancement conditions: Original (i.e., unenhanced), Medium, and High enhancements (Fig. 1). Each enhancement level contained an approximately equal number of three content types (16 or 17 images per enhancement level).
Figure 1.
Samples of the ‘Original’ image, and images enhanced at ‘Medium’ and ‘High’ strength levels.
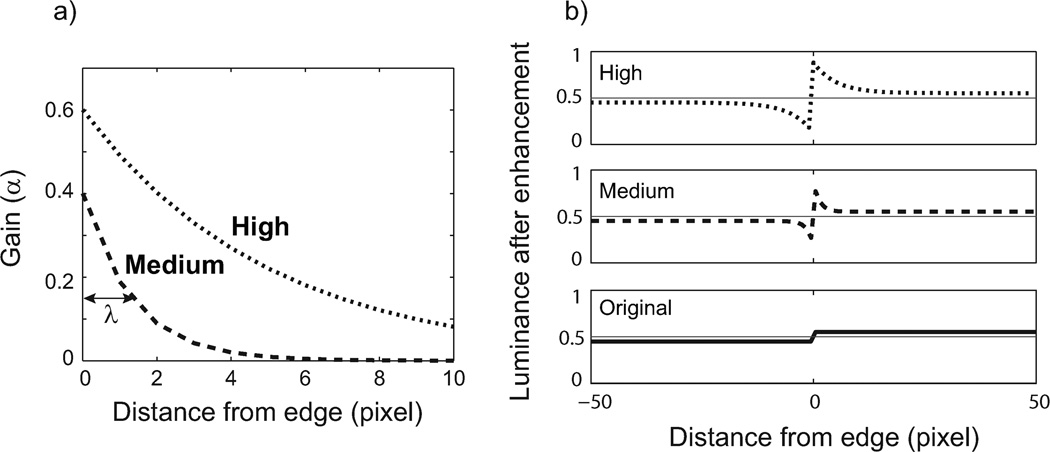
The original image was enhanced along shape-defining contours. To do this, contour probability was estimated using a novel local edge detection method based on learned natural- image statistics.16 Having identified locations of high local-edge probability, a local Cornsweet-like gain function was used to modulate the luminance in the orthogonal direction to the shape-defining edge. Even though only a small portion of the image was altered, the overall perceived contrast was increased due to the perceptual filling-in mechanism responsible for the Craik-O’Brien-Cornsweet illusion.17 Locally, the enhancement led to an increase in luminance on the brighter side of an edge by a multiplicative factor of (1+α) and a decrease of luminance by a factor of (1−α) on the darker side. At the edge pixel (the brighter pixel of the edge), the values for α reached the maximum of 0.4 and 0.6 for Medium and High enhancement, respectively. The gain (α) decreases exponentially from the edge with space constants (λ) of 1.33 and 5 pixels for Medium and High enhancement, respectively (Fig. 2). Note that our enhancement operation is not a local high-pass filter – it adds contrast across selected contours in the medium and high spatial frequency range while preserving the lower spatial frequencies.
Figure 2.
Cornsweet-like contour enhancement. (a) The luminance of each selected edge is multiplied by a factor of (1+α) on the brighter side and (1−α) on the darker side, with α decays exponential with distance from the edge pixel (the brighter pixel of an edge) with a space constant λ (i.e. the gain at distance λ is 1/e the gain at distance 0). The values of α(0) and λ are 0.4 and 1.33 pixels for the Medium enhancement and 0.6 and 5 pixels for High enhancement. The effect of the enhancement on luminance across an edge is illustrated in (b).
The stimuli and experiment were controlled using MATLAB (version 7.9) and Psychophysics Toolbox extensions18, 19 for Windows 7 running on a Dell PC computer. The display was a 19” CRT monitor with the maximum brightness of 90 cd/m2. Its refresh rate was 85 Hz and had a resolution of 1024 × 768 pixels. The stimuli were presented at a viewing distance of 57 cm, and thus spanned 40 deg horizontally. The native and uncorrected gamma of the display was 2.22, verified with a photometer.
Simulated Central Scotoma
A gaze-contingent visual display was used to simulate central visual field loss in normally-sighted subjects. This paradigm referred to as “artificial scotoma” 20 has been used in previous studies to investigate various issues related to central field loss. 21–23 Subjects’ eye movements were monitored using an infrared video-based eye-tracker sampled at 2000 Hz (EyeLink 1000/Tower Mount monocular eyetracker, SR Research Ltd., Ontario, Canada). A 9-point calibration/validation sequence was performed at the beginning of every block. Calibration and/or validation were repeated until the validation error was smaller than 1° on average. The real-time gaze position was sent to the display computer through a high speed Ethernet link. The continuous gaze information was used to draw a scotoma on the display screen at a refresh and update rate of 85Hz. The size and shape of the scotoma were derived from the visual field measurement obtained from a patient with age-related macular degeneration 24, as shown in Fig. 3. The scotoma was nearly a circular disc and subtended about 10° of visual angle and was rendered as a uniform gray-colored patch (18 cd/m2) on the screen. The average delay between actual eye movement and screen update was estimated to be approximately 10 ms (range from 2 ms to 15 ms, based on eye-data-to-frame-time latency we measured on the stimulus computer and manufacturer’s data on minimum eye data latency). The gaze position error, i.e., the difference between target position and computed gaze position was estimated during the 9-points validation process. The average gaze position error was 0.5° ranging from 0.1° to 1°. A chin-and-forehead rest was used throughout the experiment in order to minimize head movements and trial-to-trial variability in the estimate of gaze position. Only the right eye was tracked. Viewing was binocular.
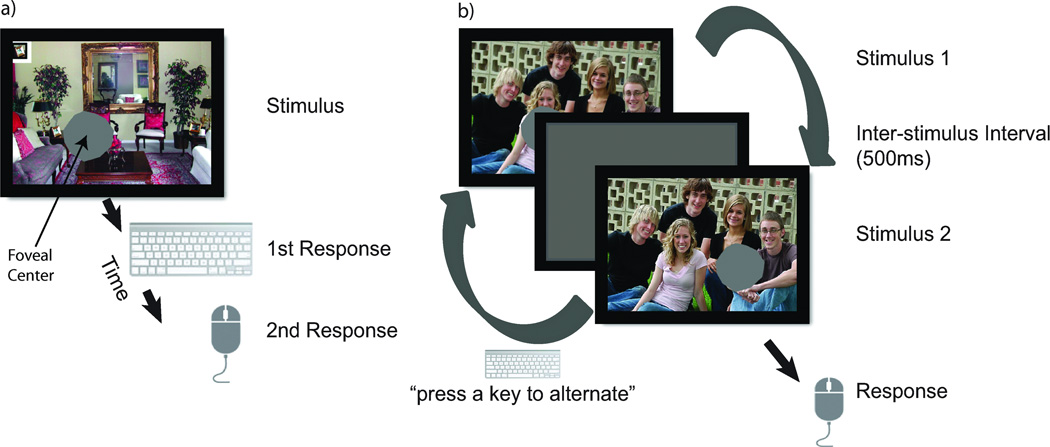
Figure 3.
Task procedure. (a) Illustration of one trial in the visual search task. A target object was always presented in an inset (demarcated by a black and white frame) at the upper left corner of the display screen throughout the trial. A subject’s task was to find the target in a cluttered scene. The subject pressed a key as soon as they found the target object. The subject then indicated the location of the target with a mouse cursor. (b) Illustration of one trial in the preference task. A subject’s preference for an image-enhancement type over the Origin was measured using a temporal two-interval forced choice paradigm. For a given trial, an Original image was pitted against one of its enhanced versions. In each trial, the subject viewed the two images one after the other. The two images differed only in whether they were enhanced. The subject could alternate between the two images by a key press. The subject indicated by a mouse click which image might lead to a better performance when looking for an object. No search target was indicated in the images.
The results from the scotoma-free (i.e., foveal viewing) experiment indirectly confirmed the effectiveness of the gaze-contingent display on performance. A substantial increase in accuracy and decrease in search time were observed in the data obtained from the scotoma-free experiment (see Results) compared to the conditions with the simulated central scotoma. This demonstrated that the simulated central scotoma remained effective despite the modest amount of spatiotemporal imprecision in the eye tracking system. Furthermore, as it will transpire, we found that Medium but not High strength of enhancement was effective in improving performance for the older adults with simulated scotoma. This makes it unlikely that the observed enhancement effect was due to any update lag of the gaze-contingent display, allowing foveal previews. 20 Such a foveal preview would have been made more salient and effective with the High-strength enhancement.
Procedure
Visual Search Task
The 150 images were randomly divided into three groups of 50, one for each image-enhancement level. In each trial, one of 150 images selected at random (without replacement) was presented to subjects on the computer screen. The search target, which was an object in the presented image, was displayed in an inset (demarcated by a black and white frame) at the upper left corner of the display screen throughout the trial (Fig. 3a). The same enhancement strength was applied to the search target as the rest of the picture. The subjects’ task was to find the target object in a cluttered scene. Subjects had to press a key as soon as they found the target object, which provided a measure of search time. Subjects were then asked to report the location of the target by pointing the mouse cursor to the target, which provided a measure of accuracy. A correct response was scored when the subject placed the cursor inside the target region (scene region as depicted in the target inset), which on average was within 1.7° from the center of a target. The median size of the target objects was 3.6 degrees of visual angle (ranged from 0.8 to 9.8 degrees). There was no significant difference in target size across enhancement levels (height: F(2,3698) = 0.16, p = 0.86; width: F(2, 3698) = 0.26, p = 0.77). Subjects had no difficulty seeing the mouse pointer (approximately 1.3°) in the periphery. The search scene and target remained on the screen until subjects made their responses. Subjects were instructed to find the target and make their responses as accurately and quickly as possible. It was also stressed to the subjects that the two responses (i.e. a key press for detecting a target object and a mouse click for the target location) should be made for the same object. No feedback was provided. Subjects were given a series of practice trials prior to the experiment. The gaze-contingent display remained active throughout the entire experiment.
Preference Task
Subjects’ preference for image-enhancement strength was measured using a temporal two-interval forced choice paradigm (Fig.3b). For a given trial, an Original image was always pitted against one of its enhanced versions. In each trial, subjects viewed two images, one after the other. The two images differed only in whether the image enhancement was present. Subjects were able to toggle between the two images with a key press. They were instructed: “Imagine yourself searching for an object in this cluttered scene. Which one do you think would be more helpful for you to perform such a task?” Subjects were aware that their choice should not be based on an aesthetic judgement. Unlike the visual search task, no search target was presented. Subjects made their choice with a mouse click. They were given unlimited viewing time to ensure sufficient comparison before their decision.
The first alternative shown was evenly divided between the Original and enhanced images. Subjects performed one block of the preference task, which consisted of 150 trials. The images were randomly divided into two sets of 75 images, one for the choice between Original and Medium enhancement, and the other for the choice between Original and High enhancement.
Experiment Design and Data Analysis
Both visual search and preference tasks were performed with a simulated central scotoma, such that subjects had to rely on their peripheral vision to carry out the tasks. In addition, we conducted foveal versions of the two tasks on different groups of subjects without any simulated scotoma. The foveal-viewing control experiment was included to verify the effectiveness of the simulated scotoma, and to see if our findings were specific to peripheral vision.
There were six groups of subjects: three groups of older adults (one for the visual search task, another for the preference task, the one for foveal viewing), three groups of young adults (one for the visual search task, another for the preference task, the other for foveal viewing). Ten older subjects were randomly assigned to one of two groups of 5 older adults (hereafter “older scotoma group” for convenience). A separate group of six older subjects was assigned to the foveal-viewing control experiment (“older scotoma-free group”). Twenty six young subjects were randomly assigned to one of two groups of 13 young adults (“young scotoma group”). A separate group of 13 young subjects was assigned to the foveal-viewing control experiment (“young scotoma-free group”). Subjects’ visual acuity and age were well matched within each age group.
For the scotoma groups, visual-search performance and task-specific preference were assessed with different groups of subjects to avoid any unwanted interactions between the two tasks (a preceding preference judgment might lead to a preview effect on visual search, while subjective impression of performance during visual search could influence the subsequence preference judgments). Each age-matched control (scotoma-free) group performed both visual search and preference tasks for efficiency and simplicity. For these groups, the search task was always preceded by preference task. Each subject was tested with three levels of image enhancement (Original, Medium and High) and three content types (faces, indoor scenes, and object collections) in random order.
To analyze data from the visual search experiment, we performed a 3 (enhancement strength: Original, Medium, High) × 3 (content type: faces, indoor scenes, object collections) repeated measures analysis of variance (ANOVA) on search accuracy and log search time with enhancement strength and content type as within-subject factors. Only trials with a correct response were included in the analysis of search time.
For the preference experiment, we define preference as the odds of choosing the enhanced version of image over the Original image: penhanced/(1-penhanced) = penhanced/poriginal. Thus, preference is greater than 1 if subjects preferred the enhanced version over the Original, less than 1 if they preferred the Original, and 1 if they showed no preference. We conducted two analyses. First, in order to see if Medium and/or High enhancements were preferred over the Original image, we performed a two-tailed t-test to determine if log preference for either enhancement strength was different from zero. Second, to test if there was any difference between Medium and High conditions, we performed a 2 (enhancement strength: Medium, High) × 3 (content type: faces, indoor scenes, object collections) repeated measures ANOVA on log preference with enhancement strength and content type as within-subject factors.
RESULTS
Older Adults
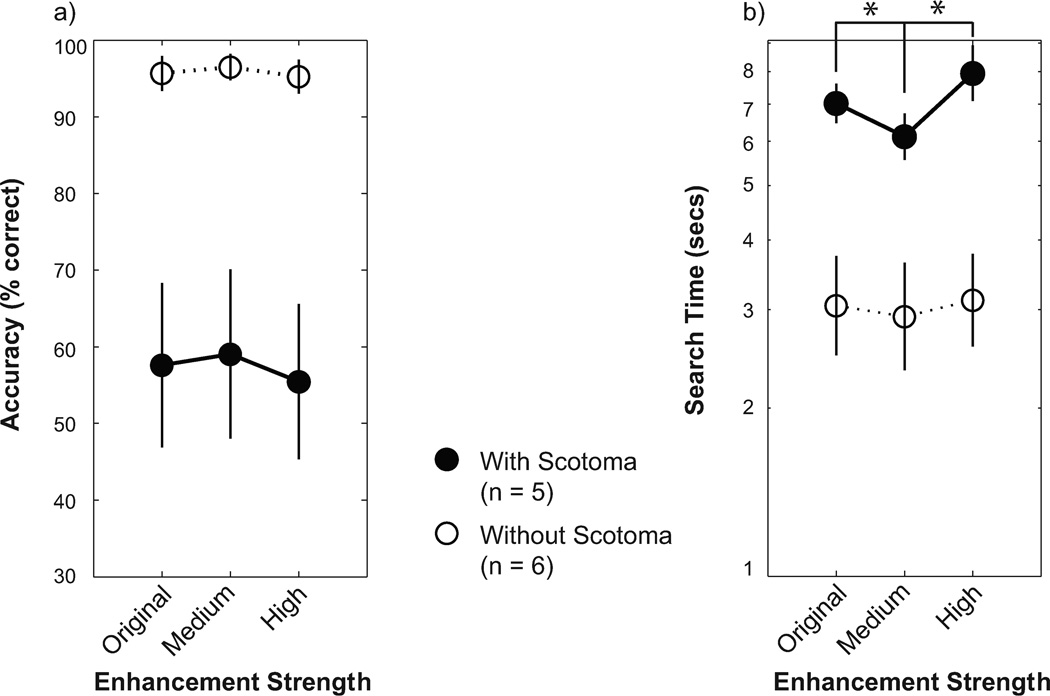
Figure 4 shows search accuracy and search time as a function of enhancement strength for older adults. For the scotoma group, there was a significant main effect of enhancement strength on search time (F(2,8) = 12.52, p < 0.01). The search time for the Medium enhancement was significantly shorter than the Original (F(1,4) = 20.70, p < 0.015, Bonferroni corrected) and High enhancement (F(1,4) = 18.91, p < 0.015, Bonferroni corrected), and there was no difference between Original and High conditions (F(1,4) = 4.18, p > 0.05, Bonferroni corrected).
Figure 4.
(a) Search accuracy (percent correct) as a function of enhancement strength for older adults; (b) Search time as a function of enhancement strength. Closed circles indicate the average accuracy and search time values across three content types from the scotoma group. Open circles indicate the data from the scotoma-free group. Error bar indicates ± 1 SEM. * indicates statistical significance at family-wide α = 0.05, after correcting for multiple comparisons.
Our results showed that when contours in an image were enhanced with Medium strength, the search time was reduced by 13% and 20% compared to the Original and High enhancement, respectively. There were no significant interaction between enhancement strength and content type (F(4,16) = 1.28, p > 0.05), meaning that regardless of image content, Medium enhancement benefits visual search performance. For accuracy, unlike search time, we did not find any main effect of enhancement strength or content type, or any interaction between these two (p > 0.05). The mean accuracy was 57.37% (± 10.43 SEM). The chance level, obtained by randomly permuting the target and mouse-response coordinates across trials, was 1.46%.
In contrast, for a separate group of older adults performing the same visual search and preference tasks without any simulated scotoma, we did not find any significant difference in search time among enhancement strengths (F(2,10) = 1.19, p > 0.05) (Fig. 4b). There was no main effect of enhancement strength on accuracy (p > 0.05) (Fig. 4a). The average search time of the scotoma-free group was shortened by a factor of 2 compared to the scotoma group. The scotoma-free group showed a high level of search accuracy (96%). These results show that our artificial scotoma was effective in blocking central vision.
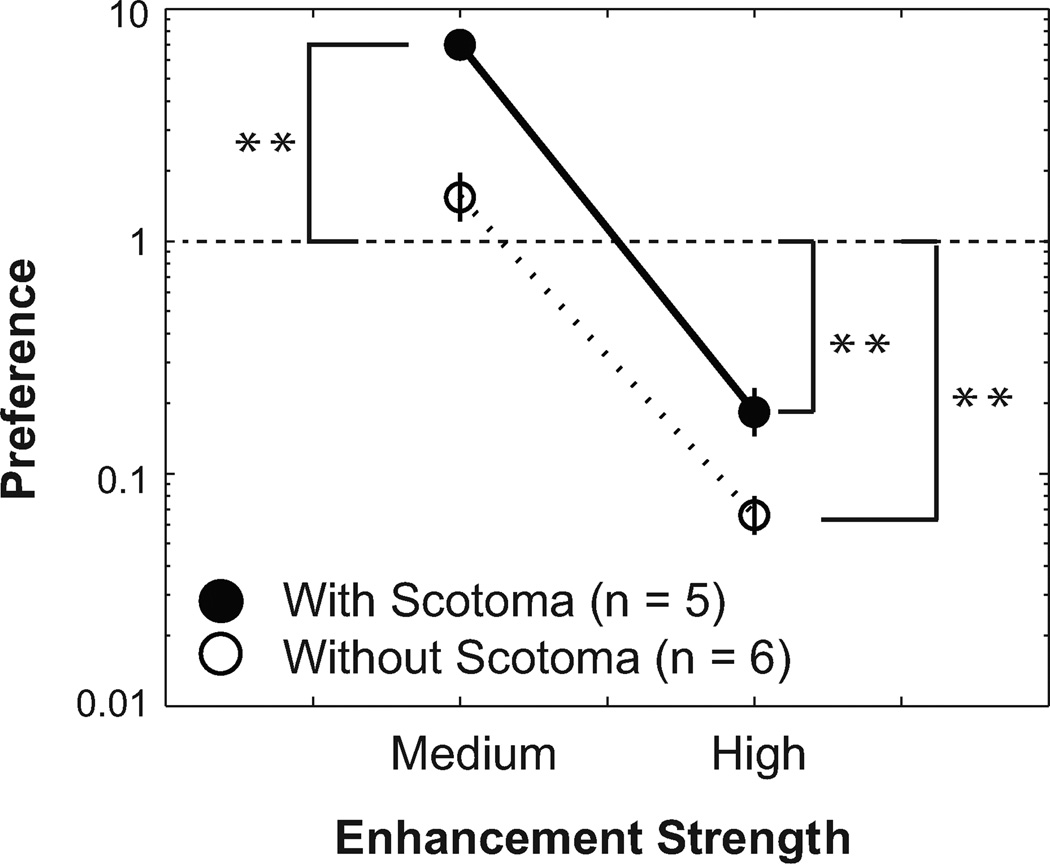
In two separate groups of older subjects (one for the scotoma group; the other for the scotoma-free group), we measured preference for each enhancement strength (Fig. 5). In a typical trial, a subject alternated between the two images 4 times on average prior to making a response. The median response time was 8 s ranging from 1.24 s to 64 s.
Figure 5.
Preference (penhanced/poriginal) as a function of enhancement strength for older adults. The horizontal dashed line indicates no preference between Original and an enhanced version. Closed circles indicate the average preference values across three content types from the scotoma group and open circles from the scotoma-free group. ** indicates statistical significance at family-wide α = 0.01, after correcting for multiple comparisons.
For the scotoma group, images enhanced at Medium strength were strongly preferred over the Original by a factor of 7 (t(14) = 13.63, p < 0.01) while images enhanced at High strength were strongly disfavored (t(14) = −5.34, p < 0.01). Based on its preference rating with respect to the Original, Medium strength was strongly preferred over High strength enhancement (F(1,4) = 56.66, p < 0.01). There was no interaction between enhancement strength and content type (F(2,8) = 0.54, p > 0.05).
In contrast, for the scotoma-free condition, we did not find any significance difference in preference between the Original and Medium enhancement (t(17) = 1.25, p > 0.05) (Fig 5). The High enhancement was still disfavored compared to the Original (t(17) = −9.68, p < 0.01) or Medium enhancement (F(1,5) = 72.05, p < 0.01).
Young Adults
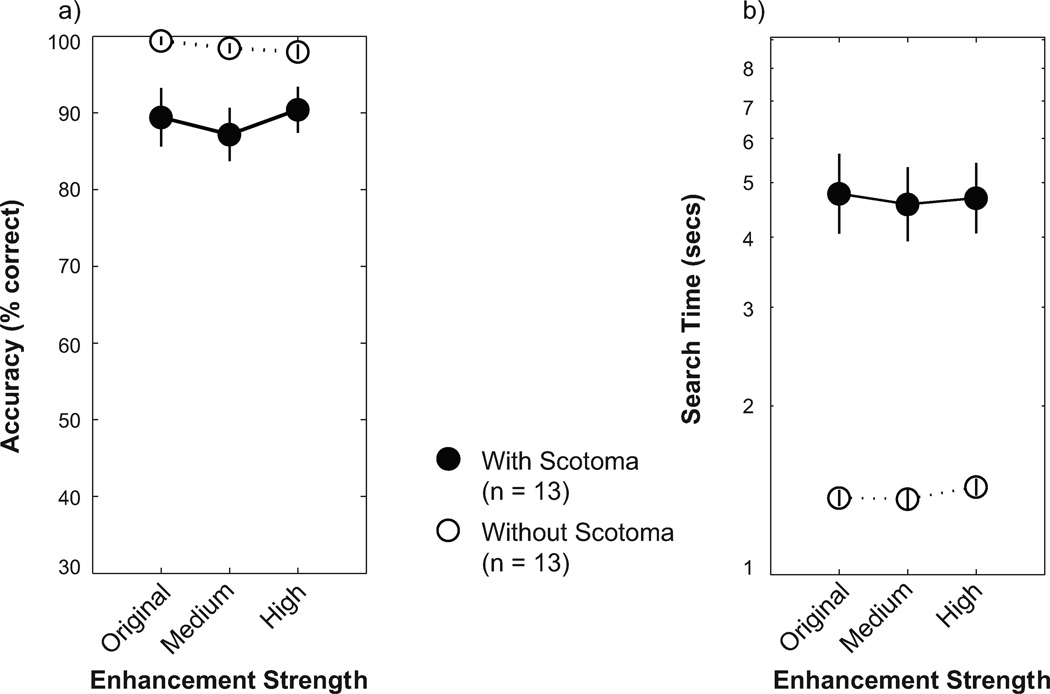
Figure 6 shows the search performance for young adults. For the young scotoma group, unlike the old scotoma group, there was no significant main effect of enhancement strength on search time (F(2,24) = 0.68, p > 0.05) and no significant interaction effect between enhancement strength and content type (F(4,48) = 0.16, p > 0.05).
Figure 6.
(a) Search accuracy (percent correct) as a function of enhancement strength for young adults; (b) search time as a function of enhancement strength. Closed circles indicate the average accuracy and search time values across three content types from the scotoma group. Open circles indicate the data from the scotoma-free group. Error bar indicates ± 1 SEM.
The geometric mean of the search time for the young scotoma group was substantially faster than the old scotoma group (4.68 s vs. 6.99 s). The search accuracy of the young group was also much higher (89% vs. 57%). The higher accuracy and faster search times for the young scotoma group indicates that visual and oculomotor functions under the condition of simulated central field loss appears to be much less compromised in young adults than in older adults. As a result, contour enhancement does not confer any significant advantage in the young scotoma group. Like the old scotoma group, there were no main effects of enhancement strength and content type and no interaction effect of these two factors on accuracy (p > 0.05).
Compared to the young scotoma group, the average search time of the young scotoma-free group was reduced by a factor of 3 (Fig. 6b) with a high search accuracy of 98% (Fig. 6a). Similar to the scotoma group, we found no main effect of enhancement strength on search time (F(2,24) = 2.33, p > 0.05) and no significant preference of the Medium enhancement over the Original (t(38) = 0.53, p > 0.05).
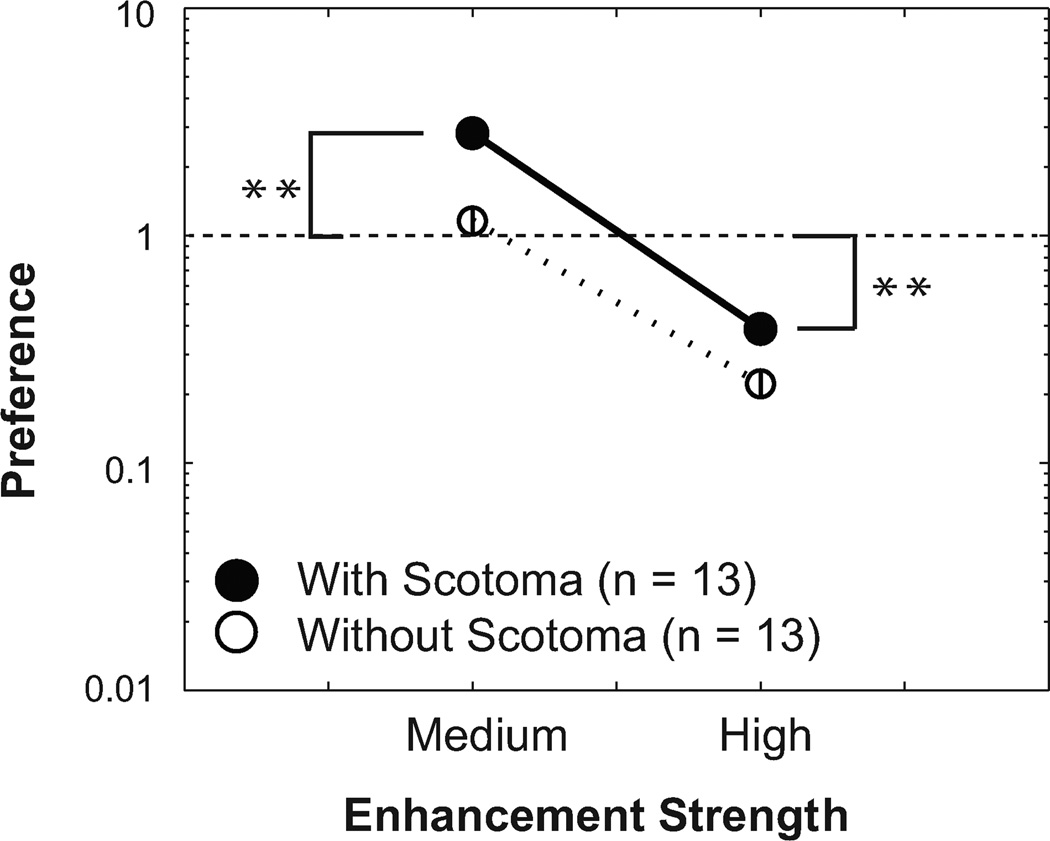
Despite the lack of enhancement effect on search performance for the young scotoma group, there was a significant effect on preference in a direction that is consistent with the results from the old scotoma group (Fig. 7). The young scotoma group preferred the Medium strength enhancement over the Original (t(38) = 4.48, p < 0.01); they also preferred the Original over the High enhancement (t(38) = −4.34, p < 0.01). Between the two enhancement levels, the young scotoma group preferred the Medium over the High enhancement (F(1,12) = 99.81, p < 0.01). As with the old scotoma group, there was no interaction between enhancement strength and content type (F(2,24) = 0.36, p > 0.05). It is noteworthy that the amplitudes in preference for the enhanced images (Medium or High strength) were less than those of the older group by roughly a factor of 2. In other words, the range of preference was compressed in the younger group. Consistent with the scotoma group, the scotoma-free group also disfavored the High enhancement over either the Original (t(38) = −5.99, p < 0.01) or Medium enhancement (F(1,12) = 23.44, p < 0.01) (Fig. 7).
Figure 7.
Preference (penhanced/poriginal) as a function of enhancement strength for young adults. The horizontal dashed line indicates no preference between Original and an enhanced version.
Relationship Between Preference and Visual Search Performance
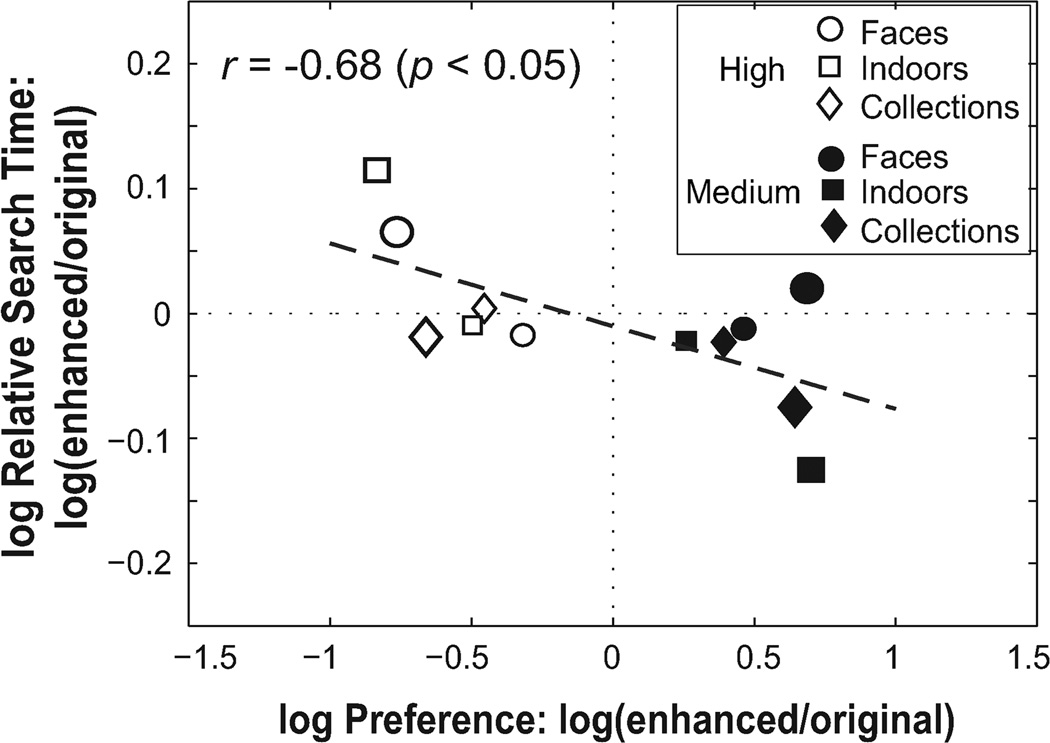
A reliable correlation between preference and performance would allow a fast screening of enhancement methods via the simpler preference measurement. This would facilitate the development and testing of image-enhancement technologies. We performed a correlation analysis between log relative search time and log preference. For this analysis, we normalized the search time of each subject relative to the subject’s search time with the Original. Using relative (as opposed to absolute) search time reduced the influence of individual variance. We then correlated the mean of the log relative search time of each group (the old and young scotoma groups) to the mean of the log preference ratings (relative to the Original) of the corresponding group (Fig. 8) for all three content types. The correlation between log preference and log relative search time was moderately high (r = −0.68, p < 0.05). It is noteworthy that compared to indoor scenes and object collections, the face content type showed a relatively poor correlation between the two dimensions, suggesting a great deal of variability in subjects’ responses to the face content type.
Figure 8.
Log relative search time vs. log preference. Each data point represents the group averages of log relative search time and log preference for each enhancement strength (Medium or High) obtained from each content type and age group. The closed and open symbols indicate Medium and High strength, respectively. The circle, square, and diamond symbols represent face, indoor-scene, and object-collection content type, respectively. Different subject groups are represented by the size of the symbols: the large size for the old scotoma group and the small size for the young scotoma group.
DISCUSSION
Using a simulated central scotoma, we examined the effects of the contour enhancement on both visual search performance and preference. We found that contour enhancement of modest strength benefited older adults but not young adults. We further examined the relationship between task-specific subjective preference and objective visual-search performance with groups of age-matched subjects. We found a significant correlation between visual search performance and task-specific preference.
Aging and the Effects of Contour Enhancement
With the Medium strength of contour enhancement, there was a substantial (13%) reduction in search time for the older adults under the condition of simulated central scotoma, and this speedup was accomplished without any reduction in accuracy. In contrast, we found no evidence in young adults for any advantage of contour enhancement in the same condition. Several causes may underlie this age difference.
When forced to rely solely on their peripheral vision for a visual-search task, both young and older adults performed poorly compared to their age-matched control groups (i.e., foveal viewing condition). Both visual and oculomotor factors may be responsible: object recognition is harder in the periphery, and so are maintaining fixation and targeting saccades without central vision. The substantial differences in performance between the young and older groups with simulated central scotoma imply that age has an effect on these factors, and contour enhancement can also have differential effects on them.
Contrast sensitivity decreases with aging. The decline of contrast sensitivity is more pronounced at medium and high spatial frequencies in both central 25–28 and peripheral vision 29. In natural images, these medium and high spatial frequencies are important for defining a shape with edges and contours, and are important for rapid recognition of objects and scenes.30–33 Age-dependent deficits in the sensitivities for these frequencies can degrade and slow down object recognition. The effect can be more pronounced in peripheral vision where the sensitivities for these frequencies are lower than in central vision to begin with. The effect can be further amplified in older adults due to any age-dependent loss in oculomotor control necessary for adapting to peripheral viewing without central vision. Our results suggest that boosting the contrast of shape-defining contours facilitates visual search for older adults in their peripheral vision. For young adults, the benefits of the enhancement in their peripheral vision may be marginal in the presence of a more capable oculomotor system.
This age difference in peripheral vision was also evident in preference. We found that the Medium enhancement was strongly preferred over the Original in both older and young adults, but more so in the older adults than the young adults (enhanced images were 7 times more likely to be chosen over the Original in older adults, compared to approximately 3 times more likely in young adults). For central vision, neither age group showed any significant effect of enhancement on preference (or search time).
The peripheral visual-search performance is greatly compromised in older adults compared to when foveal vision is available. The older adults showed low accuracy (~60%) for the peripheral search task, while the corresponding age-matched scotoma-free group maintained a high level of accuracy (~95%), comparable to the young adults. Some of the target objects might have been too small to be reliably distinguished in the periphery for older adults even with significant contour enhancement. Our target objects ranged from 0.8° to 9.8° in size. We observed that older adults tend to miss out more often on those small target objects.
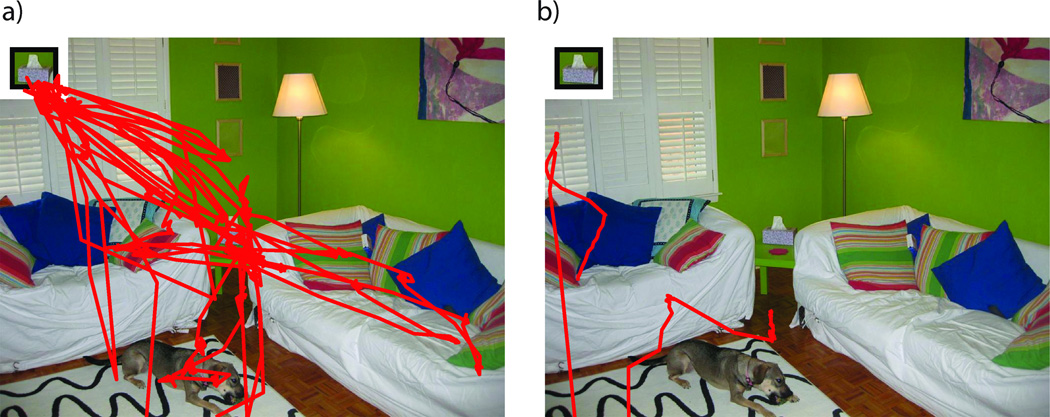
Oculomotor control such as maintaining stable fixations and making precise saccades is necessary for reliable pattern recognition. The older adults apparently have more difficulty in adapting oculomotor control for peripheral viewing (during the short adaptation time) than young adults, resulting in poor peripheral search performance for the old scotoma group. Our eye movement data in the simulated scotoma condition showed that the older adults tended to look back more often to the search target (Fig. 9a vs. 9b) much more often than the young adults, which may indicate an age-dependent decline in oculomotor control, peripheral vision and/or working memory.
Figure 9.
Example eye-movement patterns during the visual search task (solid red lines) for (a) an older adult and (b) a young adult. Data were from the scotoma condition in both cases.
Linking Preference to Performance
Our results showed that there is a high correlation between task-specific preference and visual search performance (r = −0.68). Considering the fact that preference and visual search performance were obtained from different groups of subjects, we conclude that this relationship between preference and performance is robust. To our knowledge, this is the first evidence supporting any linkage between subjective preference and objective visual performance using a between-subject comparison. It is important to note that our subjects were not asked to make a generic preference ranking, in the sense of “like” vs. “dislike”. Instead, they were asked to judge, without performing the task, which image would lead to better performance in a search task. Hence, the preference was essentially a subjective prediction of performance (i.e., task-specific preference). Our result shows that subject can make this prediction reasonably well, a finding which cannot be trivially explained. Subjects could not rehearse the search task in order to make the preference judgment since a search target was not presented. Moreover, the two images to be compared in a trial were identical except for the strength of enhancement. Any attempt to rehearse a task on one will interfere with a similar attempt on the other. At this point, an exact reason for the observed correlation between preference and performance is not known.
The relationship between subjective self-report and objectively measured performance has been reported in previous studies on cataract patients. They found that patients' perceived visual disability correlates with their objective glare disability and contrast sensitivity scores.34, 35 Such a correlation between subjectively predicted levels of performance and actual performance holds promise for rapid screening of image-enhancement technologies since preference ratings are much easier to obtain than performance measurements. Whether our results can be generalized to other types of visual performance tasks remains to be tested.
Tools for Evaluating the Benefits of the Image-Enhancement Technologies
There is currently no reliable battery of tests for evaluating low-vision aids with complex visual stimuli and in tasks that are relevant to daily living. The visual search task described in the current study provides a useful tool to probe visual functions such as object recognition and localization in clutter. It allows us to assess the effect of image enhancement on visual search performance with and without contextual guidance. Contextual information can be useful for guiding visual search (e.g., a cup is likely to be on a table). This context-guided search is common and ecologically significant. In the current study, the usefulness of context varied greatly across content types. There is a considerable contextual effect for the indoor scenes as most of the search targets appeared in the expected locations (e.g., a book on the bookshelf, a lamp on a stand). On the other hand, the other two content types: object collections (finding an object in an ensemble of real objects) and faces (finding a target face in a group photo) do not bear any strong contextual effect. We found no main effect or interactions due to content type.
The current study simulated only one scotoma. It was approximately circular and 10 degrees in diameter, large enough to ensure occlusion of the foveal vision. Whether our main findings are generalizable to simulated scotomas of other sizes and shapes is an important question. Changing shape and size of the scotoma will likely affect the effect of image enhancement on visual performance. Now that we had obtained a robust effect, it will be feasible to investigate the variants of simulated scotoma in the future.
Using the same set of images and same method of image enhancement, Satgunam et al.36 measured preference and visual search performance from individuals with a range of visual impairments that affected their central vision (AMD, JMD, Glaucoma, myopic degeneration, and others). Their results on preference were similar to ours. In general, subjects preferred enhancements of Low – (a condition we did not test) and Medium strength but rejected High-strength enhancement, consistent with early results.37 However, they found no overall improvement of search performance with image enhancement. Significant methodological differences and a heterogeneous patient population used in Satgunam et al.36 may account for the difference in the effect of image enhancement on visual search performance. Among the twenty four patients tested by Satgunam et al., three had peripheral deficits in addition to the central vision loss and not every patient had a complete central scotoma. For this subset of patients, an absolute artificial central scotoma, as used in our study, is not an adequate model. Moreover, only half the subjects in Satgunam et al. were older adults. Given that the effect of enhancement on search performance we found was primarily for older adults, it is not surprising that Satgunam et al. found no overall effect on search performance. Lastly, there are some obvious methodological differences between the two studies, such as the size of the stimuli (40° vs. 55°), display brightness (90 cd/m2 vs. 350 cd/m2), and the way to measure response time on visual search (search time measure via key press vs. response time measure via pointing to a target). It is worth noting that in Satgunam et al., 6 of the 7 subjects who were in a narrow range of mid-contrast sensitivity performed better with Medium enhancement, and 5 of these 7 also preferred images enhanced at Medium strength. Citing data on normal peripheral contrast sensitivity, Satgunam et al. suggested that our subjects with the simulated scotoma 10° in diameter would have contrast sensitivity within the same range. In general, the discrepancies between the results of these two studies illustrate the difficulty of translating from an idealized testing condition to a heterogeneous patient population. More studies are needed to determine whether our results with simulated central scotoma generalize to older adults with central vision loss.
CONCLUSIONS
In summary, our results show that a moderate level of contour enhancement facilitated visual search performance for older adults with simulated central field loss. For the same age group, a strong subjective preference was also found for moderately enhanced images. To a large extent, the improvement in search time due to a specific strength of enhancement can be predicted from the task-specific preference to the same enhancement, assessed independently with a different group of subjects. This correlation between performance and preference is evident across age groups.
ACKNOWLEDGMENTS
This work was supported by NIH grants R01EY016093 and R01EY17707. The authors thank Jessica Leigh Gonzales and Eric Trinh for their help with subject recruitment and data collection.
Footnotes
Publisher's Disclaimer: This is a PDF file of an unedited manuscript that has been accepted for publication. As a service to our customers we are providing this early version of the manuscript. The manuscript will undergo copyediting, typesetting, and review of the resulting proof before it is published in its final citable form. Please note that during the production process errors may be discovered which could affect the content, and all legal disclaimers that apply to the journal pertain.
Author EP holds a patent, assigned to Schepens Eye Research Institute, on the use of wideband enhancement for the visually impaired.
REFERENCES
- 1.Anderson SJ, Mullen KT, Hess RF. Human peripheral spatial resolution for achromatic and chromatic stimuli: limits imposed by optical and retinal factors. J Physiol. 1991;442:47–64. doi: 10.1113/jphysiol.1991.sp018781. [DOI] [PMC free article] [PubMed] [Google Scholar]
- 2.Artal P, Derrington AM, Colombo E. Refraction, aliasing, and the absence of motion reversals in peripheral vision. Vision Res. 1995;35:939–47. doi: 10.1016/0042-6989(94)00180-t. [DOI] [PubMed] [Google Scholar]
- 3.Robson JG, Graham N. Probability summation and regional variation in contrast sensitivity across the visual field. Vision Res. 1981;21:409–418. doi: 10.1016/0042-6989(81)90169-3. [DOI] [PubMed] [Google Scholar]
- 4.Pointer JS, Hess RF. The contrast sensitivity gradient across the human visual field: with emphasis on the low spatial frequency range. Vision Res. 1989;29:1133–1151. doi: 10.1016/0042-6989(89)90061-8. [DOI] [PubMed] [Google Scholar]
- 5.Pointer JS, Hess RF. The contrast sensitivity gradient across the major oblique meridians of the human visual field. Vision Res. 1990;30:497–501. doi: 10.1016/0042-6989(90)90090-8. [DOI] [PubMed] [Google Scholar]
- 6.Thibos LN, Still DL, Bradley A. Characterization of spatial aliasing and contrast sensitivity in peripheral vision. Vision Res. 1996;36:249–258. doi: 10.1016/0042-6989(95)00109-d. [DOI] [PubMed] [Google Scholar]
- 7.Levi DM. Crowding—an essential bottleneck for object recognition: a mini-review. Vision Res. 2008;48:635–654. doi: 10.1016/j.visres.2007.12.009. [DOI] [PMC free article] [PubMed] [Google Scholar]
- 8.Pelli DG, Tillman KA. The uncrowded window of object recognition. Nat Neurosci. 2008;11:1129–1135. doi: 10.1038/nn.2187. [DOI] [PMC free article] [PubMed] [Google Scholar]
- 9.Chung STL, Mansfield JS, Legge GE. Psychophysics of reading. XVIII The effect of print size on reading speed in normal peripheral vision. Vision Res. 1998;38:2949–2962. doi: 10.1016/s0042-6989(98)00072-8. [DOI] [PubMed] [Google Scholar]
- 10.Rubin GS, Turano K. Low vision reading with sequential word presentation. Vision Res. 1994;34:1723–1733. doi: 10.1016/0042-6989(94)90129-5. [DOI] [PubMed] [Google Scholar]
- 11.Mäkelä P, Näsänen R, Rovamo J, Melmoth D. Identification of facial images in peripheral vision. Vision Res. 2001;41:599–610. doi: 10.1016/s0042-6989(00)00259-5. [DOI] [PubMed] [Google Scholar]
- 12.Friedman DS, O'Colmain BJ, Munoz B, Tomany SC, McCarty C, de Jong PT, Nemesure B, Mitchell P, Kempen J. Prevalence of age-related macular degeneration in the United States. Arch Ophthalmol. 2004;122:564–572. doi: 10.1001/archopht.122.4.564. [DOI] [PubMed] [Google Scholar]
- 13.Peli E, Woods RL. Image enhancement for impaired vision: the challenge of evaluation. Int J Artif Intell Tools. 2009;18:415–438. doi: 10.1142/S0218213009000214. [DOI] [PMC free article] [PubMed] [Google Scholar]
- 14.Fullerton M, Peli E. Digital enhancement of television signals for people with visual impairments: evaluation of a consumer product. J Soc Inf Disp. 2008;16:493–500. doi: 10.1889/1.2896328. [DOI] [PMC free article] [PubMed] [Google Scholar]
- 15.Luo G, Satgunam P, Peli E. Visual search performance of patients with vision impairment: effect of JPEG image enhancement. Ophthalmic Physiol Opt. 2012 doi: 10.1111/j.1475-1313.2012.00908.x. [DOI] [PMC free article] [PubMed] [Google Scholar]
- 16.Ramachandra C, Mel BW. Computing local edge probability from a population of simple cells. Poster presented at the Computational and Systems Neuroscience Conference; February 25, 2011; Salt Lake City, Utah. [Accessed June 28, 2012]. Available at: http://www.cosyne.org/c/index.php?title=Cosyne_11_posters/II-49. [Google Scholar]
- 17.Cornsweet TN. Visual Perception. New York: Academic Press; 1970. [Google Scholar]
- 18.Brainard DH. The Psychophysics Toolbox. Spat Vis. 1997;10:433–436. [PubMed] [Google Scholar]
- 19.Pelli DG. The VideoToolbox software for visual psychophysics: transforming numbers into movies. Spat Vis. 1997;10:437–442. [PubMed] [Google Scholar]
- 20.Aguilar C, Castet E. Gaze-contingent simulation of retinopathy: some potential pitfalls and remedies. Vision Res. 2011;51:997–1012. doi: 10.1016/j.visres.2011.02.010. [DOI] [PubMed] [Google Scholar]
- 21.Fine EM, Rubin GS. Effects of cataract and scotoma on visual acuity: a simulation study. Optom Vis Sci. 1999;76:468–473. doi: 10.1097/00006324-199907000-00022. [DOI] [PubMed] [Google Scholar]
- 22.Pidcoe PE, Wetzel PA. Oculomotor tracking strategy in normal subjects with and without simulated scotoma. Invest Ophthalmol Vis Sci. 2006;47:169–178. doi: 10.1167/iovs.04-0564. [DOI] [PubMed] [Google Scholar]
- 23.Bernard JB, Scherlen AC, Castet E. Page mode reading with simulated scotomas: a modest effect of interline spacing on reading speed. Vision Res. 2007;47:3447–3459. doi: 10.1016/j.visres.2007.10.005. [DOI] [PubMed] [Google Scholar]
- 24.Chung ST. Improving reading speed for people with central vision loss through perceptual learning. Invest Ophthalmol Vis Sci. 2011;52:1164–1170. doi: 10.1167/iovs.10-6034. [DOI] [PMC free article] [PubMed] [Google Scholar]
- 25.Owsley C, Sekuler R, Siemsen D. Contrast sensitivity throughout adulthood. Vision Res. 1983;23:689–699. doi: 10.1016/0042-6989(83)90210-9. [DOI] [PubMed] [Google Scholar]
- 26.Ross JE, Clarke DD, Bron AJ. Effect of age on contrast sensitivity function: uniocular and binocular findings. Br J Ophthalmol. 1985;69:51–56. doi: 10.1136/bjo.69.1.51. [DOI] [PMC free article] [PubMed] [Google Scholar]
- 27.Tulunay-Keesey U, Ver Hoeve JN, Terkla-McGrane C. Threshold and suprathreshold spatiotemporal response throughout adulthood. J Opt Soc Am A. 1988;5:2191–2200. doi: 10.1364/josaa.5.002191. [DOI] [PubMed] [Google Scholar]
- 28.Elliott DB. Contrast sensitivity decline with ageing: a neural or optical phenomenon? Ophthalmic Physiol Opt. 1987;7:415–419. [PubMed] [Google Scholar]
- 29.Crassini B, Brown B, Bowman K. Age-related changes in contrast sensitivity in central and peripheral retina. Perception. 1988;17:315–332. doi: 10.1068/p170315. [DOI] [PubMed] [Google Scholar]
- 30.Biederman I. Recognition-by-components: a theory of human image understanding. Psychol Rev. 1987;94:115–147. doi: 10.1037/0033-295X.94.2.115. [DOI] [PubMed] [Google Scholar]
- 31.Huttenlocher DP, Ullman S. Recognizing solid objects by alignment with an image. Int J Comput Vis. 1990;5:195–212. [Google Scholar]
- 32.Knill DC. Perception of surface contours and surface shape: from computation to psychophysics. J Opt Soc Am (A) 1992;9:1449–1464. doi: 10.1364/josaa.9.001449. [DOI] [PubMed] [Google Scholar]
- 33.Oliva A, Torralba A. Modeling the shape of the scene: a holistic representation of the spatial envelope. Int J Comput Vis. 2001;42:145–175. [Google Scholar]
- 34.Elliott DB, Hurst MA, Weatherill J. Comparing clinical tests of visual function in cataract with the patient's perceived visual disability. Eye. 1990;4:712–717. doi: 10.1038/eye.1990.100. [DOI] [PubMed] [Google Scholar]
- 35.Superstein R, Boyaner D, Overbury O. Functional complaints, visual acuity, spatial contrast sensitivity, and glare disability in preoperative and postoperative cataract patients. J Cataract Refract Surg. 1999;25:575–581. doi: 10.1016/s0886-3350(99)80059-5. [DOI] [PubMed] [Google Scholar]
- 36.Satgunam P, Woods RL, Luo G, Bronstad PM, Reynolds Z, Ramachandra C, Mel BW, Peli E. Effects of contour enhancement on low-vision preference and visual search. Optom Vis Sci. 2012;89:XXX–XXX. doi: 10.1097/OPX.0b013e318266f92f. [DOI] [PMC free article] [PubMed] [Google Scholar]
- 37.Fullerton M, Woods RL, Vera-Diaz FA, Peli E. Measuring perceived video quality of MPEG enhancement by people with impaired vision. J Opt Soc Am (A) 2007;24:B174–B187. doi: 10.1364/josaa.24.00b174. [DOI] [PMC free article] [PubMed] [Google Scholar]


