Abstract
Synthetic polymer nanoparticles (NPs) that display high affinity to protein targets have significant potential for medical and biotechnological applications as protein capture agents or functional replacements of antibodies (“plastic antibodies”). In this study, we modified an immunological assay (enzyme-linked immunosorbent assay: ELISA) into a high-throughput screening method to select nanoparticles with high affinity to target proteins. Histone and fibrinogen were chosen as target proteins to demonstrate this concept. The selection process utilized a biotinylated NP library constructed with combinations of functional monomers. The screen identified NPs with distinctive functional group compositions that exhibited high affinity to either histone or fibrinogen. The variation of protein affinity with changes in the nature and amount of functional groups in the NP provided chemical insight into the principle determinants of protein-NP binding. The NP affinity was semi-quantified using the ELISA-mimic assay by varying the NP concentrations. The screening results were found to correlate with solution-based assay results. This screening system utilizing a biotinalated NP is general approach to optimize functional monomer compositions and can be used to rapidly search for synthetic polymers with high (or low) affinity for target biological macromolecules.
Introduction
Synthetic materials with high affinity for biomolecules have significant potential for medical and biotechnological applications. Nanomaterials including synthetic polymer nanoparticles (NPs)1,2, gold NPs3,4 and linear polymers5 have been developed with high affinity to peptides1a–d, proteins2–5, polysaccharides1e and nucleic acids3b,c. These studies utilized NPs with combinations of charged, hydrophobic and/or hydrophilic functional groups that were tailored to target a specific biomacromolecule to achieve affinity.
Our research has focused on generating synthetic polymer NPs with an intrinsic affinity for target biomacromolecules based on their chemical composition. This approach has led to the development of NPs with high affinity (Kd ~ 1 nM) for the peptide melittin, the principle component of honeybee venom. These NPs were found to neutralize the toxicity in vitro and in vivo.1a–d These results establish the potential for creating synthetic polymer capture agents with antibody-like affinity and selectivity with the capability of functioning in a complex biological milieu such as the bloodstream of a living mouse. The protocol for producing NPs with high affinity and selectivity is an iterative process. First a small library of NPs containing functional groups complimentary to the presentation of functional groups on the target peptide or protein is synthesized. This is achieved by copolymerizing various ratios of functional monomers (charged, hydrogen bond donor and acceptors, hydrophobic and hydrophilic) complementary to the target biomacromolecule. The individual NPs in the library are evaluated for their affinity to the target biomacromolecule. NP “hits” are resynthesized to establish the optimum composition for affinity. In some cases the final NP synthesis is carried out in the presence of small amounts of the peptide target or epitope. This molecular imprinting (MIP) step is implemented to enhance the capacity, affinity and/or selectivity of the monomer-optimized NPs1d, 1f, although more recent studies have achieved comparable high affinity without this last step.1b
Antibodies achieve affinity with ionic, hydrogen bond and hydrophobic interactions with functional groups from the side chains of amino acids. Our initial experiments were with synthetic polymer NPs that contained a very limited range of functional monomers. The NPs were screened against the biomacromolecule one at a time. To increase the probability of identifying synthetic polymer NPs with high affinity for a broader range of target proteins, it will be necessary to expand the pool of functional monomers used to generate the libraries of NPs. This would rapidly increase the possible combinations and ultimately numbers of NPs that need to be screened. To do this efficiently, it is necessary to establish a high-throughput screening method to evaluate affinity of the diverse NPs to target proteins. In this study, we describe an immunological assay (enzyme-linked immunosorbent assay: ELISA) that has been modified into a screening method to identify high affinity synthetic polymer NPs. To demonstrate this concept the screen was used to identify NPs with affinity to histone and fibrinogen proteins. The NP library was constructed from monomers containing a range of charged and hydrophobic functional groups.
Concept
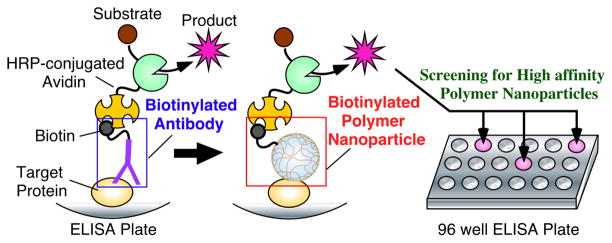
ELISA is a quantification method to detect the presence of a target antigenic protein in a sample6 (Figure 1 left). In an ELISA assay, a sample is immobilized on a surface of a multi-well plate. A biotinylated antibody specific to the target antigen is then added. After washing to remove unbound antibody, avidin conjugated with an enzyme (horseradish peroxydase; HRP) is added which immobilizes the enzyme on the plate through the avidin-biotin interaction. In the final step, a HRP substrate is added to produce a color change if the antigen was present in the sample. We have developed an ELISA-mimic system as a screen to identify NPs with high affinity for target proteins (Figure 1). In the ELISA-mimic screening protocol, a biotinylated NP is used instead of a biotinylated antibody to evaluate the affinity of the NPs to a target protein. If a biotinylated NP has affinity to a target protein, HRP is immobilized through an avidin-biotin interaction and the information can be read out by the color change of the substrate. This modified ELISA screen is implemented using a multi-well plate so a large number of NP samples can be assayed in parallel. This high-throughput feature has significant advantage compared to previous analytical methods including biosensors and calorimetry.
Figure 1.
The concept of an ELISA-mimic screen (middle and right). A standard ELISA using a biotinylated antibody is also illustrated (left).
EXPERIMENTAL SECTION
Materials
All reagents were obtained from commercial sources: N-isopropylacrylamide (NIPAm), acrylic acid (AAc), (3-acrylamidopropyl)trimethylammonium chloride (QAm; 75 wt % in H2O), hexadecyltrimethylammonium bromide (CTAB), azobisisobutyronitrile (AIBN), ammonia persulfate (APS), triethylamine (TEA), N,N-diisopropylethylamine (DIEA), hydroquinone and SIGMAFAST™ OPD tablet were from Sigma-Aldrich, Inc.; N,N′-methylenebisacrylamide (BIS) was from Fluka; D-(+)-biotin, N-t-butylacrylamide (TBAm) and 1H-pyrazole-1-carboxamidine monohydrochloride were from ACRŌS Organics; N-(3-aminopropyl) methacrylamide hydrochloride (APM) was from Polysciences, Inc.; sodium vinylsulfonate (SAc; 25 wt% in H2O) was from Tokyo Chemical Indastry Co. Ltd.; sodium dodecyl sulfate (SDS) was from Fisher Scientific; Tween 20 was J T Baker Chemicals Co.; Horseradish peroxidase (HRP)-conjugated avidin was from MP biomedicals; Histone, from calf thymus (Type III-S) and Fibrinogen from human plasma fraction II, type III were from Sigma; Immuno MicroWell™ 96-well plate (Maxisorp™, flat-bottom, pinchibar, 400 μL) was from Nunc. A biotin monomer (N-(3-methacrylamidopropyl)-D-biotinamide; Bio) and a guanidinium monomer (N-(3-methacrylamidopropyl) guanidinium chloride; Gua) were synthesized (see supporting information (SI)). NIPAm was recrystalized from hexane before use. Other chemicals were used as received. Water used in polymerization and characterization was distilled and then purified using a Barnstead Nanopure Diamond™ system.
Preparation of negatively charged NPs (AAc and SAc NPs)
Negatively charged NPs (AAc and SAc NPs) were synthesized as follows. NIPAm (98–X–Y–Z mol %), TBAm (X mol %), BIS (2 mol %), Bio (Y mol %), negatively charged monomer (AAc or SAc; Z mol %), and SDS (10 mg) were dissolved in water (50 mL). TBAm was dissolved in 1 mL of ethanol before addition to the monomer solution, resulting in a total monomer concentration of 65 mM. The resulting solutions were filtered through a standard grade filter paper (Whatman) and nitrogen was bubbled through the reaction mixtures for 30 min. Following the addition of APS aqueous solution (30 mg/500 μl), the polymerization reaction was carried out at 60–65 °C for 3 hours under a nitrogen atmosphere. The polymerized solutions were purified by dialysis against excess amount of pure water (twice a day changes) for 4 days.
Preparation of positively charged NPs (QAm and Gua NPs)
Positively charged NPs (QAm and Gua NPs) were synthesized as follows. NIPAm (98–X–Y–Z mol %), TBAm (X mol %), BIS (2 mol %), Bio (Y mol %), positively charged monomer (QAm or Gua; Z mol %), and CTAB (20 mg) were dissolved in water (50 mL). TBAm was dissolved in 1 mL of ethanol before addition to the monomer solution, resulting in a total monomer concentration of 65 mM. The resulting solutions were filtered through a standard grade filter paper (Whatman) and nitrogen was bubbled through the reaction mixtures for 30 min. Following the addition of AIBN acetone solution (30 mg/500 μl), the polymerization reaction was carried out at 60–65 °C for 3 hours under a nitrogen atmosphere. The polymerized solutions were purified by dialysis against excess amount of pure water (twice a day changes) for 4 days.
ELISA-mimic screen of NPs
Proteins (histone or fibrinogen) were dissolved in phosphate-buffered saline (PBS; 35 mM phoshate and 150 mM NaCl, pH 7.3) to give protein solutions (500 μg/mL, respectively). The solutions (100 μL each) were loaded in the wells of an Immuno MicroWell™ 96-well plate (Maxisorp™, flat-bottom, pinchibar, 400 μL) to immobilize the proteins on the plate through physical adsorption. After the immobilization for 1 h at room temperature, each well was washed twice with 250 μL of PBS buffer. NP-PBS solutions (AAc, SAc, QAm and Gua NPs) were prepared mixing 125 μL of the NP solution with an equal amount of two times concentrated PBS buffer and loaded in the wells of the protein-immobilized plate. After the incubation for 1 h at room temperature, each well was washed three times with 250 μL of PBS buffer including 0.05% of Tween 20. HRP-conjugated avidin stock solution (3 μL; 1.79 mg/mL in 0.014 M sodium phosphate, 0.1 M sodium chloride, pH 7.3, with 0.7% bovine albumin, 36% glycerol, and 0.01% thimerosal) was diluted with 21 mL of PBS buffer and the solution (200 μL each) was loaded in the wells of the plate. After the incubation for 1 h at room temperature, each well was washed three times with 250 μL of PBS buffer. The substrate solution was prepared using SIGMAFAST™ OPD tablet kit (Sigma-Aldrich) in the instructed manner (0.4 mg/mL o-phenylendiamine, 0.4 mg/mL urea hydrogen peroxide, 0.05 M phosphate-citrate, pH 5.0) and 200 μL of the solution was loaded in the each well of the plate. After the incubation for 4 min at room temperature, 50 μL of 3 N HCl solution was added into the each well to stop the enzyme reaction. The absorbance at 492 nm of each well was measured by μQuant™ Microplate Spectrophotometer (Bio-Tek instrument, inc.).
UV-visible spectrometry
Interactions of the NPs (AAc, SAc, QAm and Gua NPs without a biotin group) with histone and fibrinogen were evaluated by filtration and UV-visible spectrometry (NanoDrop 2000c, 10 mm cuvette, Thermo Scientific).
Interactions of histone and NPs
Histone was dissolved in phosphate-buffered saline (PBS; 35 mM phoshate and 150 mM NaCl, pH 7.3) and mixed with NP solutions to give a final volume of 600 μL (the final concentrations of histone and NPs were 500 μg/ mL and 1000 μg/mL, respectively). The NP-histone solution was incubated at 37 °C for 30 min. Aggregation was observed in some cases. Samples were centrifuged at 15,700 g for 10 min and the supernatant was filtrated through 0.02 μm syringe filter (Anotop 10, Whatman) to remove the NP and the histone that bound to the NP. The histone concentration in the filtered supernatants was measured by a modified Lowry assay7 using a DC protein assay kit (Bio-Rad Laboratories, Inc.) because of a lack of the absorbance at 280 nm of histone. The standard curve of a histone concentration was prepared following the kit instruction ranging from 25 to 500 μg/mL of histone solution (the absorbances of 25, 50, 125, 200, 350 and 500 μg/mL were plotted, respectively). The bound amount of histone to the NP (%) was calculated using the equation 1, where Chistone is the histone concentration in the filtered supernatant and Cinitial is the initial concentration of the hisotone (500 μg/mL), respectively.
| (1) |
Interactions of fibrinogen and NPs
Fibrinogen was dissolved in phosphate-buffered saline (PBS; 35 mM phoshate and 150 mM NaCl, pH 7.3) and mixed with NP solutions to give a final volume of 600 μL (the final concentrations of fibrinogen and NPs were 500 μg/ mL and 1000 μg/mL, respectively). The NP-fibrinogen solution was incubated at 37 °C for 30 min. Aggregation was observed in some cases. Samples were centrifuged at 15,700 g for 10 min and the supernatant was filtrated through 0.1 μm syringe filter (Millex®-VV hydrophilic PVDF, Millipore) to remove the NP and the fibrinogen that bound to the NP. The absorbance at 280 nm of the filtered supernatant was measured. The bound amount of fibrinogen to the NP (%) was calculated using the equation 2, where ANP-fibrinogen and Afibrinogen are the absorbance at 280 nm with or without NPs, respectively.
| (2) |
RESULTS AND DISCUSSION
Target Proteins and the Biotinylated NP Library
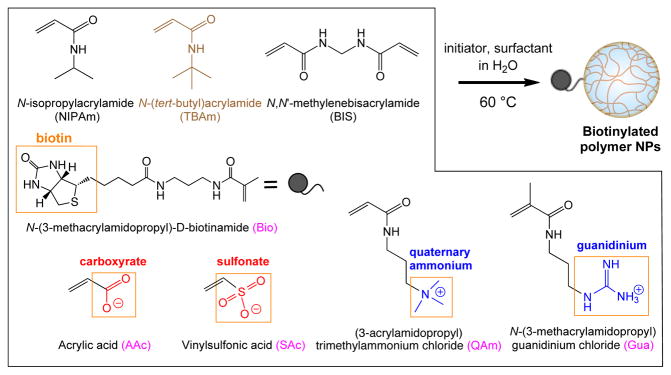
For these studies, two distinct proteins, histone (hydrophobic, pI = 11)8–11 and fibrinogen (hydrophobic, pI = 5.5)12–14, were chosen as targets. N-isopropylacrylamide (NIPAm) based hydrogel NPs were prepared containing 1 mol % of a biotin monomer (N-(3-methacrylamidopropyl)-D-biotinamide; Bio) and 2 mol % of a cross linker (N,N′-methylenebisacrylamide; BIS) to construct a NP library (Figure 2). Hydrophobic groups were incorporated in the NPs by inclusion of 40 mol % of N-t-butylacrylamide (TBAm). NPs without TBAm were also prepared to compare the contribution of hydrophobic groups. Four types of charged functional monomers were used (5 or 20 mol %, each) to examine the electrostatic contributions to affinity: a carboxylate monomer (acrylic acid; AAc) and a sulfonate monomer (sodium vinylsulfonate; SAc) were selected as negatively charged monomers, and a quaternary ammonium monomer ((3-acrylamidopropyl)trimethylammonium chloride; QAm) and a guanidinium monomer (N-(3-methacrylamidopropyl) guanidinium chloride; Gua) were selected as positively charged monomers (see supporting information (SI) for synthesis of Bio and Gua). NPs were prepared by a precipitation polymerization from aqueous solutions containing small amounts of surfactant. Following extensive dialysis of the resultant NP solutions to remove the surfactant and oligomers, the hydrodynamic diameter of the NPs were measured by dynamic light scattering (DLS). All NPs were monomodal (Table S1 and S2 in SI).
Figure 2.
Preparation of a biotinylated NP library. Monomers incorporating hydrophobic (TBAm 40%) and charge (AAc, SAc, QAm and Gua) were individually incorporated at loadings of 5 or 20%.
ELISA-mimic Screen
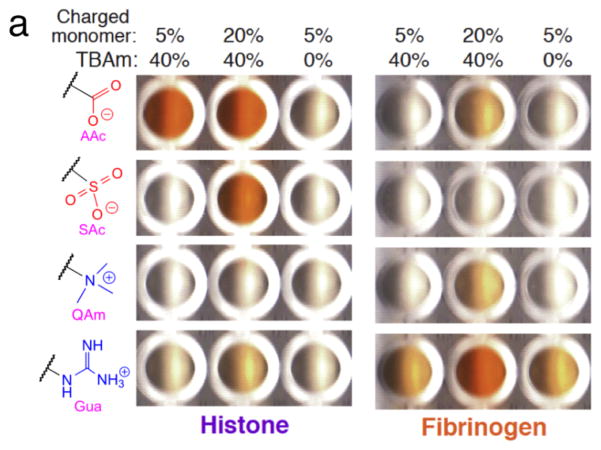
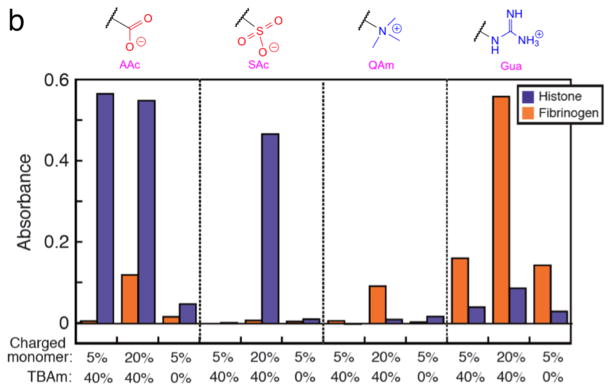
An ELISA-mimic screen of NPs was implemented using the NP library (Figure 3). Target proteins (histone or fibrinogen) were immobilized on the surfaces of a 96-well ELISA plate (Maxisorp™, Nunc) by physical adsorption. After washing the wells with phosphate-buffered saline (PBS; 35 mM phoshate and 150 mM NaCl, pH 7.3), biotinylated NP solutions in PBS (AAc, SAc, QAm and Gua NPs; 500 μg/mL, each) were added to the protein-immobilized wells and incubated for 1 h at room temperature. After washing with PBS including 0.05% of Tween 20, HRP-conjugated avidin solution was loaded into the wells and incubated for 1 h at room temperature. The substrate solution for HRP (o-phenylendiamine; OPD) was prepared (0.4 mg/mL OPD, 0.4 mg/mL urea hydrogen peroxide, 0.05 M phosphate-citrate, pH 5.0) and added into the washed wells at room temperature. A color change was observed in some wells indicating the generation of product (Figure 3a). A control experiment using NPs without a biotin group gave no significant signal (Figure S1 in SI) indicating HRP was immobilized through specific avidin-biotin interaction. The enzyme reaction was quenched by addition of an HCl solution after 4 min and the absorbance particular to the product (at 492 nm) was measured with a microplate spectrophotometer (Figure 3b). In the case of histone-immobilized wells, AAc containing NPs (both 5% and 20%) incorporating TBAm groups showed the strongest signals. Histone is a basic protein containing a number of surface exposed arginine and lysine residues.9,10 We attribute the tight binding in part to electrostatic interactions between negatively charged NPs and the positively charged histone. In addition, a guanidinium group of an arginine residue in histone can form a strong salt bridge with a carboxylate group of the AAc containing NPs through two parallel hydrogen bonds.15 This robust binding can assist the strong association. Interestingly, the signal arising from AAc NPs without TBAm groups is significantly diminished. This result is significant since it suggests that strong NP binding to histone does not arise solely from charged interactions but also requires hydrophobic groups in the NP. These groups can bind to the hydrophobic domain of the histone core of the H2A, H2B, H3 and H4 families.9–11 Compared to AAc containing NPs, SAc NPs showed weaker signals, especially in the case of NPs incorporating SAc 5% with TBAm. This result may be attributed to the diminished hydrogen-bonding ability of a sulfonate group compared to a carboxylate group16 with a guanidinium group on the histone. In the case of positively charged NPs (QAm and Gua), no significant signals were observed presumably due to charge repulsion between these NPs and the positively charged histone. In the case of fibrinogen, which is a hydrophobic and negatively charged protein12,13, the signal pattern of the wells was significantly different from that of histone. NPs incorporating Gua, especially 20% with TBAm most tightly bound to fibrinogen presumably forming two parallel hydrogen bonds in addition to electrostatic interactions between guanidinium groups of the NP and carboxylate groups on fibriongen. Meanwhile, QAm NPs showed very slight affinity to fibrinogen. This may be explained by the fact that a quaternary ammonium group of QAm NPs can interact with fibrinogen only by an electrostatic interaction without forming hydrogen bonding. Negatively charged NPs (AAc and SAc) showed little interaction with fibrinogen due to charge repulsion.
Figure 3.
Results of ELISA-mimic screen for high affinity NPs against target proteins. (a) The images are of histone (left) and fibrinogen (right) immobilized plates. The molar ratios of charged and TBAm monomers in the NPs are indicated on the top. The specific charged groups of NPs are indicated at the left. (b) Quantification of the substrate color change by UV-Vis spectroscopy (purple: histone, orange: fibrinogen). A microplate reader was used to measure the absorbance (at 492 nm) of the product. The absorbance was the mean value of two wells (n = 2) under identical conditions on the same plate. The charged groups of NPs are indicated on the top. The molar ratios of charged and TBAm monomers are indicated at the bottom, respectively.
Quantification of NP Affinities
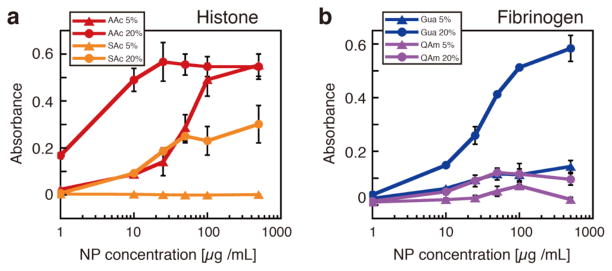
The ELISA-mimic screen was used to quantify protein binding against selected NPs by systematically reducing the NP concentrations. Biotinylated NPs including 5% or 20% of charged groups and TBAm were selected for the affinity evaluation (AAc and SAc NPs for histone, QAm and Gua NPs for fibrinogen). The diluted NP solutions (ranging from 1 to 500 μg/mL) were incubated with the protein-immobilized wells and the absorbance of the catalyzed product was measured in the same manner as above. For AAc NPs against histone (Figure 4a), AAc 20% NP still showed the maximum signal intensity (absorbance: 0.55) up to 10 μg/mL of the NP concentration. In contrast, the absorbance of AAc 5% NP started to decrease at 100 μg/mL. We used the NP concentration at which the absorbance was at half-maximum as the criteria for the NP affinity (50% effective concentration: EC50). Based on this criteria, the EC50 of AAc 5% and 20% were ~50 μg/mL and ~3 μg/mL respectively. AAc 20% NP has approximately twenty times higher affinity than AAc 5% NP. This result can be attributed in part to a cooperative effect of polyvalent ionic and hydrogen bonding interactions between the AAc NP and histone as the mol % of AAc increases in the NP. With regard to Gua 20% NP against fibrinogen (Figure 4b), the EC50 was ~30 μg/mL and the affinity is comparable to that of AAc 5% NP against histone. The results of the NP affinity estimation demonstrate that the ELISA-mimic screen enables not only selection of high affinity NPs to a target protein but also quantitative comparison of the NP affinities.
Figure 4.
NP concentration dependences of the signal intensity of ELISA-mimic screen. The biotinylated NPs including 5% (triangle) or 20% (circle) of charged groups and TBAm group were evaluated. (a) AAc and SAc NPs for histone, (b) Gua and QAm NPs for fibrinogen. The data represent the average of four measurements and the error bars are standard deviations.
Comparison of the ELISA-mimic screen with a solution-based assay
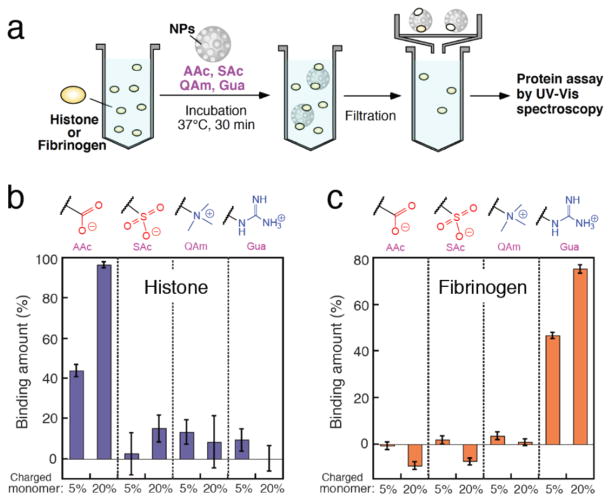
The ELISA-mimic screen is a plate-based analytical diagnostic. The high local concentration and limited rates of immobilized protein diffusion can contribute to the observed affinities. Solution-based assay results can differ substantially from plate-based analytical techniques. To compare the ELISA-mimic protein-NP affinities with those in solution phase, we investigated the interactions of NPs with histone and fibrinogen in solution by UV-visible spectrometry (Figure 5a). Histone and fibrinogen were dissolved in PBS and mixed with NP solutions (AAc, SAc, QAm and Gua including TBAm), respectively (the final concentrations of proteins and NPs were 500 μg/ mL and 1000 μg/mL, respectively). After incubation, samples were filtrated through a syringe filter (the pore size: 0.02 μm for histone, 0.1 μm for fibrinogen, respectively) to remove the NP and bound protein from solution. The amount of bound protein (%) was calculated by measuring the decrease of protein concentration in the filtrate. The fibrinogen concentration was calculated using the UV absorbance at 280 nm. The histone concentration was measured by a modified Lowry assay8 because of a lack of the absorbance at 280 nm of histone. In the case of the NP – histone interaction (Figure 5b), AAc 20% NP tightly bound and captured almost all histone in solution. AAc 5% NPs showed relatively low affinity capturing 40 wt% of histone. These results are qualitatively consistent with the estimated affinity of AAc NPs using the ELISA-mimic screen (Figure 4a). On the other hand, SAc 20% NP did not show an interaction with histone even though it showed a considerable signal intensity in the ELISA-mimic screen. This may be attributed to multipoint bindings of the NP to immobilized histones on the plate surface because the NP has many interaction sites and its size is substantially larger than histone (the diameter of the NP and histone are ~100 nm and ~10 nm 9, respectively). The cooperative effect of individually weak interactions can elevate the apparent affinity in the ELISA-mimic screen. Gua 20% NP and 5% NPs showed the highest and the second-highest affinity to fibrinogen, respectively (Figure 5c), a result in agreement with the ELISA-mimic screen. These results demonstrate that the affinities of the NPs evaluated by the ELISA-mimic screen are for the most part in qualitative agreement with the results of solution-based assay although the high local concentration of target proteins on the ELISA plate can in some cases be over emphasized in the ELISA-mimic assay.
Figure 5.
Interactions between NPs and target proteins (histone or fibrinogen) in solution phase. (a) Schematic diagram of the procedure. (b, c) Interactions between NPs and histone (b) or fibrinogen (c) assayed by UV-visible spectrometry. The charged groups of NPs are indicated on the top. The molar ratios of charged monomers are indicated at the bottom. Each NP includes TBAm 40%. Binding amount (%) of the protein to the NP was calculated using the protein concentrations in the filtrate that were quantified by a modified Lowry assay (b) or by the absorbance at 280 nm (c). The data represent the average of four measurements and the error bars are standard deviations.
CONCLUSIONS
In conclusion, we have established a high-throughput screen to identify synthetic polymer NPs with high affinity for target proteins using an ELISA mimicking system. The screen resulted in the selection of NPs with affinity for histone and fibrinogen. Observation of the variation of protein affinity with changes in the nature and amount of functional groups in the NP provides chemical insight into the principle determinants of protein-NP binding. Quantitative comparison of NP affinities is achieved by systematically reducing the NP concentrations to obtain a 50% effective concentration (EC50). The good agreement between the ELISA-mimic screen and a solution-based assay validated the utility of the screening protocol. This screening system utilizing a biotinalated NP is general approach to optimize functional monomer compositions and can be used to rapidly search for synthetic polymers with high (or low) affinity for target biological macromolecules.
Supplementary Material
Acknowledgments
Financial support from the National Institutes of Health (GM080506) is gratefully acknowledged. We also would like to thank Dr. Naoto Oku and Mr. Tomoki Yokoyama from University of Shizuoka for useful advice on ELISA procedures.
Footnotes
The authors declare no competing financial interest.
Synthesis of biotin and guanidinium monomers. ELISA-mimic screen using NPs without biotin groups. Characterization of NPs by dynamic light scattering (DLS). This material is available free of charge via the Internet at http://pubs.acs.org.
References
- 1.(a) Hoshino Y, Shea KJ. J Mater Chem. 2011;21:3517–3521. [Google Scholar]; (b) Hoshino Y, Koide H, Furuya K, Haberaecker WW, III, Lee S, Kodama T, Kanazawa H, Oku N, Shea KJ. Proc Natl Acad Sci USA. 2012;109:33–38. doi: 10.1073/pnas.1112828109. [DOI] [PMC free article] [PubMed] [Google Scholar]; (c) Hoshino Y, Urakami T, Kodama T, Koide H, Oku N, Okahata Y, Shea KJ. Small. 2009;5:1562–1568. doi: 10.1002/smll.200900186. [DOI] [PMC free article] [PubMed] [Google Scholar]; (d) Hoshino Y, Haberaecker WW, III, Kodama T, Zeng Z, Okahata Y, Shea KJ. J Am Chem Soc. 2010;132:13648–13650. doi: 10.1021/ja1058982. [DOI] [PMC free article] [PubMed] [Google Scholar]; (e) Zeng Z, Patel J, Lee S, McCallum M, Tyagi A, Yan M, Shea KJ. J Am Chem Soc. 2012;134:2681–2690. doi: 10.1021/ja209959t. [DOI] [PMC free article] [PubMed] [Google Scholar]; (f) Hoshino Y, Kodama T, Okahata Y, Shea KJ. J Am Chem Soc. 2008;130:15242–15243. doi: 10.1021/ja8062875. [DOI] [PubMed] [Google Scholar]
- 2.(a) Lynch I, Dawson KA. nanotoday. 2008;3:40–47. [Google Scholar]; (b) Cedervall T, Lynch I, Lindman S, Berggård T, Thulin E, Nilsson H, Dawson KA, Linse S. Proc Natl Acad Sci USA. 2007;104:2050–2055. doi: 10.1073/pnas.0608582104. [DOI] [PMC free article] [PubMed] [Google Scholar]; (c) Cabaleiro-Lago C, Quinlan-Pluck F, Lynch I, Lindman S, Minogue AM, Thulin E, Walsh DM, Dawson KA, Linse S. J Am Chem Soc. 2008;130:15437–15443. doi: 10.1021/ja8041806. [DOI] [PubMed] [Google Scholar]
- 3.(a) Moyano DF, Rotello VM. Langmuir. 2011;27:10376–10385. doi: 10.1021/la2004535. [DOI] [PMC free article] [PubMed] [Google Scholar]; (b) McIntosh CM, Esposito EA, III, Boal AK, Simard JM, Martin CT, Rotello VM. J Am Chem Soc. 2001;123:7626–7629. doi: 10.1021/ja015556g. [DOI] [PubMed] [Google Scholar]; (c) Han G, Chari NS, Verma A, Hong R, Martin CT, Rotello VM. Bioconjugate Chem. 2005;16:1356–1359. doi: 10.1021/bc050173j. [DOI] [PubMed] [Google Scholar]
- 4.(a) Aubin-Tam ME, Hamad-Schifferli K. Biomed Mater. 2008;3:034001. doi: 10.1088/1748-6041/3/3/034001. [DOI] [PubMed] [Google Scholar]; (b) Aubin-Tam M-E, Hamad-Schifferli Langmuir. 2005;21:12080–12084. doi: 10.1021/la052102e. [DOI] [PubMed] [Google Scholar]
- 5.(a) Schrader T, Koch S. Mol BioSyst. 2007;3:241–248. doi: 10.1039/b614103j. [DOI] [PubMed] [Google Scholar]; (b) Koch SJ, Renner C, Xie X, Schrader T. Angew Chem Int Ed. 2006;45:6352–6355. doi: 10.1002/anie.200601161. [DOI] [PubMed] [Google Scholar]; (c) Renner C, Piehler J, Schrader T. J Am Chem Soc. 2006;128:620–628. doi: 10.1021/ja0560229. [DOI] [PubMed] [Google Scholar]
- 6.(a) Engvall E, Perlman P. Immunochemistry. 1971;8:871–874. doi: 10.1016/0019-2791(71)90454-x. [DOI] [PubMed] [Google Scholar]; (b) Van Weemen BK, Schuurs AHWM. FEBS Lett. 1972;15:232–236. doi: 10.1016/0014-5793(71)80319-8. [DOI] [PubMed] [Google Scholar]
- 7.Lowry OH, Rosebrough NJ, Farr AL, Randall RJ. J Biol Chem. 1951;193:265–275. [PubMed] [Google Scholar]
- 8.Schmiedeke TMJ, Stöckl FW, Weber R, Sugisaki Y, Batsford SR, Vogt A. J Exp Med. 1989;169:1879–1894. doi: 10.1084/jem.169.6.1879. [DOI] [PMC free article] [PubMed] [Google Scholar]
- 9.Luger K, Mäder AW, Richmond RK, Sargent DF, Richmond TJ. Nature. 1997;389:251–260. doi: 10.1038/38444. [DOI] [PubMed] [Google Scholar]
- 10.Lindner HH. Electrophoresis. 2008;29:2516–2532. doi: 10.1002/elps.200800094. [DOI] [PubMed] [Google Scholar]
- 11.Daban JR, Guasch MD. Biochim Biophys Acta. 1980;625:237–247. doi: 10.1016/0005-2795(80)90287-1. [DOI] [PubMed] [Google Scholar]
- 12.Mosesson MW. J Thromb Haemost. 2005;3:1894–1904. doi: 10.1111/j.1538-7836.2005.01365.x. [DOI] [PubMed] [Google Scholar]
- 13.Ghose S, McNerney TM, Hubbard B. Biotechnol Bioeng. 2004;87:413–423. doi: 10.1002/bit.20125. [DOI] [PubMed] [Google Scholar]
- 14.Zhou X, Zhou J. Proteomics. 2006;6:1415–1426. doi: 10.1002/pmic.200500138. [DOI] [PubMed] [Google Scholar]
- 15.Schmidtchen FP, Berger M. Chem Rev. 1997;97:1609–1646. doi: 10.1021/cr9603845. [DOI] [PubMed] [Google Scholar]
- 16.Kelly TR, Kim THMH. J Am Chem Soc. 1994;116:7072–7080. [Google Scholar]
Associated Data
This section collects any data citations, data availability statements, or supplementary materials included in this article.


