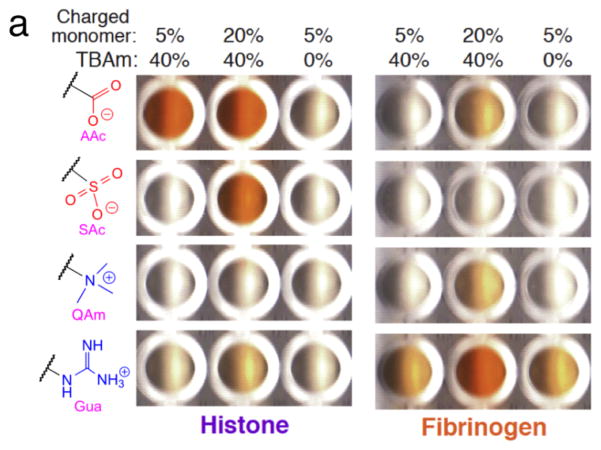
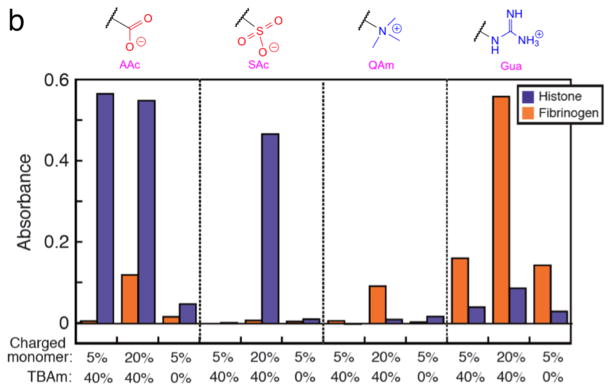
Figure 3.
Results of ELISA-mimic screen for high affinity NPs against target proteins. (a) The images are of histone (left) and fibrinogen (right) immobilized plates. The molar ratios of charged and TBAm monomers in the NPs are indicated on the top. The specific charged groups of NPs are indicated at the left. (b) Quantification of the substrate color change by UV-Vis spectroscopy (purple: histone, orange: fibrinogen). A microplate reader was used to measure the absorbance (at 492 nm) of the product. The absorbance was the mean value of two wells (n = 2) under identical conditions on the same plate. The charged groups of NPs are indicated on the top. The molar ratios of charged and TBAm monomers are indicated at the bottom, respectively.


