

Abstract
We synthesized extremely deformable red blood cell-like microgel particles and loaded them with bovine hemoglobin (Hb) to potentiate oxygen transport. With similar shape and size as red blood cells (RBCs), the particles were fabricated using the PRINT® (Particle Replication In Non-wetting Templates) technique. Low crosslinking of the hydrogel resulted in very low mesh density for these particles, allowing passive diffusion of hemoglobin throughout the particles. Hb was secured in the particles through covalent conjugation of the lysine groups of Hb to carboxyl groups in the particles via EDC/NHS coupling. Confocal microscopy of particles bound to fluorescent dye-labeled Hb confirmed the uniform distribution of Hb throughout the particle interior, as opposed to the surface conjugation only. High loading ratios, up to 5 times the amount of Hb to polymer by weight, were obtained, without a significant effect on particle stability, shape, though particle diameter decreased slightly with Hb conjugation. Analysis of the protein by circular dichroism (CD) spectroscopy showed that the secondary structure of Hb was unperturbed by conjugation to the particles. Methemoglobin in the particles could be maintained at a low level and the loaded Hb could still bind oxygen as studied by UV-vis spectroscopy. Hb-loaded particles with moderate loading ratios demonstrated excellent deformability in microfluidic devices, easily deforming to pass through restricted pores half as wide as the diameter of the particles. The suspension of concentrated particles with Hb concentration of 5.2 g/dL showed comparable viscosity to that of mouse blood, and the particles remained intact even after being sheared at a constant high rate (1,000 1/s) for 10 min. Armed with the ability to control size, shape, deformability, and loading of Hb into RBC mimics, we will discuss the implications for artificial blood.
Introduction
Synthetic oxygen carriers have long been pursued as blood substitutes in order to supplement or even replace blood transfusions, because donor blood has limited availability, infectious risks, and also requires cross-matching1–3. The short 42-day shelf-life of donated blood also intensifies the shortage of blood4. Great efforts have been devoted to the synthesis of blood substitutes, especially hemoglobin-based oxygen carriers (HBOCs), which employ the oxygen carrying molecule hemoglobin (Hb) that has been isolated from red blood cells (RBCs). Hemoglobin (~64 kDa) is a tetramer of two α and two β subunits, each of which has an iron-containing heme group, capable of binding to oxygen5. Outside of a cell, free Hb is cleared quickly (half-life of 0.5~1.5 h) from the circulation by the kidney due to dissociation into two dimers (αβ), causing severe renal toxicity6 and many other adverse effects, including vasoconstriction, hemorrhagic lesions7. Techniques to solve (partially) these problems have been explored, including crosslinking or polymerizing Hb molecules and conjugating Hb to other polymers8. However, these protein modifications resulted in altered oxygen affinity and cooperativity that led to some adverse effects, such as increased vasoactivity. Recent research on HBOCs has mainly focused on encapsulation of Hb into nano-sized carriers such as liposomes9,10, polymersomes11,12, micelles13, nanogels14,15, and porous nanoparticles16. In most of these studies, concentrated Hb solutions were mixed with lipids or polymers, from which the self-assembled structures entrapped Hb solutions inside. One challenge with HBOCs is the facile autoxidation of oxyhemoglobin into methemoglobin (metHb)17, an inactive version of the protein which no longer functions in carrying oxygen. In RBCs, metHb is converted back into Hb by enzymes present in the cells. In HBOCs, reducing agents as well as enzymes have been successfully employed to help maintain low levels (<10%) of metHb even after 12 months18.
Another remaining concern on HBOCs is their insufficient circulation times, much shorter than that of native RBCs (~120-day life span; 28-day half-life from donor blood), leaving enormous room for improvement. Most reported half-lives of HBOCs were limited below 50 h regardless of the species tested, though a 65-h half-life was reported for one liposome-based HBOC in rabbits19. Macrophages in the mononuclear phagocyte system (MPS)20,21 are very efficient in removing foreign particles through the process of engulfing them by the cell membrane (phagocytosis), which depends on size, shape and surface characteristics of the particles22. To increase the circulation times of HBOCs based on nanoparticles, well established strategies for the evasion of the MPS, including size control and surface PEGylation23, have been applied to HBOCs to prolong the circulation times. Besides size and shape, there are several papers which show that even particle modulus or deformability plays a significant role in determining the rate of particle internalization by macrophages through phagocytosis24,25. One characteristic of RBCs that make them long circulating, along with their shape and specific surface protein, is their high deformability which enables RBCs to pass through restrictions in the vasculature that are smaller than the RBC diameter. Previously, it was believed that man-made microparticles would be cleared from the circulation very quickly due to mechanical filtration in small blood vessels26; to the best of our knowledge, no prior strategies have employed “large” microparticles with size similar to RBCs for HBOCs. A recent study in our group challenged this long standing dogma by mimicking the size, shape and deformability of RBCs with hydrogel microparticles27. We showed that very deformable microparticles that were similar in size and shape to RBCs could bypass in vivo restrictions, leading to dramatic increases in circulation times (~94-h half-life in Balb/c mice).
In this current study, we extend our mimicry of RBCs further with the incorporation of bovine Hb into RBC mimicking (RBCM) particles, paving the way toward new oxygen carriers. Although there have been concerns with the use of non-human Hb regarding immunogenicity, there is no firm evidence that pure bovine Hb can cause immunological disorders. So far, human and bovine hemoglobin have been the major raw materials used in the manufacture of HBOCs. Hemopure (OPK Biotech, MA) and PEG-Hemoglobin (Enzon, NJ) both use bovine Hb to make HBOCs, and they are considered very poor immunogens28. Therefore, if bovine hemoglobin is purified with care to remove other immunogenic proteins in blood, the concern can be minimized. These RBCM microparticles were fabricated using the PRINT® technique developed in our laboratory29. A very low amount of crosslinker, poly(ethylene glycol) diacrylate (MW=4,000 g/mol; abbreviated as PEG4kDA) was used to lightly crosslink the particles made of triethylene glycol acrylate (TEGA) and 2-carboxylethyl acrylate (CEA). In addition to providing these microgels with a low modulus similar to that of RBCs, the low mesh density allowed Hb molecules to diffuse into the interior of the particles. The activated carboxyl groups of CEA and amine groups of lysine in Hb could be conjugated to achieve a high loading ratio of Hb to polymer. The particles remained highly deformable after conjugating moderate amounts of Hb, and the secondary structure of Hb was retained. The conjugated Hb in the particles could still bind oxygen while a concentrated suspension of the particles with [Hb]= 5.2 g/dL had similar viscosity to mouse blood.
Experimental Section
Materials
Acryloyl chloride, triethylene glycol, CEA, 1-hydroxycyclohexyl phenyl ketone (HCPK), fluorescein-o-acrylate, bovine Hb, Dulbecco’s phosphate buffer saline (PBS), potassium cyanide (KCN) and potassium ferricyanide (K3Fe(CN)6), sodium dithionite, ascorbic acid, carbon monoxide, were all received from Sigma-Aldrich. Polyethylene glycol (MW=4,000 g/mol) diacrylate (PEG4kDA), methacryloxyethylthiocarbamoyl rhodamine B (PolyFluor® 570) were from Polysciences, Inc. Sulfo-N-Hydroxysuccinimide (NHS), 1-ethyl-3-(3-dimethylaminopropyl) carbodiimide hydrochloride (EDC), Fluorescein-NHS, Rhodamine-NHS, AF488-Bovine Serum Albumin (BSA) and 2-(N-morpholino) ethanesulfonic acid (MES) buffer were all received from Thermo Scientific. Perfluropolyether molds were received from Liquidia Technologies. Sylgard® 184 for making microfluidic devices was from Dow Corning. DI water was used and all the other organic solvents were received from Fisher Scientific.
Synthesis of triethylene glycol acrylate (TEGA)
TEGA was synthesized from reacting acryloyl chloride with triethylene glycol at a 3:7 molar ratio to obtain a larger fraction of the monofunctional monomer. The reaction was modified from a previous report30. See supporting information for more details.
Synthesis of dye-labeled Hb
To 1 mL Hb solution (20 mg/mL) in borate buffer (pH=8.5), 220 μL DMF solution of fluorescein-NHS or rhodamine-NHS (10 mg/mL) was added and allowed to react at RT for 1 h. The resulting solution was transferred to Slide-A-Lyzer dialysis units (Thermo Scientific) with a cut-off size of 20 kDa. The dye-labeled Hb solution was dialyzed against 1L DI water for 12 h (water changed twice) to completely remove the excess dye-NHS. The purified dye-Hb solution was collected into an eppendorf tube covered by aluminum foil and stored at 4 °C before use.
Synthesis of poly(TEGA-co-CEA)
A mixture of TEGA (899 mg) and CEA (100 mg) with 1% HCPK (1 mg) was purged with nitrogen for 15 min. Deoxygenated methanol (6 mL) was added to the monomer mixture to obtain a homogenous solution. The solution was irradiated by UV light ( =365 nm, power =20 mW/cm2) for 8 min under nitrogen purge. After curing, water was added to the polymer solution and dialyzed using a Slide-A-Lyzer dialysis unit with a cut-off size of 3 kDa. The dialyzed polymer solution was lyophilized to weigh the dry sample. About 5 mg of the dry polymer was dissolved in 1 mL filtered DMF and subjected to GPC (Waters) analysis on the molecular weight using PEO standard.
Modulus Testing
Macroscopic coupons of the prepolymer mixtures were polymerized via UV light (λ=365 nm, power =20 mW/cm2) for 8 min in a Teflon mold. The crosslinked samples were removed from the mold, weighed and measured, and then placed in pH=7.4 PBS buffer for 24 h to fully hydrate. The coupons were patted dry with paper towels and weighed again prior to testing with an Instron 5556 Universal Testing Machine with a strain rate of 5 mm/min. The modulus was calculated from fitting the stress-strain curve within 10% strain.
Particle fabrication and characterization
The prepolymer mixture was spread onto a mold that was chilled to 2–5 °C (to prevent evaporation of the prepolymer solution prior to UV-curing) on a custom-built laminator platform. A poly(ethylene terepthalate) (PET) sheet was laminated to the top of the mold and prepolymer solution, wetting the total mold area. The sheet was peeled away at the nip point of the laminator, leaving the wells of the mold filled while wicking away excess solution. The filled mold was immediately transferred into a chilled (2–5 °C), nitrogen purged UV oven and cured with UV light (λ= 365 nm, power=20 mW/cm2) for 3 min. After curing, the filled mold was placed face down and laminated onto a thin film of 0.1% poly(vinyl alcohol) (PVOH, 2,000 g/mol, Acros) casted on another PET sheet. This assembly was placed on the chilled plate of the laminator for 1 min, and then the mold was peeled away, leaving the particles transferred onto the PVOH film because the dry particles were very sticky as confirmed by the bulk sample. By adding PBS to dissolve the PVOH film on the PET sheet, the particles became dispersed into PBS, which was collected to harvest the particles. The resulting particle suspension in PBS was spun down and washed by PBS to remove the soluble fractions and excess PVOH for 3 times. Finally, particles were suspended in PBS containing 0.1 wt% PVOH (22, 000 g/mol) for subsequent experiments. The concentration of particle suspensions was determined by thermogravimetric analysis (TGA) on a Perkin Elmer Pyris TGA. Both the suspension and the supernatant after spinning down the particles were subjected to TGA at the same volume (20 μL) to obtain the dry weight. The difference in the weight divided by the volume was the concentration of that particle suspension.
Particle characterization
Particle dimensions were determined by analysis of images taken from a microscope mounted camera (Zeiss AxioCam MRm) using a 100× objective (Zeiss Axio Imager D.1M). Over 50 fully hydrated particles in PBS were measured for each case. The ζ-potentials for particles were measured on a Malvern nano-ZS zetasizer. The particle suspension was spun down and washed 3 times to remove PVOH, and resuspended into 0.1X PBS for the measurement at a concentration of around 0.3 mg/mL. All the experiments were performed at 25 °C.
Protein Conjugation to particles and polymers
In a typical reaction of Hb to particles: to 0.4 mg particles suspended in 0.5 mL MES buffer (pH=4.5) was added with 100 μL EDC solution in MES (0.7 mg/mL) and 100 μL sulfo-NHS solution in MES (2 mg/mL). The resulting suspension was allowed to shake at RT for 20 min. Then the particles were spun down at 10,000 g centrifugation and washed for 3 times with PBS to remove excess EDC, sulfo-NHS. The particles were resuspended into 200 μL PBS; to this suspension, different amounts of Hb (from 0.2 mg to 4 mg) were added and the final volume of reaction was remained at 0.4 mL. The conjugation continued for 12 h at 4 °C in a shaker (Eppendorf) at 1,000 rpm. After reaction, the resulting Hb-particles were washed 3 times in PBS and resuspended into 0.4 mL PBS for future characterizations. Dye-labeled Hb and AF488-BSA were conjugated to the particles following a similar protocol. To calculate the loading ratio of BSA, a Coomassie assay was used to measure the depletion of BSA in the solution after conjugation with the particles.
To conjugate Hb to poly(TEGA-co-CEA), the polymer was dissolved in MES buffer and added with EDC, sulfo-NHS similarly to the above procedure for particles. After activation for 20 min at RT, the solution was added with PBS and filtered using a centrifugal filtering device (cut-off size=3k Da; Millipore) to quickly remove excess EDC/NHS, and increase the pH to 7.4. To the resulting solution containing 1 mg/mL polymer, Hb (2 mg/mL) was added and the reaction continued for 6 h at 4 °C. After the reaction, the solution was purified using a centrifugal filtering device with cut-off size of 100 kDa to remove un-conjugated Hb.
CSLM study of model particles
CLSM images were collected with an Olympus FV 500 microscope with filters optimized for fluorescein dye in the RBCMs. Images were taken using a 60× oil objective lens. Confocal sections were collected in the image scan x-y-z mode. A single particle that was vertically standing on the slide was chosen. By focusing both the bottom and top of that particle, the starting and ending focus positions were selected with an increment of 0.414 μm. The scanning of the sections generated a series of images, which were reconstructed into a 3D view using the software MetaMorph®.
Reduction of metHb and Hb binding to carbon monoxide (CO) and oxygen
To Hb-particle suspension in PBS, the particles were spun down and resuspended in deoxygenated PBS (deoxy-PBS: PBS purged with Argon for 30 min). Sodium dithionite (10 equivalent molar ratio to Hb) dissolved in deoxy-PBS was added to the particle suspension, and the reduction continued at RT for 5 min. Excess dithionite was removed by spinning down particles and washing with deoxy-PBS 3 times, followed by addition of ascorbic acid (10 mM). CO was purged to reduced Hb-particle suspension to convert deoxyHb to CO-Hb with the suspension in a tube covered by aluminum foil. When CO-Hb-particle suspension was purged with air for 20 min under light, oxygen could replace CO to bind Hb.
UV-vis spectroscopy of Hb and Hb-particles
The UV-vis spectra were measured on a Cary-50 UV-vis spectrometer in the wavelength range of 200 nm to 800 nm. The scan rate was 300 nm/min with 0.5 nm intervals. PBS solution was used as the background and subtracted. For the determination of total Hb concentration in solution, a standard curve of cyanmethemoglobin was obtained by measuring the absorbance of the cyanmetHb solution at 540 nm with concentrations of 0.05, 0.1, 0.2, 0.4 and 0.8 mg/mL. The metHb level was measured by adding 15 μL KCN (10 wt% solution) to the Hb containing solutions/suspensions (1 mL) and the difference in the absorbance at 540 nm before and after addition of KCN was used to calculate the metHb concentration15. To test the metHb formation over time, the reduced Hb-polymer solution was dispensed as 1 mL aliquots into multiple Falcon tubes (50 mL) with the top of solution filled with air in the tubes. The concentration of the particles used for the UV-vis spectroscopy was only 0.05 mg/mL, with Hb concentration of 0.14 mg/mL to ensure absorbance lower than 1. With the low concentration used, light scattering became minimal.
Circular Dichroism (CD) spectroscopy studies
The CD spectra of unmodified Hb, Hb physically mixed with RBCM particles and Hb-RBCM particles were recorded using a Chirascan Plus CD spectrometer (Applied Photophysics, Inc.) at 23 °C. Each sample was diluted in 10 mM K2HPO4 buffer (pH=7.2; K2HPO4 buffer was used to avoid the absorbance below 200 nm associated with the chloride in PBS), and the buffer spectrum was subtracted. The step resolution was kept at 0.5 nm/data point, and the bandwidth and sensitivity were 1 nm and 20 milli-degrees respectively. Particles lightly loaded with Hb (R=0.4) were used for the CD study because higher Hb loading resulted in increased light scattering that interfered with the measurement31. For the determination of secondary structure change, the samples were diluted to contain 0.16 mg/mL Hb, with particle concentration maintained at 0.4 mg/mL where applicable. The samples were scanned from 190 to 260 nm, with the scan speed maintained at 50 nm/min. To record the Soret CD bands, each sample contained 1mg/mL Hb and was scanned from 350 to 450 nm with a path length of 1 mm, and eight accumulations. The higher concentration of Hb (1 mg/mL) was used for the Soret CD spectra because the absorbance of Hb in this wavelength range is much weaker than that in far UV.
Microfluidics
Microfluidic devices were fabricated from silicone (Sylgard 184, Dow Corning) sealed to glass after treatment with oxygen plasma, with flow driven by a syringe pump (Harvard) at a fixed rate (0.06 mL/min). Dilute solutions of Hb-particles (1–5 μg/mL in PBS with 0.1% PVOH) were pumped through the channel and observed with a fluorescence microscope (Olympus IX81). Videos were taken with a CCD camera (Hamamatsu). Particle stretching was analyzed with ImageJ (NIH) software.
Rheological measurement
A rotational rheometer (ARES-G2, TA instrument) was used for the measurement of viscosity at different shear rates. To obtain fluid packed with more particles, the particle suspension was spun down and decanted to adjust the volume fraction of the pellet to the overall fluid volume. Briefly, for a 10 mL suspension containing 10 mg of particles (only considering the weight of the polymer), the volume of the pellet after centrifugation at 8,000 g for 8 min was around 100 μL. The volume of PBS buffer on top of the pellet could be decanted to be 150 μL, resulting in a packed particle volume fraction of 40%. The final hemoglobin concentration
Two hundred microliters of blood or particle suspension ([Hb]=5.2 g/dL; R=1.3) were loaded onto the rheometer stage. The stainless steel plate had a diameter of 40 mm with a cone angle of 0.0399 rad. The samples were sheared from 0.1 to 1,000 1/s within 3 min while the temperature was maintained at 25 °C. The mouse blood samples were collected from Balb/c mice into heparinized eppendorf tubes kept at 4 °C and tested within 24 h.
Cytotoxicity study
Human umbilical vein endothelial cell (HUVEC) or HeLa cells were seeded in 200 μL of media (HuMEC containing HuMEC supplement and bovine pituitary extract or MEM containing Earle’s salts and both supplemented with 10% fetal bovine serum) at a density of 5,000 cells per cm2 into a 96-well microtiter plate. Cells were allowed to adhere for 24 h and subsequently incubated with RBCM particles at concentrations ranging from 200 μg/mL to 1.56 μg/mL for 72 h at 37 °C in a humidified 5% CO2 atmosphere. After the incubation period, all medium/particles were aspirated off cells. The ATP-luciferase assay requires 100 μL fresh medium, which was added back to cells, followed by the addition of 100 μL CellTiter-Glo® Luminescent Cell Viability Assay reagent (Promega). Plates were placed on a microplate shaker for 2 min, then incubated at room temperature for 10 min to stabilize luminescent signal. The luminescent signal was recorded on a SpectraMax M5 plate reader (Molecular Dynamics). The MTS [(3-(4,5-dimethylthiazol-2-yl)-5-(3-carboxy-methoxyphenyl)-2-(4-sulfophenyl)-2H-tetrazolium)] viability assay utilizes 20 μL of CellTiter 96® AQueous One Solution Reagent (Promega) into each well of the 96-well assay plate containing the samples in 100 μL of culture medium. Plates were incubated at 37 °C for 1–4 h in a humidified, 5% CO2 atmosphere. The absorbance at 490 nm was recorded using a SpectraMax M5 plate reader (Molecular Dynamics). The viability of the cells exposed to the RBCM particles was expressed as a percentage of the viability of cells grown in the absence of particles.
Results and Discussion
Fabrication and characterization of RBCM particles
Unlike all the other Hb carriers reported previously like liposomes, which were fabricated from ‘bottom-up’ self-assembly processes, our RBCM particles were fabricated using a ‘top-down’ method called PRINT®. The Particle Replication In Non-wetting Templates (PRINT) technique developed in our laboratory allows for fabrication of nonspherical, shape-specific particles with exactly defined size through use of elastomeric fluoropolymer molds32. Photopolymerizable liquid monomers filled into wells in the molds can be UV-cured to form particles, which can be transferred out by adhesion to a dissolvable sacrificial film (scheme in Figure 1A). When hydrophilic monomers are used with PRINT, the resultant particles swell to larger diameters with hydration while maintaining the same aspect ratio of the original mold. By varying the amount of crosslinker, the swelling and deformability of the hydrogel particles can be easily tailored. Meanwhile, different molds with cavities of varying sizes could be used, allowing us to make populations of particles of defined size, shape with controlled elasticities. RBCM particles discussed herein were composed primarily of triethylene glycol acrylate (TEGA), a non-volatile hydrophilic monomer suitable for the PRINT process which was synthesized in our laboratory (see Supporting Information). By copolymerizing 10 wt% 2-carboxylethyl acrylate (CEA) with TEGA initiated by HCPK under UV irradiation, the particles were charged with reactive carboxylic acids for the conjugation with primary amines on Hb. The size and shape of the particles were controlled by the dimensions of the cavities in the mold.
Figure 1.

RBCM particles. (A) Cartoon scheme showing the process of PRINT used to fabricate RBCM microgels. Briefly (Top to bottom), an elastomeric fluoropolymer mold (green) with disc-shaped wells was covered by an aliquot of the pre-polymer liquid (red). The mold was passed through a pressured nip (black) covered by a high-surface-energy sheet (gray), wicking away excess liquid from the mold surface while filling the wells. The filled mold was cured photochemically, yielding crosslinked particles, which were harvested from the mold by laminating a poly(vinyl alcohol) film (blue) on top of the mold through a pressured nip and peeling way the mold. Dissolving the poly(vinyl alcohol) film resulted in a suspension of hydrogel particles. (B) Fluorescent micrograph of polymerized particles (fabricated from 88.85 wt% TEGA, 10 wt% CEA, 0.05 wt% PEG4kDA, 1 wt% HCPK, 0.1 wt% PolyFluor 570) in the mold; and (C) fully hydrated particles free of the mold, suspended in PBS. Scale bars=20 μm.
Macroscopic coupons polymerized from TEGA and 10 wt% CEA with varying percentage of PEG4kDA crosslinker were made to estimate both the swelling characteristics and deformability of the microparticles by correlation to the bulk properties. Using 1 wt% or less of the PEG4kDA crosslinker resulted in a bulk modulus below 20 kPa for the hydrated gels; lower than the reported modulus for RBCs (26±7 kPa)27. Modulus plays an important role in governing the in vivo circulation times and biodistribution of microparticles27. Long circulating RBCM particles require sufficient deformability to traverse in vivo restrictions, with lower modulus particles more readily able to deform to this end. To maximize the potential of these particles for long circulation times, we lowered the amount of PEG4kDA to only 0.05 wt%, resulting in hydrogels with a modulus of 6.5 kPa. The bulk sample swelled to roughly 3 times the original diameter with equilibrium hydration, with water content increasing to 96.7 wt%.
Based on the swelling observed in the bulk hydogels, elastomeric fluoropolymer molds with patterned wells of 2 μm in diameter, 0.6 μm in height, were used to fabricate particles crosslinked with 0.05 wt% PEG4kDA. Figure 1B shows particles with polymerized Rhodamine dye confined in the mold. Once transferred out of the mold and suspended in PBS, the particles hydrated and swelled to 6.3 μm in diameter and 1.8 μm in height (Figure 1C).
The ζ-potential of the particles was -23 mV in 0.1X PBS. The negative charge was due to the presence of CEA in the particles. These RBCM particles were very stable in PBS; there was no obvious sedimentation observed after 1 week without agitation. This is expected because of the very high water content in the particles. The integrity of the particle network was stable for over six months, with no signs of degradation seen via microscopic examination. In addition, following centrifugation at 10,000 g for 6 min to pellet the particles, the supernatant remained colorless, indicating no release of the Rhodamine dye due to particle degradation. The chemical and colloidal stability suggest that these particles are amenable to use as RBC mimics.
Conjugation of Hb into the RBCM particles
To avoid the complications of allosteric effectors such as 2,3-diphosphoglycerate, which are required for the native operation of human Hb33, we used bovine Hb. Bovine Hb only requires chloride ion for native operation34, which can be provided by buffers like PBS and is present in the blood. The conjugation of bovine Hb to the particles was carried out using EDC/sulfo-NHS chemistry to couple carboxylic acids in the particles to amines of the lysines of Hb35 (Figure 2A). In the first step, carboxyl groups in the particles were activated by EDC/sulfo-NHS in 0.1 M MES buffer with pH=4.5. Then the activated particles were transferred to PBS (pH=7.4) after removing excess EDC and sulfo-NHS. Bovine Hb was added to react with the amine-reactive NHS esters in the particles. A low concentration of particles (1 mg/mL) was employed during reaction to avoid inter-particle crosslinking by Hb to form larger aggregates. Sulfo-NHS was also used to maintain the negative charge of the particles, helping to avoid aggregation.
Figure 2.

Conjugation of Hb to RBCM particles. (A) Scheme for the conjugation chemistry. (B) Fluorescent image of particles conjugated with Fluorescein-tagged Hb. Fluorescein-labeled RBCM particles reacted with Rhodamine-tagged Hb were observed in the (C) Fluorescein, (D) Rhodamine channels of fluorescence; (E) overlay of C and D. Scale bars=20 μm. (F) FTIR spectra of blank particles, Hb, and Hb-RBCM conjugate. The arrow pointing to 1579 cm−1 denotes the peak of carboxylate in the particles; the two arrows pointing to 1550 and 1660 cm−1 denote the amide groups in Hb.
We confirmed that Hb had indeed reacted with the particles by directly observing the particles conjugated with dye-labeled Hb under a fluorescent microscope. Both Fluorescein and Rhodamine labeled bovine Hb were synthesized using the corresponding dye-NHS to react with Hb at a molar ratio of 15:1. Excess dye-NHS was used to ensure Hb molecules were labeled with several dye molecules per protein. There are 42 lysine amino groups on the surface of a single Hb molecule36; therefore, the dye-labeled Hb possessed multiple unfunctionalized amine groups for use in coupling to the particles. After reacting with dye-free particles through the EDC/sulfo-NHS coupling method, the resulting particles obtained fluorescence arising from the dye-labeled Hb (Figure 2B and Figure S1 in Supporting Information).
To determine whether the dye-Hb was covalently conjugated to the RBCMs or more loosely associated via non-covalent interactions, we fabricated Fluorescein-labeled particles by copolymerizing Fluorescein-o-acrylate into the polymer network. We incubated the particles with Rhodamine-tagged Hb (Rh-Hb) in PBS overnight, then pelleted and washed them 3 times to remove unassociated protein. The washed particles had no fluorescence in the Rhodamine channel under a fluorescent microscope, indicating a lack of non-specific binding of Hb to the RBCMs. Considering that Hb acquires slightly negative charge at pH=7.4 (pI=6.8)37, a lack of electrostatically driven association with negatively charged particles is reasonable. In contrast, when the particles were first activated by EDC/sulfo-NHS and then incubated with Rh-Hb followed by washing, they displayed red fluorescence from the covalently conjugated Rh-Hb (Figure 2D). The red fluorescence from Rhodamine overlapped perfectly with the green fluorescence from Fluorescein (Figure 2E). The covalent conjugation of Hb into the RBCM particles was also confirmed by FTIR spectroscopy (Figure 2F). The peaks at 1650 and 1550 cm−1 corresponding to the amide I and amide II region of hemoglobin38 were also present in the spectrum of the Hb-RBCM particles, which were thoroughly washed to remove unassociated Hb. The peak at 1579 cm−1, characteristic of the carboxylate moiety that was consumed by the conjugation chemistry39, was attenuated in the Hb-RBCM particle sample, indicating a decrease in the prevalence of this functionality as a result of conjugation to Hb. Combining the spectroscopic result from FTIR and the microscopic observations, we concluded that Hb was covalently conjugated to the hydrogel matrix of RBCM particles.
Besides Hb, other proteins bearing lysine groups on the surface could possibly also be conjugated into the particles. We used Alexa Fluor® 488 (AF488) labeled bovine serum albumin (BSA) as a representative protein to demonstrate this. By incubating AF488-BSA with activated dyeless particles, the resulting particles gained fluorescence from AF488 (Figure S2), indicating covalent conjugation of BSA to the particles.
Confocal studies of the Hb-RBCM particles
While the free volume fraction was very high in the particles due to the low mesh density and high water content, we wanted to determine if the protein was distributed throughout the bulk of the particles or limited to the surface. For these experiments, we made larger (18 μm tall, 18 μm diameter cylinders) hydrogel particles with identical composition to facilitate confocal imaging analysis. These large model particles, which were fabricated without the inclusion of a fluorescent dye, were allowed to react with Fluorescein-Hb under the same conditions as discussed above. Confocal laser scanning microscopy (CLSM) was used to scan the particles at various cross sections due to the narrow depth of focus of this technique. We randomly selected a representative particle and collected a stack of scans in the xy plane while varying the focal depth in the z direction to cover the entire particle. All of the xy scans obtained showed fluorescence associated with the covalent attachment of fluorescein-Hb to the particle matrix (Video 1 in SI), indicating that Hb had been distributed throughout the particle interior. A reconstructed 3D view of the model particles is shown in Figure 3, with orthogonal cross-section views of the representative particle. Although the particles used for the confocal experiments were larger than the ~6 μm RBCMs, they were polymerized under the same condition with identical compositions and it is reasonable assumption that the mesh size, which depends on crosslinker density, in both sets of particles were similar.
Figure 3.
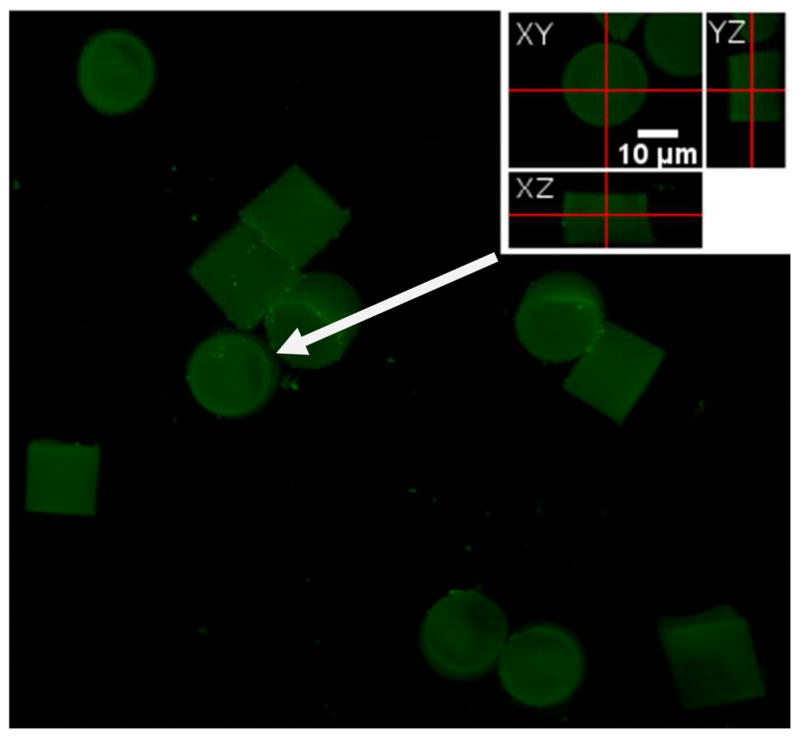
A 3D reconstruction view of fluorescein-Hb-conjugated particles observed using xyz scan mode of the confocal laser scanning microscope, with the inset showing orthogonal cross-section views of a representative particle (indicated by the white arrow). The fluorescent protein seems to be homogenously distributed throughout the hydrogel particle.
Hb loading efficiency of RBCM particles
By varying the initial Hb concentration for the conjugation, the loading ratio of Hb into the RBCM particles could be adjusted. We define the weight ratio of conjugated Hb to the polymer network of particle as the loading ratio, R. The maximum theoretical value of R would be greater than 60 for the case of every carboxyl group in the particles being conjugated to one Hb molecule. While steric effects make saturation unlikely, we observed that very high loading resulted in the undesirable effects of particle aggregation and sedimentation. Loading ratios as high as 5.1 were obtained without any observable aggregation or sedimentation effects. The loading ratio was changed by varying the amount of Hb added to a fixed amount of carboxyl-activated particles (1mg/ml; Figure 4A). The amount of Hb loaded into the particles was determined by measuring depletion of free protein in the supernatant solution by UV-vis spectroscopy through adaption of the standard cyanometHb method15. Briefly, K3Fe(CN)6 was added to the Hb solution (containing oxyHb, deoxyHb and metHb) to convert all the Hb into metHb, followed by addition of KCN to convert metHb into cyanmetHb, the concentration of which was readily quantified via UV-vis spectroscopy. The encapsulation efficiency for these particles was defined as the amount of the Hb loaded into particles divided by the overall starting amount of Hb. Generally, incubation of particles with higher concentrations of Hb led to increased R and decreased encapsulation efficiency (Figure 4A). The highest stable loading achieved, with R=5.1, resulted in an encapsulation efficiency reduced to 50%. Although the encapsulation efficiency was not very high for higher Hb loadings, unbound Hb could be collected from the particles and reused for conjugation. The size of the particles decreased slightly with increased Hb loading (Figure 4B).
Figure 4.

(A) Loading ratio R and the encapsulation efficiency of Hb into the RBCM particles with respect to different starting concentration of Hb for the conjugation while the particle concentration was maintained at 1mg/mL (n=3). (B) RBCM particle size with respect to different loadings of Hb; the size of the particles were measured by analyzing fluorescent micrographs of the particles (n=50) which had polymerized Rhodamine dye inside.
High loading of Hb into oxygen carriers is desirable for blood substitutes, which would require large doses administered with high concentration of Hb to have oxygen carrying capacity similar to that of blood. The high Hb concentration in normal blood (14 g/dL) has been approached by some HOBCs (5~10 g/dL6). The weight ratio of Hb to the lipids (as in liposomes) or polymers (in polymersomes) used to constitute those carriers, similar to R defined above, has varied widely in different cases, from 0.3 to 9.36 40. The values of R here arose from RBCM particles that were composed of only 10% of a monomer capable of conjugation to Hb (CEA). It is possible that even higher loading ratios could be obtained when the amount of CEA in the particles is increased.
CD and UV-vis spectroscopic study of Hb loaded into the RBCM particles
Retention of the structure and activity of the encapsulated Hb is a crucial consideration for the application of this protein towards carrying oxygen. The secondary structure of proteins is essential to their function; retention of this structure can be used to infer protein activity41. Protein secondary structure can be monitored by far UV-CD spectroscopy42. We measured the UV-CD spectra, in the range of 185 to 260 nm, for Hb conjugated to RBCM particles, a mixture of particles and free Hb, and unmodified free Hb in identical buffer conditions to look for structural changes in the protein (Figure 5A).
Figure 5.

(A) Far-UV circular dichroism spectra of pure Hb, Hb physically mixed with particles (Hb+particles), and Hb conjugated to particles (Hb-c-particles). For Hb-c-particles, the sample was half diluted as Hb-c-particles Diluted to confirm the isodichroic point as denoted by the arrow. The spectra were all measured in 10 mM K2HPO4 buffer with a path length of 1 mm. (B) Soret CD of the first three samples with Hb concentration of 1 mg/mL in 10 mM K2HPO4 buffer. (C) UV-vis spectra of Hb-particles with the hemes of Hb at different binding states. Particle concentration in the sample was 0.05 mg/mL with Hb concentration of 0.14 mg/mL. The as prepared Hb-particles showed a Soret peak at 405 nm, indicating mostly metHb in the particles. When sodium dithionite was added to the particle suspension, metHb was reduced back to deoxyHb, characterized by the Soret peak at 430 nm. Carbon monoxide purged into the suspension converted deoxyHb into CO-Hb as the Soret peak moved to 419 nm. When exposed to light and air, the Soret peak of the suspension moved to 412 nm, indicating formation of oxyHb. (D) MetHb level in polymer-Hb conjugate over time. The polymer was based on a similar formulation as for the particles but without crosslinker. Overall Hb concentration in the conjugate solution was 5 mg/mL.
The strong maximum at 194 nm and double minima at 208 and 222 nm in the CD spectrum of free Hb (Figure 5A), are characteristics of α–helix43. The CD spectrum of the suspension of particles mixed with free Hb (Hb+particles) was very similar to the spectrum of free Hb, with the peak at 194 nm slightly decreased in intensity. A suspension of particles in the absence of Hb had more absorbance around 200 nm than at higher wavelength (Figure S3); the decreased intensity might be attributed to the absorbance of particles in this wavelength range. For Hb conjugated to the particles (Hb-c-particles), the peak positions were the same, with slightly decreased intensity at 208 nm, and dropped larger dip in intensity at 194 nm. The isodichroic point, where the molar absorptivity is the same for protein at different concentrations44, was determined to occur at 203 nm by measuring CD spectra of Hb solutions at different concentrations and finding the point of convergence (Figure S4). When the sample of Hb-c-particles was half diluted and subjected to CD study, the obtained spectrum also crossed over the same point (Figure 5A). So the percentage helicity of Hb in the particles could be assessed by comparing the ellipticity at 222 nm45. As the minimum at 222 nm for Hb-c-particles only shows minor different from that of free Hb, we can conclude that the percentage helicity of Hb conjugated to particles was close to native Hb, indicating negligible change in the secondary structure of Hb-c-particles.
Although it has been reported that secondary structure of Hb could be changed when interacting with nanoparticles due to hydrophobic interactions or changes in ionic strength near the particles38,46, we do not anticipate this effect in our case as the microgels are very soft and hydrophilic, and the large pores in the particles allowed the ions of PBS to diffuse into the interiors fairly easily to maintain uniform ionic strength. In a recent study where bovine Hb was conjugated to high molecular weight poly(acrylic acid) using similar coupling chemistry, the authors observed the secondary structure of Hb to be unchanged43.
The Soret CD of Hb, arising from the interaction between π-π* transition of the heme groups and the surrounding aromatic amino acids, is greatly influenced by the orientation and position of the aromatic amino acid residues47,48. Changes in the Soret CD of Hb can be an indication of differences in the heme environment as well as the electronic state of the heme. The Soret CD of Hb, Hb+particles, and Hb-c-particles were recorded in the wavelength range of 350 to 450 nm in Figure 5B. Comparing the three spectra in Fig. 5B, the peak positions at 416 nm remained unchanged, implying that the heme environment was well preserved in the conjugated Hb compared to the starting Hb. The reduction in the peak intensity was most likely caused by light scattering49. The electronic state of heme was in the oxidized form for all three samples as the starting Hb had mostly been automatically oxidized into metHb, which is unable to bind oxygen.
To obtain Hb-RBCM particles capable of binding oxygen with low metHb, the suspension of Hb-RBCM particles was added with reducing agents. Sodium dithionite (10 molar equivalents to total Hb concentration) was first added to reduce metHb back to deoxyHb, and excess dithionite was removed by spinning down the particles and decanting for 3 times. Then ascorbic acid (10 mM) was added to the suspension for long term reduction. Sodium dithionite is very efficient in reducing metHb back to deoxyHb; however, excess dithionite may be oxidized by residual oxygen in solution to generate reactive oxygen species (ROS) that in return would accelerate the oxidation of Hb17. Figure 5C shows the UV-vis spectra of Hb-particle (R=2.8) suspension. The as prepared particle suspension showed a Soret peak at 405 nm, characteristic of metHb. After reducing iron(III) back to iron(II) by dithionite, the Soret peak moved to 430 nm, characteristic of deoxyHb50. Carbon monoxide could bind to deoxyHb in the particles to shift the Soret peak to 419 nm13. To the carbonized Hb-particle suspension, air was bubbled for 20 min under light and the spectrum of the resulting suspension showed a Soret peak at 412 nm, characteristic of oxyhemoglobin, along with two feature peaks at 542, 576 nm51.
An indirect method was used to estimate the metHb level in the particles. Generally, the difference in absorbance at 540 nm of a hemoglobin-containing solution before and after addition of KCN can be used to calculate the metHb concentration using UV-vis spectroscopy15. Since the absorbance at 540 nm is much lower than that at the Soret peak, accurate measurement would require higher concentration of Hb (therefore higher particle concentration) than that used for the UV-vis spectra in Figure 5C. However, higher concentration of particles would cause more light scattering that interfered with the absorbance measurement. To circumvent this problem, we polymerized TEGA with 10 wt% CEA and 1 wt% initiator, but without crosslinker to make un-crosslinked polymer that could represent the formulation of the particles. The resulting polymer (Mn=41 kDa, Mw=233 kDa) was conjugated with Hb (see SI) to generate poly(TEGA-co-CEA)-Hb conjugate, in which the loading ratio was 0.8 (high loading ratio would result in polymer precipitation). The poly(TEGA-co-CEA)-Hb conjugate was reduced by sodium dithionite, and excess dithionite was removed. Ascorbic acid (10 mM) was added to the resulting solution with [Hb]=5 mg/mL. For as prepared, un-reduced Hb-polymer solution, the metHb level is 75 %, similar to the metHb level (69 %) in the stock solution of Hb. The metHb level immediately after the reduction dropped to 1.4 %. The solution was kept under aerobic condition, and the metHb formation over time was measured over 1 month as summarized in Figure 5D. After 1 month, the metHb level rose to 25 %, and within 10 days the metHb did not exceed 10 %.
Mechanical and fluidic properties of Hb-RBCM particles
The RBCM particles were fabricated from a low modulus material to take advantage of the increased circulation times seen with such highly deformable RBC-like microgels27. However, it stands to reason that the cargo loaded into these gels (Hb) could increase the modulus of the resultant gels. To test the effect of loading these gels with Hb on the elastic modulus, we incubated bulk polymer samples with Hb and carried out the conjugation under identical conditions used for Hb conjugation to particles. At low loading of Hb, this strategy seemed to be effective; the modulus of bulk samples with loading ratio of 0.38 increased somewhat compared to Hb-free polymer gel, with E= 9.1 kPa and 6.5 kPa, respectively. However, higher loadings of Hb could not be obtained, likely as a result of the vastly reduced surface area to volume ratio in the bulk samples compared to the microparticles. The diffusion-limited conjugation reaction was likely much slower in the bulk samples, leading to hydrolysis of the reactive NHS ester before reaction could proceed fully.
To directly evaluate the deformability of the Hb loaded particles, microfluidic devices packed with constricted pores were used (Figure 6A). Microfluidic devices modeling the vascular constrictions have been explored to evaluate the behavior of cells52, including natural and diseased RBCs53, and synthetic RBC mimics54. In our previous study27, we found that more flexible particles that could pass through the constricted pores of these devices circulated for longer times in vivo. Since the size of the Hb-RBCM particles with different R values were all close to that of blank particles, we reasoned that these devices would provide a qualitative measure of particle deformability as Hb content was increased. We designed a 3-μm tall channel with pores that were 3 μm wide and 50 μm long and repeated many times over the length of the device. The device design (Fig. 6A) included over 100 repetitions of the 3-μm restricted pores over the length of the channel, as well as an unrestricted 15-μm path on each side of the restrictions, running the length of the channel. Dilute suspensions of particles were flowed through the devices via a syringe pump at a constant rate of 60 RL/min. The Rhodamine dye labeled particles could be tracked as they traveled through the channel of the microfluidic device using an inverted fluorescent microscope focused on restrictions close to the outlet of the channel. We found that moderate (R ≤ 2.8) loading of Hb had no noticeable effect on the ability of the particles to deform to elongated shape and navigate the pores (see image sequence in Figure 6B). The shape change of the particles was reversible as after coming out of the pores they could return to the original disc shape. (Video 2 in SI). However, when the R increased to 5.1, the majority of the stiffer particles became lodged in the entrances to the pores (Figure 6C), although a minor fraction of the particles could still pass through (Video 3 in SI). Therefore, with a loading ratio of Hb as high as 2.8, the RBCM particles were still very deformable.
Figure 6.

(A) Illustration of the microfluidic device. (B) Image sequence (top to bottom) showing how a single particle (R=2.8) passed through a constricted pore (from left to right). The time lapse between the frames was 31 ms. (C) Clogged pore entrance by Hb-RBCM particles with R=5.1. (D) Rheological results showing viscosity and shear stress versus shear rate for mouse blood and Hb-RBCM suspension ([Hb]= 5.2 g/dL) that had been subjected to a rheometer. The shear rate ranged from 0.1 to 1,000 1/s, covering the possible shear rates in blood flow. (E) Microscopic image showing intact Hb-RBCM particles after being sheared at a constant rate of 1,000 1/s for 10 min. Scale bars = 20 μm.
A high concentration of Hb in a HBOC fluid is necessary to fulfill oxygen transport targets. We could concentrate the Hb-RBCM particles by centrifugation in order to increase the overall Hb concentration. However, a fluid packed with very high density of Hb-RBCM particles may become very viscous, and hence is inappropriate for transfusion. To mimic the hematocrit (i.e., packed cell volume fraction) of blood (40–45%), we spun down particles and decanted to obtain a pellet with a volume fraction around 40%. While the fluid with particles whose R=2.8 became quite viscous at this packed particle volume fraction (PPVF), particles with R=1.3 could flow easily at the same PPVF with the overall Hb concentration in the suspension to be 5.2 g/dL. The viscosity of this fluid was evaluated using a rheometer that could control the shear rate and measure the corresponding shear stress and viscosity. As a control, collected mouse blood (in heparinized tube to avoid clotting) was also subjected to the rheometer. By ramping the shear rate from 0.1 to 1,000 1/s, covering the shear rates found in blood flow55, the rheological properties of the Hb-particle suspension and mouse blood were compared as in Figure 6D. As can be seen, over different shear rate ranges, the shear stress and viscosity of the Hb-RBCM fluid was always lower than those of the mouse blood. When we compared the same Hb-RBCM fluid to blood from a second mouse, the viscosity was only slightly higher than that of the mouse blood at the low shear rate range (< 10 1/s), while at higher shear rate the Hb-RBCM fluid was thinner than the mouse blood (see Figure S5). The Hb-RBCM fluid displayed rapid decrease in viscosity leading to a local maximum in the stress (Figure 6D), which may indicate phase separation and formation of shear band56,57. This behavior will be investigated in future work.
To test if the particles can survive at high shear rate, the same suspension (R=1.3, [Hb]=5.2 g/dL) was sheared on the rheometer at a constant rate of 1,000 1/s for 10 min, and the resulting suspension was observed under optical microscopy to check the integrity of the particles. The particles were indeed intact after shear as shown in Figure 6E. When the suspension was spun down, the supernatant was completely colorless, indicating no release of dye or Hb because of particle breakdown.
Cytotoxicity of the RBCM particles
Human vascular endothelial cells (HUVEC) and HeLa cells were chosen as in vitro models to assess the cytotoxicity of the RBCM particles. To investigate the possible effect of CEA on cytotoxicity, RBCM particles with even higher content of CEA (20 and 50 wt%; Figure S6) were also fabricated following similar procedure for the 10 wt% CEA particles, and were dosed to the cells. Hb-RBCM particles (R=2.8) with and without reduction of metHb were also dosed to both cell lines. To ensure similar numbers of Hb-particles dosed to the cells, the concentration of the Hb-particle suspensions were calculated based on the weight of polymers only, excluding Hb. After incubation the cells with different particles for 72 h, the cell viability was quantified by MTS assay. The results in Figure 7 show that, for both cell lines, unloaded particles had minimal cytotoxicity, although with more CEA the cell viability was slightly lower. Unreduced Hb-RBCM particles showed cytotoxicity to both cell lines, probably because of the oxidative stress from metHb in the particles58. For reduced Hb-RBCM particles, in the lower dose range, there is little cytotoxicity, while at higher dose, the viability of the cells decreased with increasing particle concentration, possibly due to higher metHb formed in the cell culture. Therefore, for our goal to increase the loading of Hb into RBCM particles by charging particles with more CEA, the biocompatibility issue of the resulting particles would rely less on CEA, but more on the metHb level in the particles. We already started to investigate incorporating ROS scavenging enzymes to solve this issue for future application.
Figure 7.

Cytotoxicity of the RBCM particles tested on (A) HUVEC and (B) HeLa cells after 72 h. RBCM particles with 10, 20, and 50 wt% CEA, but unloaded with Hb were studied to assess the biocompatibility of CEA. Hb conjugated particles (10 wt% CEA; R=2.8) with metHb reduced were tested with their un-reduced counterparts. All the particles studied were prepared into 1 mg/mL PBS suspension with regard to the weight of polymers in the particles; therefore, for Hb conjugated particles, at every dose regarding particle concentration, the numbers of particles dosed should be similar to that of unloaded 10 wt% CEA particles.
Conclusions
Here we have demonstrated the synthesis of RBC-like hydrogel microparticles that retain their deformability with covalently bound bovine Hb, which retained native secondary structure, homogeneously distributed throughout the particle matrix. The particles could be loaded with over 70 wt% Hb (loading ratio R=2.8) and the metHb level under aerobic condition could be controlled to be less than 10 % within 10 days. We demonstrated that Hb in the particles could bind oxygen when carbonized Hb in the particles was purged with air. For the in vivo application of HBOCs, the P50 value and Hills coefficient of hemoglobin are important and we plan to study the Hb-particles regarding oxygen binding under different partial pressures of oxygen soon.
The method of protein loading reported here should be general with respect to other proteins of similar or smaller size to Hb due to the ubiquitous presence of the lysine residues essential to the conjugation reaction, as BSA was also successfully loaded into the particles. For protein-based therapeutic delivery, it is often necessary to deliver the protein into specific cells; our strategy reported here may not be suitable for such purposes because the protein is covalently conjugated. However, we can use cleavable bond to conjugate proteins of interest into the RBCM particles to enable the slow release of active proteins, such as insulin, anti-TNF antibodies. Advantageously, the loading of proteins to the RBCM particle matrix are carried out in aqueous conditions, avoiding potential solvent based denaturation of protein59.
Given that hemoglobin, a 64 kDa protein (~8 nm in hydrodynamic diameter), uniformly distributes throughout the lightly crosslinked RBCM particles, we can infer a large pore size for these particles. Therefore, reducing agents like ascorbic acid may only work when the particle fluid is stored, while not work effectively after injection of the fluid. We are now investigating another strategy for maintaining low metHb level over time: larger enzymes which act on Hb found in RBCs to regulate metHb level, such as superoxide dismutase (SOD) and catalase (CAT) could be conjugated to the particles through the same conjugation chemistry, but at much lower concentration (still effective, but help control the cost). Chang, et al. polymerized SOD, CAT with Hb to obtain polyHb-SOD-CAT using glutaraldehyde, which prevented problems related to oxidation of Hb60. Inclusion of low amount of these enzymes into the particles may be efficacious in scavenging ROS, resulting in low level of metHb over a long time even under aerobic conditions.
Another virtue of the current method is that the modulus of the particles is not overly compromised with a moderate extent of conjugation (R=2.8) as studied by microfluidic devices. While added Hb could act as crosslinker to shrink the particles and increase the modulus, this effect was not observed to be dramatic except for cases with very high loading of Hb. This may be due to inclusion of Hb without the formation of crosslinks because of a low density of reactive sites on the RBCM particle. Hb-RBCM particles (R=1.3) could also survive high shear rate (up to 1,000 1/s) as the particle remained intact after the suspension with 5.2 g/dL Hb was sheared for 10 min.
In the conjugation study, only microgels with 10 wt% CEA were used to load Hb. We hope to further increase the loading ratio of Hb into particles with more CEA. Conjugation of Hb likely altered the surface characteristics of the particles, which could affect the fluid properties of the resulting suspension. We found that, at the same packed particle volume fraction, the fluid of particles with R=2.8 was more viscous than fluid of particles with R=1.3, which had similar viscosity to mouse blood when packed into a suspension with [Hb]=5.2 g/dL. It is interesting to see if we can increase the amount of CEA in particles to elevate the loading ratio of Hb, while still maintaining low viscosity in the final suspension with [Hb] close to 10 g/dL. The surface change of the particles may also have interesting effects on the in vivo behavior of these particles compared to the unmodified gels and we are planning to investigate this. Overall, we believe that our Hb-loaded RBCM particles provide a promising start toward the next generation of blood substitutes.
Supplementary Material
Acknowledgments
We acknowledge the National Institutes of Health (NIH, 1R21HL092814 and 1R21HL096011), Liquidia Technologies, and Chancellor’s Eminent Professorship of UNC-CH for support. Joseph M. DeSimone is a founder, member of the board of directors, and maintains a financial interest in Liquidia Technologies.
Footnotes
Supporting Information Available
Supporting information includes: details about the synthesis and characterization of TEGA; methods of investigating soluble fractions and quantifying CEA amount in particles; studies of BSA loading into particles; microscopic images showing particles with different loading and different amounts of CEA; UV-vis and CD spectroscopy of Hb and Hb-particles; rheological study of Hb-particles compared to mouse blood; microfluidic device design. This information is available free of charge via the Internet at http://pubs.acs.org/.
References
- 1.Squires JE. Science. 2002;295:1002–5. doi: 10.1126/science.1068443. [DOI] [PubMed] [Google Scholar]
- 2.Riess J. Chem Rev. 2001;101:2720–2797. doi: 10.1021/cr970143c. [DOI] [PubMed] [Google Scholar]
- 3.Winslow RM. Adv Drug Deliv Rev. 2000;40:131–142. doi: 10.1016/s0169-409x(99)00045-9. [DOI] [PubMed] [Google Scholar]
- 4.Chang TMS. Trends biotechnol. 2006;24:372–377. doi: 10.1016/j.tibtech.2006.06.005. [DOI] [PubMed] [Google Scholar]
- 5.Alayash AI. Nat Rev Drug Discov. 2004;3:152–9. doi: 10.1038/nrd1307. [DOI] [PubMed] [Google Scholar]
- 6.Tsuchida E, Sou K, Nakagawa A, Sakai H, Komatsu T, Kobayashi K. Bioconjugate Chem. 2009;20:1419–40. doi: 10.1021/bc800431d. [DOI] [PubMed] [Google Scholar]
- 7.Goodnough LT, Scott MG, Monk TG. Clin Orthop Relat Res. 1998:89–100. doi: 10.1097/00003086-199812000-00013. [DOI] [PubMed] [Google Scholar]
- 8.Chang TMS. Biotechnol Annu Rev. 1998;4:75–112. doi: 10.1016/s1387-2656(08)70068-1. [DOI] [PubMed] [Google Scholar]
- 9.Kaneda S, Ishizuka T, Goto H, Kimura T, Inaba K, Kasukawa H. Artificial organs. 2009;33:146–52. doi: 10.1111/j.1525-1594.2008.00699.x. [DOI] [PubMed] [Google Scholar]
- 10.Alayash AI. Nat Biotechnol. 1999;17:545–9. doi: 10.1038/9849. [DOI] [PubMed] [Google Scholar]
- 11.Rameez S, Alosta H, Palmer AF. Bioconjugate Chem. 2008;19:1025–32. doi: 10.1021/bc700465v. [DOI] [PubMed] [Google Scholar]
- 12.Sun J, Huang Y, Shi Q, Chen X, Jing X. Langmuir. 2009;25:13726–9. doi: 10.1021/la901194k. [DOI] [PubMed] [Google Scholar]
- 13.Shi Q, Huang Y, Chen X, Wu M, Sun J, Jing X. Biomaterials. 2009;30:5077–5085. doi: 10.1016/j.biomaterials.2009.05.082. [DOI] [PubMed] [Google Scholar]
- 14.Patton JN, Palmer AF. Biomacromolecules. 2005;6:2204–12. doi: 10.1021/bm050144b. [DOI] [PubMed] [Google Scholar]
- 15.Patton JN, Palmer AF. Biomacromolecules. 2005;6:414–24. doi: 10.1021/bm049432i. [DOI] [PubMed] [Google Scholar]
- 16.Zhao J, Liu CS, Yuan Y, Tao XY, Shan XQ, Sheng Y, Wu F. Biomaterials. 2007;28:1414–22. doi: 10.1016/j.biomaterials.2006.10.012. [DOI] [PubMed] [Google Scholar]
- 17.Takeoka S, Sakai H, Kose T, Mano Y, Seino Y, Nishide H, Tsuchida E. Bioconjugate Chem. 1997;8:539–44. doi: 10.1021/bc970091y. [DOI] [PubMed] [Google Scholar]
- 18.Sakai H, Tomiyama K-ichi, Sou K, Takeoka S, Tsuchida E. Bioconjugate Chem. 2000;11:425–432. doi: 10.1021/bc990173h. [DOI] [PubMed] [Google Scholar]
- 19.Sou K, Klipper R, Goins B, Tsuchida E, Phillips WT. J Pharm and Exp Ther. 2005;312:702–9. doi: 10.1124/jpet.104.074534. [DOI] [PubMed] [Google Scholar]
- 20.Alexis F, Pridgen E, Molnar LK, Farokhzad OC. Mol Pharmaceutics. 2008;5:505–15. doi: 10.1021/mp800051m. [DOI] [PMC free article] [PubMed] [Google Scholar]
- 21.Li SD, Huang L. Mol Pharmaceutics. 2008;5:496–504. doi: 10.1021/mp800049w. [DOI] [PubMed] [Google Scholar]
- 22.Mitragotri S, Lahann J. Nat Mater. 2009;8:15–23. doi: 10.1038/nmat2344. [DOI] [PMC free article] [PubMed] [Google Scholar]
- 23.Rameez S, Palmer AF. Langmuir. 2011;27:8829–40. doi: 10.1021/la201246m. [DOI] [PMC free article] [PubMed] [Google Scholar]
- 24.Beningo KA, Wang Y-li. J Cell Sci. 2002;115:849–56. doi: 10.1242/jcs.115.4.849. [DOI] [PubMed] [Google Scholar]
- 25.Banquy X, Suarez F, Argaw A, Rabanel JM, Grutter P, Bouchard JF, Hildgen P, Giasson S. Soft Matter. 2009;5:3984. [Google Scholar]
- 26.Juliano R. Adv Drug Deliv Rev. 1988;2:31–54. [Google Scholar]
- 27.Merkel TJ, Jones SW, Herlihy KP, Kersey FR, Shields AR, Napier M, Luft JC, Wu H, Zamboni WC, Wang AZ, Bear JE, Desimone JM. Proc Natl Acad Sci. 2011:586–591. doi: 10.1073/pnas.1010013108. [DOI] [PMC free article] [PubMed] [Google Scholar]
- 28.Dong Q, Stowell CP. Am J Clin Pathol. 2002;118(Suppl):S71–80. doi: 10.1309/6P2J-2B1K-GU0T-M5PR. [DOI] [PubMed] [Google Scholar]
- 29.Rolland JP, Maynor BW, Euliss LE, Exner AE, Denison GM, DeSimone JM. J Am Chem Soc. 2005;127:10096–100. doi: 10.1021/ja051977c. [DOI] [PubMed] [Google Scholar]
- 30.Guzmán J, Iglesias MT, Riande E. Polymer. 1997;38:5227–5232. [Google Scholar]
- 31.Bustamante C, Tinoco I, Maestre MF. Proc Natl Acad Sci. 1983;80:3568–72. doi: 10.1073/pnas.80.12.3568. [DOI] [PMC free article] [PubMed] [Google Scholar]
- 32.Merkel TJ, Herlihy KP, Nunes J, Orgel RM, Rolland JP, Desimone JM. Langmuir. 2010;26:13086–96. doi: 10.1021/la903890h. [DOI] [PMC free article] [PubMed] [Google Scholar]
- 33.Lalezari I, Lalezari P, Poyart C, Marden M, Kister J, Bohn B, Fermi G, Perutz MF. Biochemistry. 1990;29:1515–1523. doi: 10.1021/bi00458a024. [DOI] [PubMed] [Google Scholar]
- 34.Sakai H, Masada Y, Takeoka S, Tsuchida E. J Biochem. 2002;131:611–7. doi: 10.1093/oxfordjournals.jbchem.a003141. [DOI] [PubMed] [Google Scholar]
- 35.Sinz A. J Mass Spectrom. 2003;38:1225–37. doi: 10.1002/jms.559. [DOI] [PubMed] [Google Scholar]
- 36.Zhang N, Palmer AF. Biotechnol Bioeng. 2011;108:1413–20. doi: 10.1002/bit.23071. [DOI] [PubMed] [Google Scholar]
- 37.Shukla R, Balakrishnan M, Agarwal GP. Bioseparation. 2000;9:7–19. doi: 10.1023/a:1008194300403. [DOI] [PubMed] [Google Scholar]
- 38.Henzler K, Wittemann A, Breininger E, Ballauff M, Rosenfeldt S. Biomacromolecules. 2007;8:3674–81. doi: 10.1021/bm700953e. [DOI] [PubMed] [Google Scholar]
- 39.Gershevitz O, Sukenik CN. J Am Chem Soc. 2004;126:482–3. doi: 10.1021/ja037610u. [DOI] [PubMed] [Google Scholar]
- 40.Arifin DR, Palmer AF. Biomacromolecules. 2005;6:2172–81. doi: 10.1021/bm0501454. [DOI] [PubMed] [Google Scholar]
- 41.Pelton JT, McLean LR. Anal Biochem. 2000;277:167–76. doi: 10.1006/abio.1999.4320. [DOI] [PubMed] [Google Scholar]
- 42.Kelly SM, Jess TJ, Price NC. Biochimica et biophysica acta. 2005;1751:119–39. doi: 10.1016/j.bbapap.2005.06.005. [DOI] [PubMed] [Google Scholar]
- 43.Thilakarathne V, Briand VA, Zhou Y, Kasi RM, Kumar CV. Langmuir. 2011;27:7663–71. doi: 10.1021/la2015034. [DOI] [PubMed] [Google Scholar]
- 44.Holtzer ME, Holtzer A. Biopolymers. 1992;32:1675–7. doi: 10.1002/bip.360321209. [DOI] [PubMed] [Google Scholar]
- 45.Lu S, Ciardelli T, Reyes V, Humphreys R. J Biol Chem. 1991;266:10054–10057. [PubMed] [Google Scholar]
- 46.Zolghadri S, Saboury AA, Golestani A, Divsalar A, Rezaei-Zarchi S, Moosavi-Movahedi AA. J Nanoparticle Res. 2008;11:1751–1758. [Google Scholar]
- 47.Sugita Y, Nagai M, Yoneyama Y. J Biol Chem. 1971;246:383–388. [PubMed] [Google Scholar]
- 48.Liu C. Biochim Biophys Acta. 1998;1385:53–60. doi: 10.1016/s0167-4838(98)00044-2. [DOI] [PubMed] [Google Scholar]
- 49.Urabe Y, Shiomi T, Itoh T, Kawai A, Tsunoda T, Mizukami F, Sakaguchi K. Chembiochem. 2007;8:668–74. doi: 10.1002/cbic.200600486. [DOI] [PubMed] [Google Scholar]
- 50.Wallace W, Houtchens R, Maxwell J, Caughey W. J Biol Chem. 1982;257:4966–4977. [PubMed] [Google Scholar]
- 51.Zijlstra WG, Buursma A. Comp Biochem Physiol. 1997;118:743–749. [Google Scholar]
- 52.Rosenbluth MJ, Lam WA, Fletcher DA. Lab Chip. 2008;8:1062–70. doi: 10.1039/b802931h. [DOI] [PMC free article] [PubMed] [Google Scholar]
- 53.Shevkoplyas SS, Yoshida T, Gifford SC, Bitensky MW. Lab Chip. 2006;6:914–20. doi: 10.1039/b601554a. [DOI] [PubMed] [Google Scholar]
- 54.Haghgooie R, Toner M, Doyle PS. Macrom Rapid Commun. 2010;31:128–34. doi: 10.1002/marc.200900302. [DOI] [PMC free article] [PubMed] [Google Scholar]
- 55.Replogle R, Meiselman H, Mirrill E. Circulation. 1967;36:148–160. doi: 10.1161/01.cir.36.1.148. [DOI] [PubMed] [Google Scholar]
- 56.Vermant J, Solomon MJ. J Phys: Condens Matter. 2005;17:R187–R216. [Google Scholar]
- 57.Lerouge S, Decruppe J, Humbert C. Phys Rev Lett. 1998;81:5457–5460. [Google Scholar]
- 58.Meguro T, Chen B, Lancon J, Zhang JH. J Neurochem. 2001;77:1128–1135. doi: 10.1046/j.1471-4159.2001.00313.x. [DOI] [PubMed] [Google Scholar]
- 59.Rusmini F, Zhong Z, Feijen J. Biomacromolecules. 2007;8:1775–89. doi: 10.1021/bm061197b. [DOI] [PubMed] [Google Scholar]
- 60.D’Agnillo F, Chang TM. Nat Biotechnol. 1998;16:667–71. doi: 10.1038/nbt0798-667. [DOI] [PubMed] [Google Scholar]
Associated Data
This section collects any data citations, data availability statements, or supplementary materials included in this article.