

Abstract
In the present study, we investigate patterns of variation in the KIR cluster in a large and well-characterized sample of worldwide human populations in the Human Genome Diversity Project—Centre d'Etude du Polymorphisme Humain (HGDP-CEPH) panel in order to better understand the patterns of diversity in the region. Comparison of KIR data with that from other genomic regions allows control for strictly demographic factors; over 500,000 additional genomic markers have been typed in this panel by other investigators and the data made publicly available. Presence/absence frequencies and haplotypic associations for the KIR region are analyzed in the 52 populations comprising the panel and in accordance with major world regions (Africa, Middle East, Central Asia, East Asia, Europe, Americas, and Oceania). These data represent the first overview of KIR population genetics in the well-documented HGDP-CEPH panel and suggest different evolutionary histories and recent selection in the KIR gene cluster.
Electronic supplementary material
The online version of this article (doi:10.1007/s00251-012-0629-x) contains supplementary material, which is available to authorized users.
Keywords: Killer cell immunoglobulin-like receptor, KIR, HGDP-CEPH, Population, Diversity
Introduction
The killer cell immunoglobulin-like receptors (KIR) (Vilches and Parham 2002) are a family of receptors expressed on natural killer (NK) cells and a small percentage of cytotoxic T cells used to regulate cell killing and cytokine response (Biron 1997; Vales-Gomez et al. 1998; Bashirova et al. 2006; Young and Uhrberg 2002; Hsu 2004; Smyth et al. 2005). The KIR act to inhibit or activate NK cells, and while the inhibitory KIR use the human leukocyte antigen (HLA) class I molecules as their ligand, the ligands for most of the stimulatory KIR have not been identified definitively. The balance between inhibitory and activating KIR and their specific ligands results in a finely tuned innate-adaptive immune response. The inhibitory KIR, partnered with alternative NK receptor complexes (CD94:NKG2A), ensure that NK cells are tolerant of healthy autologous cells and responsive to cells with compromised HLA class I expression, as what occurs frequently in virus-infected and tumor cells. The stimulatory KIR contribute to the activation of NK cells in response to infection and malignancy. Our recent work and that of others has shown that KIR and their HLA ligands are associated in a variety of autoimmune diseases (Parham 2005; Khakoo and Carrington 2006; Williams et al. 2005; Hollenbach et al. 2009) and infectious diseases (HIV and hepatitis C; Martin et al. 2007; Li et al. 2004; Khakoo et al. 2004) as well as being important in solid organ and hematopoietic stem cell transplant (Cooley et al. 2009, 2010; Ruggeri et al. 2002; Kunert et al. 2007) and pregnancy (Moffett and Hiby 2007; Moffett-King 2002; Lanier 1999).
The KIR gene complex is located on human chromosome 19q13.4 and is both polygenic and extremely polymorphic; further variation at the functional level is derived from the variegated expression pattern of the KIR gene products on the surface of NK cells (Young and Uhrberg 2002). While extensive allelic variability has been identified, particularly in the inhibitory genes (http://www.ebi.ac.uk/cgi-bin/ipd/kir), variability in gene content haplotypes is responsible for significant diversity both within and between populations. While many KIR haplotypes have been identified in human populations, they are generally categorized into two groups, A and B (Martin et al. 2004; Parham 2005); the A haplotype is represented by a single configuration of mainly inhibitory genes, while numerous possible B haplotypes are typified by varying numbers of additional activating genes (Middleton et al. 2007b; Uhrberg et al. 2002; Hsu et al. 2002). Six gene content haplotypes (Fig. 1) that have been identified through segregation (Khakoo and Carrington 2006) and sequence analysis (Pyo et al. 2010) appear to be relatively common across several major ethnic groups, accounting for greater than 90 % of the KIR haplotypic variation observed.
Fig. 1.
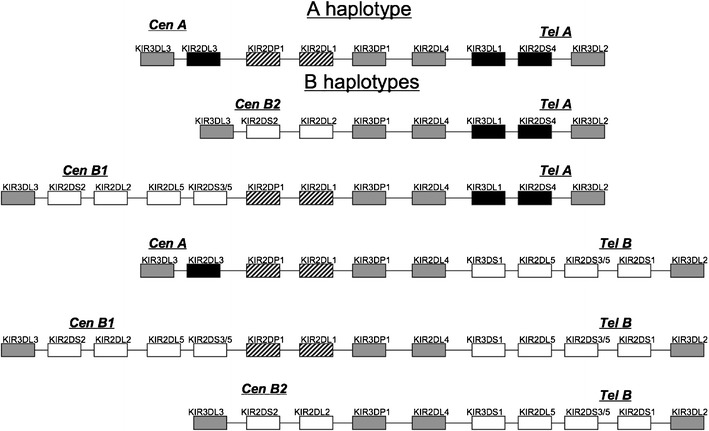
Structure of the six most common KIR gene content haplotypes in most of the world populations. The centromeric (Cen) and telomeric (Tel) motifs are labeled according to their association with the KIR A or B haplotype
Previous work has suggested that very little linkage disequilibrium (LD) exists between the centromeric and telomeric sections of the KIR cluster, while there is a strong LD within these regions (Gourraud et al. 2010). The six KIR haplotypes in Fig. 1 are all combinations of three centromeric and two telomeric basic motifs (Pyo et al. 2010). These motifs are associated (and named in accordance) either with the canonical KIR A inhibitory haplotype, or variations of the more stimulatory KIR B haplotypes. Four framework genes are found in almost all KIR haplotypes and flank the Cen and Tel motifs, including the centromerically located KIR3DL3 and KIR3DP1, and the telomerically located KIR2DL4 and KIR3DL2 loci. Centromerically, Cen-A is characterized by the presence of KIR2DL3, KIR2DP1, and KIR2DL1. Cen-B1 has the longest motif characterized by the presence of KIR2DL2, KIR2DS2, KIR2DL5, KIR2DS3S5, KIR2DP1, and KIR2DL1. The truncated Cen-B2 motif has only KIR2DL2 and KIR2DS2. Telomeric motifs are Tel-A, characterized by the presence of KIR3DL1 and KIR2DS4, and Tel-B, characterized by inclusion of KIR3DS1, KIR2DL5, KIR2DS3S5, and KIR2DS1. A seventh haplotype identified by Pyo et al. (2010) consists of a fourth centromeric motif (Cen-B3) with Tel-A; the Cen-B3 motif appears to be midway between Cen-B1 and Cen-A, with KIR2DL3, KIR2DL5, KIR2DS3S5, KIR2DP1, and KIR2DL1, and has been observed only at low frequencies in reference populations.
The apparent rapid evolution within the KIR complex via repeated recombination and duplication events (Khakoo et al. 2000; Vilches and Parham 2002; Guethlein et al. 2007; Canavez et al. 2001), coupled with the critical role of natural killers cells in innate immune surveillance, suggests that pathogen-driven selection may in part drive the worldwide patterns of genetic variation observed in the KIR, as has been proposed for the HLA region (Trowsdale and Parham 2004; Trowsdale 2001; Vilches and Parham 2002). The rapid evolution of the KIR relative to the HLA genes may be reflective of selective processes promoting more efficient interactions with HLA class I molecules (Khakoo et al. 2000). Further selective pressures are likely related to the interaction of KIR and HLA genes in reproduction (Hiby et al. 2004; Moffett-King 2002). Our recent work has documented worldwide diversity in the KIR cluster (Hollenbach et al. 2010) and supports the notion that KIR are co-evolving with HLA (Single et al. 2007b). Like HLA, the KIR repertoire is likely to have been shaped by numerous events in human population history, most notably migrations to, and subsequent expansions within, new geographic and climactic environments. Evolutionary pressures stemming from the transition from hunter-gatherer to agrarian societies; the sporadic, abrupt introduction of new pathogens to populations from outside sources; and the continued variation in pathogenic type and load at the local level may all have played a role in shaping the KIR repertoire globally. While the available data related to KIR variation in human populations have increased in recent years, the challenge in studies of this nature is to disentangle variation related to selective events from those tied to population history (Meyer et al. 2006; Single et al. 2008).
Interest in the characterization of worldwide KIR diversity is ongoing, with published complete gene content profiles for over 100 populations to date, and many more populations typed for one or a few KIR loci (allelefrequencies.net). However, direct comparisons between populations are hindered by a lack of equivalence across data sets due to variations in typing methodology and the number of loci typed, as well as clarity regarding population collection and limited data regarding other genomic markers. In the present study, we investigate patterns of variation in the KIR cluster in a large and well-characterized sample of worldwide human populations in the Human Genome Diversity Project—Centre d'Etude du Polymorphisme Humain (HGDP-CEPH) panel (Cann et al. 2002) in order to obtain a comprehensive overview of diversity in the KIR gene cluster. Over 500,000 additional genomic markers have been typed in this panel by other investigators and the data made publicly available; comparison of KIR data with that from other genomic regions allows control for strictly demographic factors. These data represent the first overview of KIR population genetics in the well-documented HGDP-CEPH panel, and in publishing complete KIR genotypes and carrier frequencies substantially increases the available population level data for this important gene system.
Materials and methods
Subjects
The 52 populations comprising the HGDP-CEPH represent seven major world regions. KIR typing was performed using genomic DNA from 976 individuals from this panel after removal of atypical samples and related individuals (Cann et al. 2002). Sample sizes range for these populations between 7 and 46 individuals, with an average of 19 individuals (38 chromosomes) per population. Population details are given in Table 1. Populations are grouped by world regions as given in the HGDP-CEPH Stanford database (http://spsmart.cesga.es/ceph.php?dataSet=ceph_stanford).
Table 1.
HGDP-CEPH populations, sample size, and geographic location
| Population | Number | Region | Latitude | Longitude |
|---|---|---|---|---|
| Bantu N.E. | 11 | Africa | 3 S | 37 E |
| Bantu S | 8 | Africa | 29 S | 30 E |
| Biaka Pygmies | 29 | Africa | 30–31 | 66–67 E |
| Mandenka | 23 | Africa | 12 N | 12 W |
| Mbuti Pygmies | 12 | Africa | 1 N | 29 E |
| San | 7 | Africa | 21 S | 20 E |
| Yoruba | 23 | Africa | 6–10 N | 2–8 E |
| Mozabite | 27 | Middle East | 32 N | 3 E |
| Bedouin | 46 | Middle East | 4 N | 17 E |
| Palestinian | 42 | Middle East | 32 N | 35 E |
| Druze | 46 | Middle East | 32 N | 35 E |
| Adygei | 17 | Europe | 44 N | 39 E |
| French | 26 | Europe | 46 N | 2 E |
| French Basque | 22 | Europe | 43 N | 0 |
| North Italian | 14 | Europe | 46 N | 10 E |
| Orcadian | 13 | Europe | 59 N | 3 W |
| Russian | 24 | Europe | 61 N | 39–41 E |
| Sardinian | 24 | Europe | 40 N | 9 E |
| Tuscan | 8 | Europe | 43 N | 11 E |
| Pathan | 21 | Central-South Asia | 32–35 N 69 | 72 E |
| Makrani | 25 | Central-South Asia | 26 N | 62–66 E |
| Kalash | 24 | Central-South Asia | 35–37 N | 71–72 E |
| Hazara | 22 | Central-South Asia | 33–34 N | 70 E |
| Balochi | 23 | Central-South Asia | 30–31 N | 66–67 E |
| Barusho | 20 | Central-South Asia | 31 N | 35 E |
| Brahui | 22 | Central-South Asia | 36–37 N | 73–75 E |
| Sindhi | 23 | Central-South Asia | 24–27 N | 68–70 E |
| Uygur | 9 | Central-South Asia | 44 N | 81 E |
| Cambodian | 11 | East Asia | 12 N | 105 E |
| Dai | 8 | East Asia | 21 N | 100 E |
| Daur | 9 | East Asia | 48–49 N | 124 E |
| Han | 46 | East Asia | 36–39 N | 108–120 E |
| Hezhen | 10 | East Asia | 47–48 N | 132–135 E |
| Japanese | 31 | East Asia | 38 N | 138 E |
| Lahu | 10 | East Asia | 22 N | 100 E |
| Miaozu | 8 | East Asia | 28 N | 109 E |
| Mongola | 10 | East Asia | 45 N | 111 E |
| Naxi | 10 | East Asia | 26 N | 100 E |
| Orogen | 9 | East Asia | 48–53 N | 122–131 E |
| She | 10 | East Asia | 27 N | 119 E |
| Tu | 9 | East Asia | 36 N | 101 E |
| Tujia | 7 | East Asia | 29 N | 109 E |
| Xibo | 8 | East Asia | 43–44 N | 81–82 E |
| Yakut | 22 | East Asia | 62–64 N | 129–130 E |
| Yizu | 10 | East Asia | 28 N | 103 E |
| Papuan | 16 | Oceania | 4 S | 143 E |
| NAN Melanesian | 21 | Oceania | 6 S | 155 E |
| Karitiana | 24 | America | 10 S | 63 W |
| Maya | 24 | America | 19 N | 91 W |
| Pima | 25 | America | 29 N | 108 W |
| Surui | 15 | America | 11 S | 62 W |
| Colombian | 12 | America | 3 N | 68 W |
KIR genotyping
To genotype the KIR loci in the HGDP-CEPH, we utilized our high throughput single nucleotide polymorphism (SNP)-based KIR genotyping assay developed using the SEQUENOM™ MassARRAY (San Diego, CA, USA) on the matrix-assisted laser desorption/ionization time-of-flight (MALDI-TOF) mass spectrometer platform (Houtchens et al. 2007), which we modified to improve efficiency and accuracy, including all known alleles at the time (Hollenbach et al. 2009). The assay types for the presence or absence of 14 KIR loci and common alleles, including KIR2DL1*004, KIR2DS4*003/004/006/007 (form with truncated protein products which are not expressed on the cell surface; Middleton et al. 2007a), and KIR2DS4*001 (expressed and capable of being membrane-bound). Briefly, the two-tiered analysis includes 38 “capture” primer pairs to amplify specific KIR genes in the region surrounding the SNPs to be queried; this is followed by 39 homogenous mass extend primer reactions to differentiate individual SNP patterns for the 16 KIR genes on the MALDI-TOF platform. These assays were run using the KIR sequence alignment in the Immuno Polymorphism Database (IPD; http://www.ebi.ac.uk/ipd/kir) using version 1.4.0. Our typing system is regularly assessed against all known alleles in order to insure that all loci will be detected.
Statistical analysis and data visualization
A treemap of HGDP-CEPH sample size and number of unique KIR genotypes was constructed using the “tmPlot” function in the “Treemap” package (Tennekes 2010) for the R language for statistical computing (R Development Core Team 2008). The base code for the “dens2col” function was modified to produce a grayscale image, otherwise default settings for the “dens” option were used.
Carrier frequencies for the KIR loci were obtained by direct counting. Gene frequencies were estimated according to Lynch and Milligan (1994) using the “frequency” function for binary data in a diploid population in the GenAlEx package (Peakall and Smouse 2006). For the locus KIR2DL2L3 (KIR2DL2/KIR2DL3), gene frequencies were obtained by direct counting. A direct counting approach was also utilized to obtain an estimate for gene frequencies for the KIR3DL1S1 locus. There is evidence that in some populations there are haplotypes that lack this locus (Norman et al. 2007), and this appears to be the case for a small subset of individuals in this sample, occurring on one in five haplotypes in the most extreme case; however, the deletion is much rarer or absent in most of the populations examined here (detailed below in the “Results” section). Therefore, we felt that a direct counting approach that necessarily assumed the locus to be present on all haplotypes, while subject to some error, would provide a more accurate estimate of gene frequencies for this locus than simple estimation from carrier frequencies. The frequencies obtained in this manner were in general agreement with those inferred via haplotype estimation in which KIR3DL1S1 was estimated to be absent at moderate frequencies (detailed below).
A two-dimensional clustered heatmap for KIR carrier frequencies was constructed using the “heatmap” function in the base “stats” package for the R language for statistical computing (R Development Core Team 2008). Briefly, a hierarchical clustering was performed on a set of dissimilarities based on carrier frequencies for the KIR loci; both loci and populations were clustered in this manner, and frequency differences were illustrated via the default heatmap color gradient.
We have developed an implementation of the expectation-maximization (EM) algorithm for haplotype frequency estimation that accommodates KIR-specific constraints. Our constrained EM algorithm uses an a priori list of known/possible haplotypes to restrict the space of possible haplotype patterns due to known constraints on gene content variation and allelic variation. The constrained approach differs from traditional EM implementations, in which the set of all possible haplotypic combinations is generated from the observed genotypic data with no restrictions on possible haplotype patterns. The list of user-designated a priori haplotypes is said to “span” the set of observed genotypes in a study if all observed genotypes can be generated from at least one pair of haplotypes in the a priori list. If pairs of haplotypes from the a priori list do not account for all of the observed genotypes in the sample (i.e., the a priori list does not span the observed genotypes), care must be taken in the interpretation of the resulting estimates. Our algorithm uses sharp constraints, meaning that if the a priori haplotypes do not span the observed genotypes a warning/error message is produced and the a priori set must be increased. We began with an a priori list of haplotypes taken from published data based on sequence analysis of seven KIR gene content haplotypes (described above; Pyo et al. 2010) and used the program HAPLO-IHP (Yoo et al. 2007) to identify a minimal set of additional haplotypes necessary to span the observed genotypes, based upon the set of “constructed” haplotypes generated by the program. Examination of the extended haplotype output from HAPLO-IHP suggested that one haplotype not included in the initial list may be present at relatively high frequencies in some populations; this haplotype is identical to the extended B haplotype (CenB1 ~ TelB, Fig. 1), with the exception of a deletion of the KIR3DS1 locus, and has been previously observed in some populations, as described above (Norman et al. 2007). In order to account for the likelihood that this haplotype is present at appreciable frequencies in some populations in the HGDP-CEPH panel, haplotype frequencies were re-estimated with an amended input set (to include the KIR3DS1 deletion haplotype in addition to the seven haplotypes given in Pyo et al. 2010) via our method for the final frequency estimates, with considerably improved resolution in several populations.
Global heatmaps for haplotype frequency data were generated using Generic Mapping tools (Smith and Wessel 1990; Wessel and Smith 1998), an open source collection of tools used to manipulate geographic data sets. KIR haplotype frequency data were plotted using an adaptation of a shell script written by Owen Solberg for analysis of HLA allele data (www.pypop.org/popdata).
Distance from Africa was calculated using Addis Abbaba, Ethiopia as the central point (latitude 9 N, longitude 38 E) and the latitude and longitude for each population sample (Table 1), computed with the “distance” function in the GenAlEx package (Peakall and Smouse 2006). The carrier frequency of KIR3DS1 for each population was plotted against distance from Africa using the “ggplot 2” package for R (Wickham 2009). Data were analyzed for correlations between the frequencies of KIR3DS1 and their distance from Africa using the “cor” function in the R base package (Williams and Templeton 2003), as well as plotting and fitting of the regression line. In order to account for the non-independence of the study populations, testing of the statistical significance for the calculated correlation coefficients was accomplished via an empirical approach (Single et al. 2008). Briefly, empirical distributions for the correlation coefficients between KIR population frequencies and distances from Africa were generated from 4,132 genome-wide SNP markers from the HGDP-CEPH Genome Diversity Panel Database version 2.0 (ftp://ftp.cephb.fr/hgdp_v2) across all study populations. Only individuals for whom KIR genotyping was performed were included in the analysis of the SNP data. Empirical p values (p emp) represent the proportion of the distribution of the correlations for the additional markers that were greater in absolute value than the true correlation.
A similar approach was employed to obtain an empirical distribution for FST values from the same markers. Here, FST was calculated according to Nei (1987) using an in-house R script and p emp represents the proportion of the (two-tailed) distribution above or below the FST values obtained for the KIR loci.
Results
KIR genotypic variation in the HGDP-CEPH
Each KIR gene content profile (genotype) detected and the number of observations in the HGDP-CEPH population are shown in Fig. 2. For comparison purposes, the loci are arranged in accordance with previously reported genotypes in the allelefrequencies.net database (AFND), and the AFND identification number is given where applicable. Seventy unique genotypes are present in the 52 populations under study. Among these 70 genotypic profiles, 29 are observed in only one population; the majority (n = 25) is seen in only one individual, and five genotypes have not been previously reported in 108 populations listed on AFND. The six most frequent KIR genotypes in the HGDP-CEPH each have a frequency of ≥5 % worldwide, and together account for over two thirds of all genotypes observed in the panel (Table 2). These six genotypes correspond to the previously observed genotypes numbered one through six in the AFND and are the most common genotypes in the database. The most common gene content profile corresponds to homozygosity for the A haplotype (A/A) and is present in all but 3 of the 52 HGDP-CEPH populations. The two Oceanic populations (NAN Melanesian and Papua New Guinea) and one African population (San) did not have any individuals sampled with this profile; in contrast, of 108 populations listed in the AFND for whom KIR genotypes were reported in the literature, all report observations of this genotype. Indeed, the San, Papuan, and NAN Melanesian populations had very few individuals with any of the top six genotypes. In the Mbuti Pygmies, only one individual tested positive for the A/A genotype, and this population lacked any other individuals bearing any of the six most common genotypes. Seven of 29 “private” genotypes (observed in only one population) in the diversity panel are observed in the NAN Melanesian sample with one of these found in three individuals. In addition, two of the NAN Melanesian private genotypes have not been previously reported in any population tested to date. Three other previously unreported genotypes were detected in the HGDP-CEPH: one each in the Druze (Middle East), Orcadian (Europe), and Mbuti Pygmies (Africa) populations.
Fig. 2.
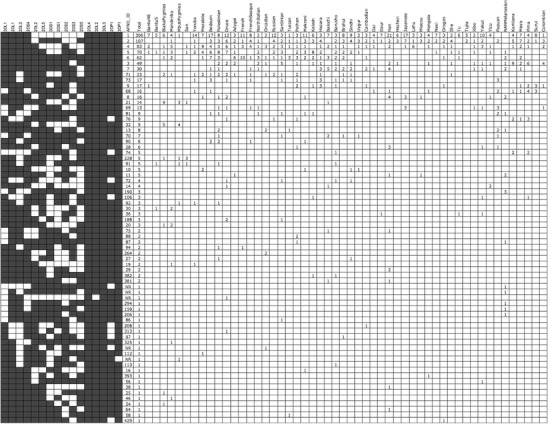
KIR genotypes detected and the number of observations in the HGDP-CEPH populations. Loci are arranged in accordance with previously reported genotypes in the allelefrequencies.net database (AFND), and the AFND identification number is given where applicable (AFND_ID)
Table 2.
Frequency of the six most common genotypes worldwide, with associated Cen and Tel haplotype structures
| AFND IDa | Cen | Tel | AFND populationsb (n) | HGDP-CEPH populations (n) | Worldwide (f) | Africa (f) | Mideast (f) | Europe (f) | CSAsia (f) | EAsia (f) | Oceania (f) | America (f) |
|---|---|---|---|---|---|---|---|---|---|---|---|---|
| 1 | A/A | A/A | 108 | 49 | 0.314 | 0.327 | 0.370 | 0.284 | 0.278 | 0.460 | 0.000 | 0.240 |
| 2 | A/A | A/B | 97 | 41 | 0.110 | 0.018 | 0.101 | 0.101 | 0.111 | 0.160 | 0.054 | 0.180 |
| 4 | A/B2 | A/A | 99 | 39 | 0.085 | 0.088 | 0.185 | 0.122 | 0.039 | 0.084 | 0.000 | 0.060 |
| 5 | A/B1 | A/A | 90 | 28 | 0.072 | 0.080 | 0.210 | 0.054 | 0.117 | 0.025 | 0.027 | 0.000 |
| 6 | A/B1 | A/B | 86 | 25 | 0.064 | 0.027 | 0.092 | 0.176 | 0.083 | 0.013 | 0.054 | 0.020 |
| 3 | A/B2 | A/B | 88 | 23 | 0.050 | 0.000 | 0.034 | 0.068 | 0.028 | 0.034 | 0.027 | 0.210 |
| Total | 0.694 | 0.540 | 0.992 | 0.804 | 0.656 | 0.776 | 0.162 | 0.710 |
Counts for the number of populations with observations of a given genotype in the AFND and HGDP panel are shown and worldwide and region-specific frequencies
aGenotype ID in the allelefrequencies.net database
bOut of 108 population entries in AFND panel
Worldwide, an average of eight unique gene content profiles (genotypes) are observed in each population; however, there is a wide range among populations. Several Asian populations in the sample are extremely homogenous for the KIR, with only two or three different genotypes; however, the sample sizes for these populations are among the smallest in the panel. In contrast, the Palestinian population is the most diverse, with 18 unique genotypes, but the sample size is one of the largest in the panel. In order to visualize the relationship between sample size and KIR genotypic diversity in the HGDP populations, we constructed a treemap, which displays a graphical representation of hierarchical data via variation in color and area (Fig. 3). While there is a general correlation between populations with larger sample size and greater numbers of KIR genotypes observed, the treemap clearly shows that even within world regions considerable variation exists between populations with similar sample size. This means of visualization also allows ready comparison of sampling variation between world regions. While there is fairly even representation from the major world regions (with the exception of Oceania, with only two populations), it is clear for example that there is an over-representation of East Asian populations, with numerous populations comprised of small numbers of individuals and fewer unique genotypes. In contrast, there are relatively few North African/Middle Eastern populations represented within the diversity panel, but their sample sizes are much larger than most, and many unique genotypes are observed. These observations highlight the need for caution in over-interpretation of the data, particularly when performing analyses between and across world regions, some of which are more or less fully represented in this panel.
Fig. 3.
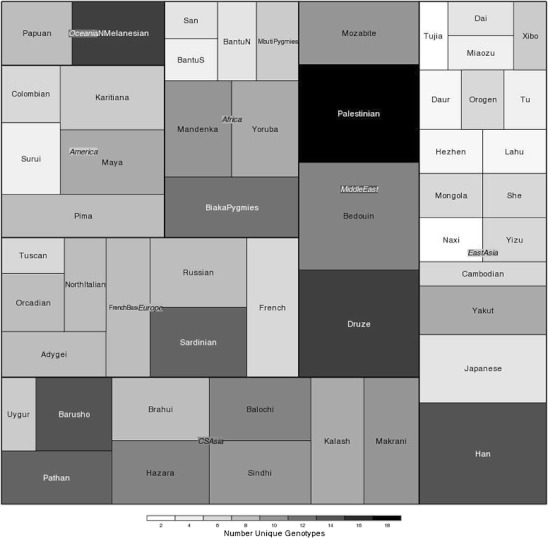
Treemap depicting sample size and genotypic diversity in each HGDP-CEPH population, organized by world region. The size of the rectangle for each population or region corresponds to sample size. Variation in the number of genotypes detected in each population is given by grayscale variation
KIR frequency distributions in the HGDP-CEPH
Gene and carrier frequencies for all of the KIR loci typed in the HGDP-CEPH populations are given in Table 3. The two-dimensional clustered heatmap based on carrier frequencies for all KIR loci typed in this study (Fig. 4) allows visualization along the first dimension (x-axis, KIR loci) of the strong linkage disequilibrium between the loci associated with the A and B haplotypes that define the two major clades. The heatmap clearly illustrates the much higher frequencies for all A haplotype loci, as well as subnodes within both major clusters along affiliation with the centromeric and telomeric intervals of the KIR region. Clustering in the second dimension (y-axis, populations) reveals two major clades according to the relative carrier frequency of the B haplotype loci. Within the larger cluster defined by higher overall carrier frequencies of B-haplotype-associated loci, specific patterns of genotypic variation are clearly seen in the independent clustering of the three African hunter-gather populations (the San and Biaka and Mbuti Pygmies); these three populations are characterized by high overall B haplotype frequencies, with the notable exception of KIR2DS1, KIR2DS3, and KIR3DS1. A separate cluster with the two Oceanic populations is defined by high frequencies for most B haplotype loci. A third cluster is composed of three Amerindian populations (Karitiana, Pima, and Columbian), where KIR2DS3 is virtually absent. The large cluster associated with generally lower B haplotype frequencies is populated primarily by the remaining African and East Asian populations. The African populations are further distinguished by exceptionally low frequencies of the telomeric B haplotype loci.
Table 3.
Gene and carrier frequencies for KIR loci in the HGDP-CEPH
| Population | Frequency | 2DL1 | 2DL2 | 2DL3 | 2DL4 | 2DL5 | 2DP1 | 2DS1 | 2DS2 | 2DS3 | 2DS4 | 2DS5 | 3DL1 | 3DL2 | 3DL3 | 3DP1 | 3DS1 |
|---|---|---|---|---|---|---|---|---|---|---|---|---|---|---|---|---|---|
| Bantu N.E. | Carrier | 1.000 | 0.364 | 1.000 | 1.000 | 0.182 | 1.000 | 0.091 | 0.364 | 0.091 | 1.000 | 0.091 | 1.000 | 1.000 | 1.000 | 1.000 | 0.000 |
| Gene | 1.000 | 0.202 | 1.000 | 1.000 | 0.095 | 1.000 | 0.047 | 0.202 | 0.047 | 1.000 | 0.047 | 1.000 | 1.000 | 1.000 | 1.000 | 0.000 | |
| Bantu S. | Carrier | 1.000 | 0.250 | 0.875 | 1.000 | 0.375 | 1.000 | 0.125 | 0.250 | 0.375 | 1.000 | 0.125 | 1.000 | 1.000 | 1.000 | 1.000 | 0.000 |
| Gene | 1.000 | 0.134 | 0.646 | 1.000 | 0.209 | 1.000 | 0.065 | 0.134 | 0.209 | 1.000 | 0.065 | 1.000 | 1.000 | 1.000 | 1.000 | 0.000 | |
| Biaka Pygmies | Carrier | 1.000 | 0.621 | 0.897 | 1.000 | 0.759 | 1.000 | 0.034 | 0.586 | 0.172 | 1.000 | 0.655 | 1.000 | 1.000 | 1.000 | 1.000 | 0.069 |
| Gene | 1.000 | 0.384 | 0.678 | 1.000 | 0.509 | 1.000 | 0.017 | 0.357 | 0.090 | 1.000 | 0.413 | 1.000 | 1.000 | 1.000 | 1.000 | 0.035 | |
| Mandenka | Carrier | 1.000 | 0.696 | 0.913 | 1.000 | 0.565 | 1.000 | 0.217 | 0.522 | 0.391 | 0.957 | 0.304 | 1.000 | 1.000 | 1.000 | 1.000 | 0.174 |
| Gene | 1.000 | 0.448 | 0.705 | 1.000 | 0.341 | 1.000 | 0.115 | 0.308 | 0.220 | 0.791 | 0.166 | 1.000 | 1.000 | 1.000 | 1.000 | 0.091 | |
| Mbuti Pygmies | Carrier | 1.000 | 0.583 | 0.667 | 1.000 | 0.917 | 1.000 | 0.250 | 0.583 | 0.083 | 1.000 | 0.917 | 1.000 | 1.000 | 1.000 | 0.917 | 0.000 |
| Gene | 1.000 | 0.355 | 0.423 | 1.000 | 0.711 | 1.000 | 0.134 | 0.355 | 0.043 | 1.000 | 0.711 | 1.000 | 1.000 | 1.000 | 0.711 | 0.000 | |
| San | Carrier | 1.000 | 1.000 | 0.429 | 1.000 | 0.857 | 1.000 | 0.143 | 1.000 | 0.286 | 1.000 | 0.714 | 1.000 | 1.000 | 1.000 | 1.000 | 0.000 |
| Gene | 1.000 | 1.000 | 0.244 | 1.000 | 0.622 | 1.000 | 0.074 | 1.000 | 0.155 | 1.000 | 0.465 | 1.000 | 1.000 | 1.000 | 1.000 | 0.000 | |
| Yoruba | Carrier | 1.000 | 0.348 | 0.870 | 1.000 | 0.304 | 1.000 | 0.174 | 0.304 | 0.174 | 0.957 | 0.174 | 0.957 | 1.000 | 1.000 | 1.000 | 0.130 |
| Gene | 1.000 | 0.192 | 0.639 | 1.000 | 0.166 | 1.000 | 0.091 | 0.166 | 0.091 | 0.791 | 0.091 | 0.791 | 1.000 | 1.000 | 1.000 | 0.067 | |
| Mozabite | Carrier | 1.000 | 0.630 | 0.889 | 1.000 | 0.333 | 1.000 | 0.074 | 0.704 | 0.333 | 1.000 | 0.074 | 1.000 | 1.000 | 1.000 | 1.000 | 0.074 |
| Gene | 1.000 | 0.391 | 0.667 | 1.000 | 0.184 | 1.000 | 0.038 | 0.456 | 0.184 | 1.000 | 0.038 | 1.000 | 1.000 | 1.000 | 1.000 | 0.038 | |
| Bedouin | Carrier | 1.000 | 0.565 | 0.848 | 1.000 | 0.543 | 1.000 | 0.391 | 0.565 | 0.457 | 0.957 | 0.326 | 0.957 | 1.000 | 1.000 | 1.000 | 0.391 |
| Gene | 1.000 | 0.341 | 0.610 | 1.000 | 0.324 | 1.000 | 0.220 | 0.341 | 0.263 | 0.791 | 0.179 | 0.791 | 1.000 | 1.000 | 1.000 | 0.220 | |
| Palestinian | Carrier | 1.000 | 0.667 | 0.810 | 1.000 | 0.738 | 1.000 | 0.405 | 0.667 | 0.571 | 0.929 | 0.310 | 0.929 | 1.000 | 1.000 | 1.000 | 0.452 |
| Gene | 1.000 | 0.423 | 0.564 | 1.000 | 0.488 | 1.000 | 0.228 | 0.423 | 0.345 | 0.733 | 0.169 | 0.733 | 1.000 | 1.000 | 1.000 | 0.260 | |
| Druze | Carrier | 0.935 | 0.500 | 0.870 | 1.000 | 0.478 | 0.935 | 0.283 | 0.500 | 0.261 | 0.957 | 0.239 | 0.957 | 0.978 | 1.000 | 1.000 | 0.370 |
| Gene | 0.745 | 0.293 | 0.639 | 1.000 | 0.278 | 0.745 | 0.153 | 0.293 | 0.140 | 0.791 | 0.128 | 0.791 | 0.853 | 1.000 | 1.000 | 0.206 | |
| Adygei | Carrier | 1.000 | 0.706 | 0.941 | 1.000 | 0.765 | 1.000 | 0.647 | 0.706 | 0.529 | 1.000 | 0.588 | 1.000 | 1.000 | 1.000 | 1.000 | 0.588 |
| Gene | 1.000 | 0.458 | 0.757 | 1.000 | 0.515 | 1.000 | 0.406 | 0.458 | 0.314 | 1.000 | 0.358 | 1.000 | 1.000 | 1.000 | 1.000 | 0.358 | |
| French | Carrier | 1.000 | 0.538 | 0.962 | 1.000 | 0.462 | 1.000 | 0.423 | 0.538 | 0.423 | 1.000 | 0.423 | 1.000 | 1.000 | 1.000 | 1.000 | 0.462 |
| Gene | 1.000 | 0.321 | 0.804 | 1.000 | 0.266 | 1.000 | 0.240 | 0.321 | 0.240 | 1.000 | 0.240 | 1.000 | 1.000 | 1.000 | 1.000 | 0.266 | |
| French Basque | Carrier | 1.000 | 0.409 | 0.864 | 1.000 | 0.455 | 1.000 | 0.409 | 0.409 | 0.227 | 0.955 | 0.318 | 0.955 | 1.000 | 1.000 | 1.000 | 0.409 |
| Gene | 1.000 | 0.231 | 0.631 | 1.000 | 0.261 | 1.000 | 0.231 | 0.231 | 0.121 | 0.787 | 0.174 | 0.787 | 1.000 | 1.000 | 1.000 | 0.231 | |
| North Italian | Carrier | 1.000 | 0.714 | 0.929 | 1.000 | 0.786 | 1.000 | 0.643 | 0.714 | 0.500 | 0.857 | 0.571 | 0.857 | 1.000 | 1.000 | 1.000 | 0.643 |
| Gene | 1.000 | 0.465 | 0.733 | 1.000 | 0.537 | 1.000 | 0.402 | 0.465 | 0.293 | 0.622 | 0.345 | 0.622 | 1.000 | 1.000 | 1.000 | 0.402 | |
| Orcadian | Carrier | 1.000 | 0.692 | 0.846 | 1.000 | 0.385 | 0.923 | 0.154 | 0.692 | 0.462 | 1.000 | 0.154 | 1.000 | 1.000 | 1.000 | 1.000 | 0.538 |
| Gene | 1.000 | 0.445 | 0.608 | 1.000 | 0.216 | 0.723 | 0.080 | 0.445 | 0.266 | 1.000 | 0.080 | 1.000 | 1.000 | 1.000 | 1.000 | 0.321 | |
| Russian | Carrier | 0.958 | 0.333 | 0.875 | 1.000 | 0.417 | 0.958 | 0.250 | 0.333 | 0.208 | 1.000 | 0.250 | 1.000 | 1.000 | 1.000 | 1.000 | 0.250 |
| Gene | 0.796 | 0.184 | 0.646 | 1.000 | 0.236 | 0.796 | 0.134 | 0.184 | 0.110 | 1.000 | 0.134 | 1.000 | 1.000 | 1.000 | 1.000 | 0.134 | |
| Sardinian | Carrier | 0.958 | 0.792 | 0.833 | 1.000 | 0.667 | 0.958 | 0.500 | 0.792 | 0.333 | 0.917 | 0.500 | 0.875 | 1.000 | 1.000 | 1.000 | 0.542 |
| Gene | 0.796 | 0.544 | 0.592 | 1.000 | 0.423 | 0.796 | 0.293 | 0.544 | 0.184 | 0.711 | 0.293 | 0.646 | 1.000 | 1.000 | 1.000 | 0.323 | |
| Tuscan | Carrier | 1.000 | 0.750 | 1.000 | 1.000 | 0.750 | 1.000 | 0.625 | 0.625 | 0.625 | 1.000 | 0.625 | 1.000 | 1.000 | 1.000 | 1.000 | 0.750 |
| Gene | 1.000 | 0.500 | 1.000 | 1.000 | 0.500 | 1.000 | 0.388 | 0.388 | 0.388 | 1.000 | 0.388 | 1.000 | 1.000 | 1.000 | 1.000 | 0.500 | |
| Pathan | Carrier | 0.952 | 0.667 | 0.810 | 1.000 | 0.810 | 0.952 | 0.619 | 0.762 | 0.476 | 0.905 | 0.619 | 0.857 | 1.000 | 1.000 | 1.000 | 0.524 |
| Gene | 0.782 | 0.423 | 0.564 | 1.000 | 0.564 | 0.782 | 0.383 | 0.512 | 0.276 | 0.691 | 0.383 | 0.622 | 1.000 | 1.000 | 1.000 | 0.310 | |
| Makrani | Carrier | 1.000 | 0.320 | 0.920 | 1.000 | 0.440 | 1.000 | 0.360 | 0.360 | 0.320 | 0.960 | 0.240 | 0.960 | 1.000 | 1.000 | 1.000 | 0.360 |
| Gene | 1.000 | 0.175 | 0.717 | 1.000 | 0.252 | 1.000 | 0.200 | 0.200 | 0.175 | 0.800 | 0.128 | 0.800 | 1.000 | 1.000 | 1.000 | 0.200 | |
| Kalash | Carrier | 0.958 | 0.625 | 0.917 | 1.000 | 0.750 | 0.958 | 0.417 | 0.625 | 0.500 | 0.958 | 0.417 | 0.958 | 1.000 | 1.000 | 1.000 | 0.292 |
| Gene | 0.796 | 0.388 | 0.711 | 1.000 | 0.500 | 0.796 | 0.236 | 0.388 | 0.293 | 0.796 | 0.236 | 0.796 | 1.000 | 1.000 | 1.000 | 0.158 | |
| Hazara | Carrier | 1.000 | 0.682 | 0.818 | 1.000 | 0.818 | 1.000 | 0.682 | 0.682 | 0.455 | 1.000 | 0.545 | 1.000 | 1.000 | 1.000 | 1.000 | 0.545 |
| Gene | 1.000 | 0.436 | 0.574 | 1.000 | 0.574 | 1.000 | 0.436 | 0.436 | 0.261 | 1.000 | 0.326 | 1.000 | 1.000 | 1.000 | 1.000 | 0.326 | |
| Balochi | Carrier | 1.000 | 0.609 | 1.000 | 1.000 | 0.565 | 1.000 | 0.522 | 0.565 | 0.478 | 0.870 | 0.348 | 0.870 | 1.000 | 1.000 | 1.000 | 0.565 |
| Gene | 1.000 | 0.374 | 1.000 | 1.000 | 0.341 | 1.000 | 0.308 | 0.341 | 0.278 | 0.639 | 0.192 | 0.639 | 1.000 | 1.000 | 1.000 | 0.341 | |
| Barusho | Carrier | 0.900 | 0.750 | 0.750 | 1.000 | 0.750 | 0.900 | 0.650 | 0.750 | 0.500 | 0.950 | 0.500 | 0.950 | 1.000 | 1.000 | 1.000 | 0.450 |
| Gene | 0.684 | 0.500 | 0.500 | 1.000 | 0.500 | 0.684 | 0.408 | 0.500 | 0.293 | 0.776 | 0.293 | 0.776 | 1.000 | 1.000 | 1.000 | 0.258 | |
| Brahui | Carrier | 0.955 | 0.500 | 0.864 | 1.000 | 0.591 | 0.955 | 0.455 | 0.500 | 0.455 | 0.955 | 0.318 | 0.955 | 1.000 | 1.000 | 1.000 | 0.409 |
| Gene | 0.787 | 0.293 | 0.631 | 1.000 | 0.360 | 0.787 | 0.261 | 0.293 | 0.261 | 0.787 | 0.174 | 0.787 | 1.000 | 1.000 | 1.000 | 0.231 | |
| Sindhi | Carrier | 0.957 | 0.348 | 0.870 | 1.000 | 0.522 | 0.957 | 0.348 | 0.391 | 0.304 | 1.000 | 0.261 | 1.000 | 1.000 | 1.000 | 1.000 | 0.391 |
| Gene | 0.791 | 0.192 | 0.639 | 1.000 | 0.308 | 0.791 | 0.192 | 0.220 | 0.166 | 1.000 | 0.140 | 1.000 | 1.000 | 1.000 | 1.000 | 0.220 | |
| Uygur | Carrier | 1.000 | 0.333 | 1.000 | 1.000 | 0.556 | 1.000 | 0.444 | 0.444 | 0.222 | 0.889 | 0.444 | 0.889 | 1.000 | 1.000 | 1.000 | 0.444 |
| Gene | 1.000 | 0.184 | 1.000 | 1.000 | 0.333 | 1.000 | 0.255 | 0.255 | 0.118 | 0.667 | 0.255 | 0.667 | 1.000 | 1.000 | 1.000 | 0.255 | |
| Cambodian | Carrier | 0.909 | 0.545 | 0.909 | 1.000 | 0.545 | 0.909 | 0.636 | 0.545 | 0.273 | 1.000 | 0.364 | 1.000 | 1.000 | 1.000 | 1.000 | 0.455 |
| Gene | 0.698 | 0.326 | 0.698 | 1.000 | 0.326 | 0.698 | 0.397 | 0.326 | 0.147 | 1.000 | 0.202 | 1.000 | 1.000 | 1.000 | 1.000 | 0.261 | |
| Dai | Carrier | 1.000 | 0.375 | 1.000 | 1.000 | 0.375 | 1.000 | 0.375 | 0.375 | 0.125 | 0.875 | 0.250 | 0.875 | 1.000 | 1.000 | 1.000 | 0.375 |
| Gene | 1.000 | 0.209 | 1.000 | 1.000 | 0.209 | 1.000 | 0.209 | 0.209 | 0.065 | 0.646 | 0.134 | 0.646 | 1.000 | 1.000 | 1.000 | 0.209 | |
| Daur | Carrier | 1.000 | 0.000 | 1.000 | 1.000 | 0.222 | 1.000 | 0.111 | 0.111 | 0.111 | 1.000 | 0.111 | 1.000 | 1.000 | 1.000 | 1.000 | 0.111 |
| Gene | 1.000 | 0.000 | 1.000 | 1.000 | 0.118 | 1.000 | 0.057 | 0.057 | 0.057 | 1.000 | 0.057 | 1.000 | 1.000 | 1.000 | 1.000 | 0.057 | |
| Han | Carrier | 1.000 | 0.326 | 1.000 | 1.000 | 0.500 | 1.000 | 0.478 | 0.261 | 0.304 | 0.957 | 0.217 | 0.957 | 1.000 | 1.000 | 1.000 | 0.413 |
| Gene | 1.000 | 0.179 | 1.000 | 1.000 | 0.293 | 1.000 | 0.278 | 0.140 | 0.166 | 0.791 | 0.115 | 0.791 | 1.000 | 1.000 | 1.000 | 0.234 | |
| Hezhen | Carrier | 1.000 | 0.100 | 1.000 | 1.000 | 0.400 | 1.000 | 0.400 | 0.100 | 0.000 | 1.000 | 0.400 | 1.000 | 1.000 | 1.000 | 1.000 | 0.400 |
| Gene | 1.000 | 0.051 | 1.000 | 1.000 | 0.225 | 1.000 | 0.225 | 0.051 | 0.000 | 1.000 | 0.225 | 1.000 | 1.000 | 1.000 | 1.000 | 0.225 | |
| Japanese | Carrier | 1.000 | 0.032 | 1.000 | 1.000 | 0.419 | 1.000 | 0.419 | 0.032 | 0.097 | 0.903 | 0.323 | 0.903 | 1.000 | 1.000 | 1.000 | 0.419 |
| Gene | 1.000 | 0.016 | 1.000 | 1.000 | 0.238 | 1.000 | 0.238 | 0.016 | 0.050 | 0.689 | 0.177 | 0.689 | 1.000 | 1.000 | 1.000 | 0.238 | |
| Lahu | Carrier | 1.000 | 0.600 | 1.000 | 1.000 | 0.100 | 1.000 | 0.100 | 0.600 | 0.000 | 1.000 | 0.100 | 1.000 | 1.000 | 1.000 | 1.000 | 0.100 |
| Gene | 1.000 | 0.368 | 1.000 | 1.000 | 0.051 | 1.000 | 0.051 | 0.368 | 0.000 | 1.000 | 0.051 | 1.000 | 1.000 | 1.000 | 1.000 | 0.051 | |
| Miaozu | Carrier | 1.000 | 0.125 | 1.000 | 1.000 | 0.625 | 1.000 | 0.625 | 0.125 | 0.250 | 1.000 | 0.375 | 1.000 | 1.000 | 1.000 | 1.000 | 0.500 |
| Gene | 1.000 | 0.065 | 1.000 | 1.000 | 0.388 | 1.000 | 0.388 | 0.065 | 0.134 | 1.000 | 0.209 | 1.000 | 1.000 | 1.000 | 1.000 | 0.293 | |
| Mongola | Carrier | 1.000 | 0.300 | 1.000 | 1.000 | 0.500 | 1.000 | 0.500 | 0.400 | 0.000 | 0.900 | 0.500 | 0.900 | 1.000 | 1.000 | 1.000 | 0.400 |
| Gene | 1.000 | 0.163 | 1.000 | 1.000 | 0.293 | 1.000 | 0.293 | 0.225 | 0.000 | 0.684 | 0.293 | 0.684 | 1.000 | 1.000 | 1.000 | 0.225 | |
| Naxi | Carrier | 1.000 | 0.100 | 1.000 | 1.000 | 0.300 | 1.000 | 0.200 | 0.100 | 0.100 | 1.000 | 0.200 | 1.000 | 1.000 | 1.000 | 1.000 | 0.200 |
| Gene | 1.000 | 0.051 | 1.000 | 1.000 | 0.163 | 1.000 | 0.106 | 0.051 | 0.051 | 1.000 | 0.106 | 1.000 | 1.000 | 1.000 | 1.000 | 0.106 | |
| Orogen | Carrier | 1.000 | 0.444 | 1.000 | 1.000 | 0.556 | 0.889 | 0.556 | 0.444 | 0.111 | 1.000 | 0.556 | 1.000 | 1.000 | 1.000 | 1.000 | 0.444 |
| Gene | 1.000 | 0.255 | 1.000 | 1.000 | 0.333 | 0.667 | 0.333 | 0.255 | 0.057 | 1.000 | 0.333 | 1.000 | 1.000 | 1.000 | 1.000 | 0.255 | |
| She | Carrier | 1.000 | 0.400 | 0.900 | 1.000 | 0.700 | 1.000 | 0.500 | 0.400 | 0.200 | 1.000 | 0.500 | 1.000 | 1.000 | 1.000 | 1.000 | 0.500 |
| Gene | 1.000 | 0.225 | 0.684 | 1.000 | 0.452 | 1.000 | 0.293 | 0.225 | 0.106 | 1.000 | 0.293 | 1.000 | 1.000 | 1.000 | 1.000 | 0.293 | |
| Tu | Carrier | 1.000 | 0.222 | 1.000 | 1.000 | 0.333 | 1.000 | 0.111 | 0.333 | 0.333 | 1.000 | 0.111 | 1.000 | 1.000 | 1.000 | 1.000 | 0.111 |
| Gene | 1.000 | 0.118 | 1.000 | 1.000 | 0.184 | 1.000 | 0.057 | 0.184 | 0.184 | 1.000 | 0.057 | 1.000 | 1.000 | 1.000 | 1.000 | 0.057 | |
| Tujia | Carrier | 1.000 | 0.000 | 1.000 | 1.000 | 0.286 | 1.000 | 0.286 | 0.000 | 0.000 | 1.000 | 0.286 | 1.000 | 1.000 | 1.000 | 1.000 | 0.286 |
| Gene | 1.000 | 0.000 | 1.000 | 1.000 | 0.155 | 1.000 | 0.155 | 0.000 | 0.000 | 1.000 | 0.155 | 1.000 | 1.000 | 1.000 | 1.000 | 0.155 | |
| Xibo | Carrier | 1.000 | 0.500 | 1.000 | 1.000 | 0.625 | 1.000 | 0.500 | 0.500 | 0.250 | 0.875 | 0.375 | 0.875 | 1.000 | 1.000 | 1.000 | 0.500 |
| Gene | 1.000 | 0.293 | 1.000 | 1.000 | 0.388 | 1.000 | 0.293 | 0.293 | 0.134 | 0.646 | 0.209 | 0.646 | 1.000 | 1.000 | 1.000 | 0.293 | |
| Yakut | Carrier | 0.955 | 0.273 | 0.955 | 1.000 | 0.409 | 0.955 | 0.364 | 0.364 | 0.182 | 0.955 | 0.318 | 0.955 | 1.000 | 1.000 | 1.000 | 0.318 |
| Gene | 0.787 | 0.147 | 0.787 | 1.000 | 0.231 | 0.787 | 0.202 | 0.202 | 0.095 | 0.787 | 0.174 | 0.787 | 1.000 | 1.000 | 1.000 | 0.174 | |
| Yizu | Carrier | 1.000 | 0.300 | 1.000 | 1.000 | 0.300 | 1.000 | 0.200 | 0.300 | 0.200 | 1.000 | 0.100 | 1.000 | 1.000 | 1.000 | 1.000 | 0.400 |
| Gene | 1.000 | 0.163 | 1.000 | 1.000 | 0.163 | 1.000 | 0.106 | 0.163 | 0.106 | 1.000 | 0.051 | 1.000 | 1.000 | 1.000 | 1.000 | 0.225 | |
| Papuan | Carrier | 1.000 | 0.625 | 0.688 | 1.000 | 1.000 | 1.000 | 0.875 | 0.625 | 0.563 | 0.500 | 0.875 | 0.500 | 1.000 | 1.000 | 1.000 | 1.000 |
| Gene | 1.000 | 0.388 | 0.441 | 1.000 | 1.000 | 1.000 | 0.646 | 0.388 | 0.339 | 0.293 | 0.646 | 0.293 | 1.000 | 1.000 | 1.000 | 1.000 | |
| NAN Melanesian | Carrier | 0.952 | 0.905 | 0.714 | 1.000 | 1.000 | 0.952 | 0.905 | 0.810 | 0.952 | 0.667 | 0.381 | 0.524 | 1.000 | 1.000 | 1.000 | 0.857 |
| Gene | 0.782 | 0.691 | 0.465 | 1.000 | 1.000 | 0.782 | 0.691 | 0.564 | 0.782 | 0.423 | 0.213 | 0.310 | 1.000 | 1.000 | 1.000 | 0.622 | |
| Karitiana | Carrier | 0.833 | 0.625 | 0.833 | 1.000 | 0.792 | 0.833 | 0.792 | 0.625 | 0.000 | 0.875 | 0.792 | 0.875 | 1.000 | 1.000 | 1.000 | 0.792 |
| Gene | 0.592 | 0.388 | 0.592 | 1.000 | 0.544 | 0.592 | 0.544 | 0.388 | 0.000 | 0.646 | 0.544 | 0.646 | 1.000 | 1.000 | 1.000 | 0.544 | |
| Maya | Carrier | 0.958 | 0.417 | 0.958 | 1.000 | 0.625 | 0.958 | 0.625 | 0.417 | 0.125 | 0.958 | 0.583 | 0.958 | 1.000 | 1.000 | 1.000 | 0.583 |
| Gene | 0.796 | 0.236 | 0.796 | 1.000 | 0.388 | 0.796 | 0.388 | 0.236 | 0.065 | 0.796 | 0.355 | 0.796 | 1.000 | 1.000 | 1.000 | 0.355 | |
| Pima | Carrier | 0.760 | 0.760 | 0.760 | 1.000 | 0.800 | 0.760 | 0.800 | 0.760 | 0.000 | 0.760 | 0.800 | 0.760 | 1.000 | 1.000 | 1.000 | 0.680 |
| Gene | 0.510 | 0.510 | 0.510 | 1.000 | 0.553 | 0.510 | 0.553 | 0.510 | 0.000 | 0.510 | 0.553 | 0.510 | 1.000 | 1.000 | 1.000 | 0.434 | |
| Surui | Carrier | 1.000 | 0.400 | 1.000 | 1.000 | 0.467 | 1.000 | 0.467 | 0.400 | 0.000 | 0.800 | 0.467 | 0.800 | 1.000 | 1.000 | 1.000 | 0.267 |
| Gene | 1.000 | 0.225 | 1.000 | 1.000 | 0.270 | 1.000 | 0.270 | 0.225 | 0.000 | 0.553 | 0.270 | 0.553 | 1.000 | 1.000 | 1.000 | 0.144 | |
| Colombian | Carrier | 1.000 | 0.583 | 1.000 | 1.000 | 0.750 | 1.000 | 0.750 | 0.583 | 0.000 | 0.917 | 0.750 | 0.917 | 1.000 | 1.000 | 1.000 | 0.667 |
| Gene | 1.000 | 0.355 | 1.000 | 1.000 | 0.500 | 1.000 | 0.500 | 0.355 | 0.000 | 0.711 | 0.500 | 0.711 | 1.000 | 1.000 | 1.000 | 0.423 |
Fig. 4.
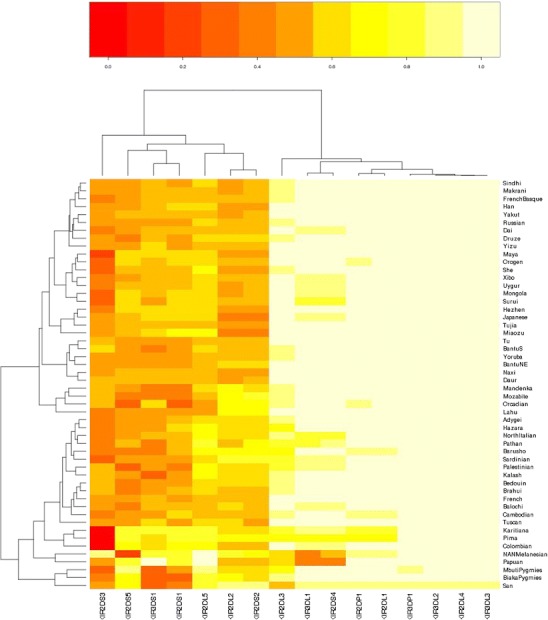
A two-dimensional clustered heatmap based on carrier frequencies for all KIR loci typed in the HGDP-CEPH. KIR loci are clustered along the x-axis and populations along the y-axis according to similarities in carrier frequencies of the loci. Variations in carrier frequencies are depicted by the color scale
KIR haplotypes in the HGDP-CEPH
Frequency distributions obtained via population level haplotype estimation for the most common haplotypes observed in the HGDP-CEPH (Fig. 1) are shown in Fig. 5a–g. The six gene content haplotypes illustrated in Fig. 1 are all observed at frequencies ≥0.05 in all geographic regions, and combinations of these six correspond to the six most common genotypes worldwide (Fig. 2 and AFND). Together these six haplotypes account for 85 % of the total observed variation in most world regions examined here, with the exception of Africa and Oceania, where extensive diversity in the B haplotype is observed. While haplotype estimation for the more common KIR genotypes is relatively robust (Gourraud et al. 2007), considerable phase uncertainty is inherent for the more rare genotypes, due to limited linkage disequilibrium and small sample sizes in many cases; in some populations, up to 15 % of haplotypes are not resolved according to the input list described in “Materials and methods”. While the specifics regarding phase for these haplotypes are unresolved, they are reflected in the less common genotypes shown in Fig. 2.
Fig. 5.
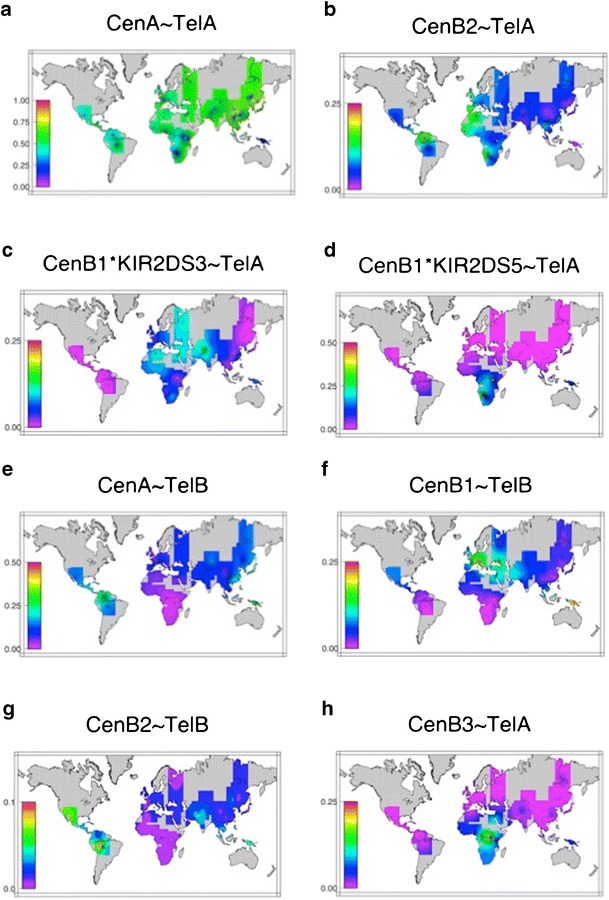
a–h Worldwide KIR haplotype frequencies, based on population level estimates, in the HGDP-CEPH
As noted above, although worldwide approximately 30 % of individuals are homozygous for the canonical A haplotype (f = 0.54), a wide range in the A haplotype frequency is observed between populations, from 8 to 80 % (Fig. 5a). The frequency of Cen-A is generally stable in the range 50–60 % in most populations worldwide, with the exception of within East Asia, where Cen-A is observed at frequencies of greater than 80 %; this is evidenced in the very low frequency of KIR2DL2 and KIR2DS2 in these populations (Table 3). It is interesting to note, however, that the trend toward the Cen-A motif is not observed in Amerindian populations, suggesting that this shift occurred within East Asia subsequent to the differentiation of Amerindians from these populations.
Perhaps most striking, an unusual pattern of linkage disequilibrium within the centromeric B haplotype is observed in some African populations. While in most African and other HGDP-CEPH populations KIR2DS3 is associated with the Cen-B1 motif, three populations, the San, Biaka Pygmy, and Mbuti Pygmy populations are observed to have Cen-B1 haplotypes containing the KIR2DS5 allele (Fig. 5c, d). This is evidenced by the much higher frequency of KIR2DS5 in these three populations relative to other African populations, in whom the frequency of KIR2DS5 and the remaining telomeric B haplotype genes (KIR3DS1 and KIR2DS1) with which it is generally associated are extremely low. Additionally, the less common Cen-B3 motif, which appears to be a fusion between Cen-A and Cen-B1, and is characterized by the presence of KIR2DL3, KIR2DL5, KIR2DS3S5, and KIR2DP1, is observed at very high frequencies in the two pygmy populations (Fig. 5h), and in these populations, this haplotype always includes the KIR2DS5 allele.
In contrast, KIR2DS5 is almost always observed in Amerindian populations regardless of whether the locus is centromeric or telomeric in the KIR gene cluster. Examination of the frequency distribution for KIR2DS3S5 in Amerindian populations reveals that KIR2DS3 is completely absent in all but one population, the Maya; significantly, previous work has suggested Caucasian admixture in this particular population sample (Rosenberg et al. 2002). While Amerindian populations have both the centromeric (Cen-B1) and telomeric (Tel-B) haplotypic motifs that contain this locus, in nearly all cases only the KIR2DS5 allele is present.
While the full-length motif Cen-B1 is very common worldwide, the much shorter Cen-B2 appears to be distributed somewhat sporadically across several world regions. The extended haplotype bearing CenB2 ~ TelB is observed primarily outside of Africa, and this motif largely replaces Cen-B1 in some populations outside of Africa; however, there is no clear pattern or gradient associated with this motif. Again, the less common Cen-B3 is primarily limited to African populations, where as expected substantially greater haplotypic diversity is observed relative to other world regions.
In contrast to the centromeric KIR, the telomeric interval shows a pattern of variation worldwide that generally mirrors human population differentiation. As noted above, two common gene content motifs, Tel-A and Tel-B (Fig. 1), corresponding to the telomeric A and B haplotype, respectively, are observed in most human populations. The telomeric B haplotype loci, marked by KIR3DS1, are in strong linkage disequilibrium, with KIR3DS1, KIR2DL5, KIR2DS3S5, and KIR2DS1 most often observed as a haplotypic block. While there is a gradient in Tel-B frequencies and a positive correlation (r = 0.49) between KIR3DS1 carrier frequencies with distance from Africa (Fig. 6), comparison with data from autosomal markers (Conrad et al. 2006) which reflect demographic history, reveals that while this correlation falls on the upper end of the distribution observed for autosomal SNPs, it is not significantly different from the SNP results (p emp = 0.20).
Fig. 6.
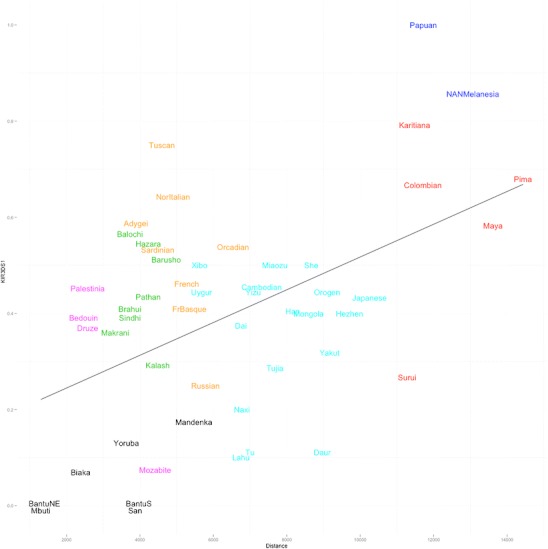
Correlation between KIR3DS1 frequencies with distance from Africa. Distance from Africa is plotted along the x-axis and KIR3DS1 frequencies along the y-axis. A regression line for the data is shown (r = 0.49). Populations are colored according to world region: Africa = black; Middle East = magenta; Europe = yellow; Central Asia = green; East Asia = cyan; Amerindian = red; Oceania = blue
Differentiation of the KIR loci within and between populations and world regions
In general, the centromeric haplotypes are marked by the KIR2DL2L3 locus, and the telomeric haplotypes are marked by the KIR3DL1S1 locus. As gene frequencies give a better view of genetic differentiation than carrier frequencies, we focused on these loci, assuming that the gene frequencies we obtain via direct counting will in general have less missing data regarding gene content on the second chromosome. While there are clear limitations to this assumption (due to genotypes in some populations with deletion of the KIR3DL1S1 locus) as noted in the “Materials and methods” section, we determined that genotypes with this deletion are not common in most populations in our sample. Analysis of KIR3DL1S1 carrier status in our sample set reveals that only one individual out of 976 tested in the panel has a negative carrier status for both KIR3DL1 and KIR3DS1, i.e., is homozygous for the deletion in a previously unreported genotype (Fig. 2). While it is likely that there are individuals in our sample who are heterozygous with the deletion on one chromosome masked by the other, the lack of more than one deletion homozygote suggests a rarity that we felt would not excessively skew our frequency calculations.
Genetic distances calculated from these gene frequencies for KIR2DL2L3 and KIR3DL1S1 are given in Supplemental Table 1. In general, genetic distances based on both KIR loci are greater between continents than those between populations within continents, and distances increase with increasing geographical distance from Africa. Examination of the partitioning of genetic variation for each KIR region (Table 4) and comparison with data from other autosomal markers (Conrad et al. 2006) reveal that high levels of between-population variation are observed for the centromeric B haplotype locus KIR2DL2L3 relative to other autosomal markers within world regions. The telomeric B haplotype marker KIR3DL1S1, on the other hand, varies more substantially between regions. The very minimal differentiation at KIR3DL1S1 between populations within major world regions (FST = 0.002) is an order of magnitude lower than that which is observed for autosomal markers genome-wide; comparison with FST value SNPs from the HGDP-CEPH database suggests that this FST value is lower than expectations due to chance alone (p emp < 0.05), suggesting a history of balancing selection on the locus.
Table 4.
FST values for selected centromeric and telomeric KIR loci and autosomal SNPs (Conrad et al. 2006) in the HGDP-CEPH
| KIR2DL2L3 | KIR3DL1S1 | Autosomal SNPs | |
|---|---|---|---|
| Within populations | 0.926 | 0.896 | 0.890 |
| Between populations | 0.024 | 0.002 | 0.020 |
| Between regions | 0.050 | 0.102 | 0.090 |
Discussion
KIR diversity within populations is maintained by variation in gene content, and KIR differentiation between populations can be attributed in large part to frequency variation in common, shared haplotypes; this is evidenced by the fact that in most world regions, six genotypes account for the vast majority of observed variation. Nevertheless, numerous other genotypes are observed to varying degrees, highlighting the great degree of plasticity and potential for variation in gene content within the KIR cluster. Moreover, the distribution of genotypes in several populations is characterized by the virtual absence of the more common genotypes, suggesting that they are not requisite at the individual or population level.
Particularly striking is the fact that in three population samples in this panel (the two Oceanic populations NAN Melanesian and Papua New Guinea, and the African San), we did not find any individuals bearing the most common KIR genotype worldwide, which corresponds to homozygosity for the canonical A haplotype. The extreme examples of the Oceanic populations and the San are representative of a general trend towards region-specific gene content diversity, coupled with higher overall carrier frequencies of some or all stimulatory KIR; these populations occupying the more extreme ends of the spectrum of genetic divergence, specifically the (earliest diverged) African populations and the (most recently diverged) Amerindian and Oceanic populations, generally mirror patterns observed genome-wide (Rosenberg et al. 2002). While geographically and evolutionarily highly divergent, these populations share a history of genetic isolation coupled with small effective population size, suggesting a strong influence of genetic drift in the generation of the less common gene content haplotypes. This is highlighted by the presence of a previously unreported genotype in the Orcadian (Scotland) population; while KIR genotypes in European populations generally have common KIR types, the Orcadian population is particularly isolated relative to the remainder of the continent. Within Oceania, the six most common KIR genotypes account for a mere 16 % of the total observed genotypes, compared to greater than 50 % in all other world regions. The NAN Melanesian population in particular is astonishingly diverse, with 15 unique haplotypes detected in a sample of only 21 individuals. Variation specific to the centromeric and telomeric regions of the KIR haplotype in the African and Amerindian populations is responsible for the delineation of discrete clades upon clustering by carrier frequencies, and while the Amerindian populations do not exhibit exceptionally high levels of genotypic diversity, they display distinctive patterns unique to the region. In general, patterns of variation in these highly divergent populations are simply the most extreme examples of more general worldwide trends with regard to KIR gene content.
While KIR genotypic variation in the HGDP-CEPH closely aligns with that reported in other population studies, analysis of KIR frequencies within the panel reveals novel observations and permits a more detailed understanding of particular region-specific and worldwide patterns. As previously noted, the stimulatory KIR3DS1 and KIR2DS1 are present at much lower frequencies in African populations (Single et al. 2007a; Hollenbach et al. 2010). As a result, the extensive variation and high frequency of KIR B haplotypes observed within Africa is defined by higher frequencies of stimulatory loci within the centromeric KIR, and gene content variation within the Cen-B1 haplotype is responsible for several of the less common genotypes observed within Africa.
Of particular note is the presence of KIR2DS5 on the Cen-B1 haplotype within Africa. While KIR2DS5 is known to be an allele of a duplicated locus observed within both the centromeric and telomeric KIR haplotype (Ordonez et al. 2008), within Africa, it is most often observed in association with the centromeric KIR loci; in the remainder of world populations (with the exception of Amerindian populations), the KIR2DS3 allele is much more likely to be present on the centromeric haplotype. While previous work has suggested that either allele may have originated on Cen-B1 (Pyo et al. 2010), our data point to an early appearance of KIR2DS5 in Africa on this section of the KIR haplotype. The San, Biaka Pygmy, and Mbuti Pygmy populations, in whom KIR2DS5 is observed at very high frequencies on Cen-B1, are those that have been previously identified as the earliest diverged human populations in the HGDP-CEPH and, due to their long history of genetic isolation, may have maintained a vestigial allelic state on Cen-B1. Several explanations have been postulated for the history of the duplication of this locus in the KIR cluster (Kelley et al. 2005; Pyo et al. 2010); however, the appearance of the telomeric B haplotype bearing KIR2DS5 in populations primarily outside of Africa suggests duplication of the locus prior to the appearance of KIR2DS3. Subsequent replacement of KIR2DS5 on Cen-B1 by KIR2DS3 suggests a selective advantage either of KIR2DS3 specifically in this position or the extended haplotype on which it resides, in most world populations. Further, the very high frequency of Cen-B3 bearing KIR2DS5 in the pygmy populations points to an early appearance of this haplotype, and it is possible that this represents a transitional haplotype between Cen-A and Cen-B1.
Outside of Africa, this pattern of linkage disequilibrium placing KIR2DS5 within the centromeric B haplotype is most often observed in Amerindian populations, where KIR2DS3 is almost entirely absent. In addition, the truncated Cen-B2 haplotype, which lacks entirely the KIR2DS3S5 locus, is observed at the highest frequencies worldwide in the Amerindian populations. The fact that KIR2DS3 is observed at moderate frequencies in East Asian populations suggests that subsequent to New World migration and divergence of Amerindian populations, a selective event or population bottleneck resulted in the loss of KIR2DS3. While the high frequency of Cen-B2 could be explained by either evolutionary event, the fixation of the KIR2DS5 allele at the KIR2DS3S5 locus, particularly when found within the centromeric region (where most world populations bear KIR2DS3), suggests negative selection on KIR2DS3 in Amerindians.
Further analysis of frequency distributions for the centromeric KIR reveals that in most populations there is a very even balance between the inhibitory A haplotypic structure and the more stimulatory B haplotype, except within East Asia, where Cen-A predominates. These data are suggestive of a selective sweep within the centromeric KIR in East Asian populations, resulting in near fixation of the Cen-A motif. Previous work in the HGDP-CEPH and HapMap populations has suggested that recent sweeps of this nature have been relatively common in East Asia, compared to other world populations (Lee et al. 2010). This pattern, in combination with that observed in the Amerindians, as well as overall greater within- and between-population variation and higher heterozygosity for the centromeric loci, implies that the centromeric section of the KIR cluster has been repeatedly subjected to purifying selection or population bottlenecks throughout human population differentiation.
While present only at very low frequencies in African populations, the telomeric B haplotype loci are seen at increasing frequencies in populations outside of Africa, with a positive correlation of KIR3DS1 frequencies with distance from Africa, as noted previously (Single et al. 2007a, b). These frequencies tend to vary significantly between world regions but very little within regions, as evidenced by very low between-population FST values. Geographic clines like that observed for the Tel-B loci can be observed throughout the genome and may be related to a form of genetic drift, “allele-surfing”, in which a low-frequency allele can ride the “wave” of population expansion at the interface of a recent migratory event to obtain a higher frequency in the secondary population. While comparison with neutral markers in these populations does not give clear evidence for selection, this does not rule out selective processes for these alleles. Population studies with larger sample sizes will help to refine these results. Lee et al. (2010), in analyzing FST values for putatively selected variants in the HGDP-CEPH and HapMap populations at various geographic scales, noted that neutral processes related to population history and human migrations powerfully influence the frequencies of even selected alleles and may mitigate the effects of selection to an extent. Regardless, the trend toward increasing frequency for Tel-B, coupled with strong linkage disequilibrium and extremely low FST values, suggests ongoing balancing selection on the telomeric KIR, in keeping with previous data for sequence level variation in KIR3DL1S1 (Norman et al. 2007). In addition, our analysis of KIR genotypes and other previous work (Middleton et al. 2007b) has shown that the region of the telomeric KIR including KIR3DL1S1 appears to be particularly prone to deletion (and likely duplication) events, contributing substantially to gene content variation. In the HGDP-CEPH populations outside of Africa, most notably the Oceanic and Amerindian populations, we observed extensive variation in gene content in the telomeric KIR, further supporting the notion of balancing, or diversifying selection on this section of the KIR.
In conclusion, analysis of our data for the KIR in the HGDP-CEPH reveals significant evidence for balancing, diversifying selection within the telomeric region, and purifying selection and/or a history of population bottlenecks within the centromeric region, in general accordance with recent work showing different evolutionary histories for the centromeric and telomeric KIR (Pyo et al. 2010). In every major world region, while the majority of KIR variation in many populations can be attributed to six common gene content profiles, numerous other genotypes are observed worldwide to varying degrees, with the most isolated and diverged populations exhibiting the most divergent KIR profiles. Although the ubiquity of the common KIR genotypes, and in particular the KIR A haplotype, suggests selection for these common types, the fact that we observed three populations lacking A/A homozygous individuals suggests that a high frequency of the A haplotypes is not necessarily requisite in a population. The most extreme variation in B haplotype gene content in populations likely to have been subject to strong genetic drift suggests recent and frequent recombination, with duplication and deletion events magnified by that drift. However, extensive variation was observed in populations worldwide, with previously unreported genotypes observed in populations from four of the seven world regions examined, emphasizing the continuing potential for diversification in the KIR region in human populations.
Electronic supplementary material
Below is the link to the electronic supplementary material.
(DOC 288 kb)
Acknowledgments
The authors would like to thank Dr. Howard M. Cann at the CEPH in Paris and Drs. Henry A. Erlich and Steven J. Mack at CHORI for their assistance accessing the HGDP-CEPH samples. This work was supported by a grant from the NIH NIAIDS (5 UO1 AI067068 Trachtenberg) and the My Brother Joey Foundation, USA (Trachtenberg). We thank Drs. Mark Stoneking and Pierre-Antoine Gourraud for helpful discussion and advice.
Conflict of interest
The authors declare no conflict of interest.
Open Access
This article is distributed under the terms of the Creative Commons Attribution License which permits any use, distribution, and reproduction in any medium, provided the original author(s) and the source are credited.
Contributor Information
Jill A. Hollenbach, Email: jhollenbach@chori.org
Elizabeth A. Trachtenberg, Email: etrachtenberg@chori.org
References
- Bashirova AA, Martin MP, McVicar DW, Carrington M. The killer immunoglobulin-like receptor gene cluster: tuning the genome for defense. Annu Rev Genomics Hum Genet. 2006;7:277–300. doi: 10.1146/annurev.genom.7.080505.115726. [DOI] [PubMed] [Google Scholar]
- Biron CA. Activation and function of natural killer cell responses during viral infections. Curr Opin Immunol. 1997;9(1):24–34. doi: 10.1016/S0952-7915(97)80155-0. [DOI] [PubMed] [Google Scholar]
- Canavez F, Young NT, Guethlein LA, Rajalingam R, Khakoo SI, Shum BP, Parham P. Comparison of chimpanzee and human leukocyte Ig-like receptor genes reveals framework and rapidly evolving genes. J Immunol. 2001;167(10):5786–5794. doi: 10.4049/jimmunol.167.10.5786. [DOI] [PubMed] [Google Scholar]
- Cann HM, de Toma C, Cazes L, Legrand MF, Morel V, Piouffre L, Bodmer J, Bodmer WF, Bonne-Tamir B, Cambon-Thomsen A, Chen Z, Chu J, Carcassi C, Contu L, Du R, Excoffier L, Ferrara GB, Friedlaender JS, Groot H, Gurwitz D, Jenkins T, Herrera RJ, Huang X, Kidd J, Kidd KK, Langaney A, Lin AA, Mehdi SQ, Parham P, Piazza A, Pistillo MP, Qian Y, Shu Q, Xu J, Zhu S, Weber JL, Greely HT, Feldman MW, Thomas G, Dausset J, Cavalli-Sforza LL. A human genome diversity cell line panel. Science. 2002;296(5566):261–262. doi: 10.1126/science.296.5566.261b. [DOI] [PubMed] [Google Scholar]
- Conrad DF, Jakobsson M, Coop G, Wen X, Wall JD, Rosenberg NA, Pritchard JK. A worldwide survey of haplotype variation and linkage disequilibrium in the human genome. Nat Genet. 2006;38(11):1251–1260. doi: 10.1038/ng1911. [DOI] [PubMed] [Google Scholar]
- Cooley S, Trachtenberg E, Bergemann TL, Saeteurn K, Klein J, Le CT, Marsh SG, Guethlein LA, Parham P, Miller JS, Weisdorf DJ. Donors with group B KIR haplotypes improve relapse-free survival after unrelated hematopoietic cell transplantation for acute myelogenous leukemia. Blood. 2009;113(3):726–732. doi: 10.1182/blood-2008-07-171926. [DOI] [PMC free article] [PubMed] [Google Scholar]
- Cooley S, Weisdorf DJ, Guethlein LA, Klein JP, Wang T, Le CT, Marsh SG, Geraghty D, Spellman S, Haagenson MD, Ladner M, Trachtenberg E, Parham P, Miller JS. Donor selection for natural killer cell receptor genes leads to superior survival after unrelated transplantation for acute myelogenous leukemia. Blood. 2010;116(14):2411–2419. doi: 10.1182/blood-2010-05-283051. [DOI] [PMC free article] [PubMed] [Google Scholar]
- Gourraud PA, Gagne K, Bignon JD, Cambon-Thomsen A, Middleton D. Preliminary analysis of a KIR haplotype estimation algorithm: a simulation study. Tissue Antigens. 2007;69(Suppl 1):96–100. doi: 10.1111/j.1399-0039.2006.762_4.x. [DOI] [PubMed] [Google Scholar]
- Gourraud PA, Meenagh A, Cambon-Thomsen A, Middleton D. Linkage disequilibrium organization of the human KIR superlocus: implications for KIR data analyses. Immunogenetics. 2010;62:729–740. doi: 10.1007/s00251-010-0478-4. [DOI] [PMC free article] [PubMed] [Google Scholar]
- Guethlein LA, Older Aguilar AM, Abi-Rached L, Parham P. Evolution of killer cell Ig-like receptor (KIR) genes: definition of an orangutan KIR haplotype reveals expansion of lineage III KIR associated with the emergence of MHC-C. J Immunol. 2007;179(1):491–504. doi: 10.4049/jimmunol.179.1.491. [DOI] [PubMed] [Google Scholar]
- Hiby SE, Walker JJ, O'shaughnessy KM, Redman CW, Carrington M, Trowsdale J, Moffett A. Combinations of maternal KIR and fetal HLA-C genes influence the risk of preeclampsia and reproductive success. J Exp Med. 2004;200(8):957–965. doi: 10.1084/jem.20041214. [DOI] [PMC free article] [PubMed] [Google Scholar]
- Hollenbach JA, Ladner MB, Saeteurn K, Taylor KD, Mei L, Haritunians T, McGovern DP, Erlich HA, Rotter JI, Trachtenberg EA. Susceptibility to Crohn's disease is mediated by KIR2DL2/KIR2DL3 heterozygosity and the HLA-C ligand. Immunogenetics. 2009;61(10):663–671. doi: 10.1007/s00251-009-0396-5. [DOI] [PMC free article] [PubMed] [Google Scholar]
- Hollenbach JA, Meenagh A, Sleator C, Alaez C, Bengoche M, Canossi A, Contreras G, Creary L, Evseeva I, Gorodezky C, Hardie RA, Hemming Karlsen T, Lie B, Luo M, Martinetti M, Navarette C, de Oliveira DC, Ozzella G, Pasi A, Pavlova E, Pinto S, Porto LC, Santos P, Slavcev A, Srinak D, Tavoularis S, Tonks S, Trachtenberg E, Vejbaesya S, Middleton D. Report from the killer immunoglobulin-like receptor (KIR) anthropology component of the 15th International Histocompatibility Workshop: worldwide variation in the KIR loci and further evidence for the co-evolution of KIR and HLA. Tissue Antigens. 2010;76(1):9–17. doi: 10.1111/j.1399-0039.2010.01459.x. [DOI] [PubMed] [Google Scholar]
- Houtchens KA, Nichols RJ, Ladner MB, Boal HE, Sollars C, Geraghty DE, Davis LM, Parham P, Trachtenberg EA. High-throughput killer cell immunoglobulin-like receptor genotyping by MALDI-TOF mass spectrometry with discovery of novel alleles. Immunogenetics. 2007;59(7):525–537. doi: 10.1007/s00251-007-0222-x. [DOI] [PMC free article] [PubMed] [Google Scholar]
- Hsu K. 13th IHWS NK/KIR Joint Report. HLA 2004: Immunobiology of the human MHC. Seattle: IHWG; 2004. [Google Scholar]
- Hsu KC, Chida S, Dupont B, Geraghty DE. The killer cell immunoglobulin-like receptor (KIR) genomic region: gene-order, haplotypes and allelic polymorphism. Immunol Rev. 2002;190:40–52. doi: 10.1034/j.1600-065X.2002.19004.x. [DOI] [PubMed] [Google Scholar]
- Kelley J, Walter L, Trowsdale J. Comparative genomics of natural killer cell receptor gene clusters. PLoS Genet. 2005;1(2):129–139. doi: 10.1371/journal.pgen.0010027. [DOI] [PMC free article] [PubMed] [Google Scholar]
- Khakoo SI, Carrington M. KIR and disease: a model system or system of models? Immunol Rev. 2006;214:186–201. doi: 10.1111/j.1600-065X.2006.00459.x. [DOI] [PubMed] [Google Scholar]
- Khakoo SI, Rajalingam R, Shum BP, Weidenbach K, Flodin L, Muir DG, Canavez F, Cooper SL, Valiante NM, Lanier LL, Parham P. Rapid evolution of NK cell receptor systems demonstrated by comparison of chimpanzees and humans. Immunity. 2000;12(6):687–698. doi: 10.1016/S1074-7613(00)80219-8. [DOI] [PubMed] [Google Scholar]
- Khakoo SI, Thio CL, Martin MP, Brooks CR, Gao X, Astemborski J, Cheng J, Goedert JJ, Vlahov D, Hilgartner M, Cox S, Little AM, Alexander GJ, Cramp ME, O'Brien SJ, Rosenberg WM, Thomas DL, Carrington M. HLA and NK cell inhibitory receptor genes in resolving hepatitis C virus infection. Science. 2004;305(5685):872–874. doi: 10.1126/science.1097670. [DOI] [PubMed] [Google Scholar]
- Kunert K, Seiler M, Mashreghi MF, Klippert K, Schonemann C, Neumann K, Pratschke J, Reinke P, Volk HD, Kotsch K. KIR/HLA ligand incompatibility in kidney transplantation. Transplantation. 2007;84(11):1527–1533. doi: 10.1097/01.tp.0000290681.41859.41. [DOI] [PubMed] [Google Scholar]
- Lanier LL. Natural killer cells fertile with receptors for HLA-G? Proc Natl Acad Sci USA. 1999;96(10):5343–5345. doi: 10.1073/pnas.96.10.5343. [DOI] [PMC free article] [PubMed] [Google Scholar]
- Lee YL, Teitelbaum S, Wolff MS, Wetmur JG, Chen J. Comparing genetic ancestry and self-reported race/ethnicity in a multiethnic population in New York City. J Genet. 2010;89(4):417–423. doi: 10.1007/s12041-010-0060-8. [DOI] [PMC free article] [PubMed] [Google Scholar]
- Li Y, Zhang T, Ho C, Orange JS, Douglas SD, Ho WZ. Natural killer cells inhibit hepatitis C virus expression. J Leukoc Biol. 2004;76(6):1171–1179. doi: 10.1189/jlb.0604372. [DOI] [PubMed] [Google Scholar]
- Lynch M, Milligan BG. Analysis of population genetic structure with RAPD markers. Mol Ecol. 1994;3(2):91–99. doi: 10.1111/j.1365-294X.1994.tb00109.x. [DOI] [PubMed] [Google Scholar]
- Martin AM, Kulski JK, Gaudieri S, Witt CS, Freitas EM, Trowsdale J, Christiansen FT. Comparative genomic analysis, diversity and evolution of two KIR haplotypes A and B. Gene. 2004;335:121–131. doi: 10.1016/j.gene.2004.03.018. [DOI] [PubMed] [Google Scholar]
- Martin MP, Qi Y, Gao X, Yamada E, Martin JN, Pereyra F, Colombo S, Brown EB, Schupert WL, Phair J, Goedert JJ, Buchbinder S, Kirk GD, Telenti A, Connors M, O'Brien SJ, Walker BD, Parham P, Deeks SG, McVicar DW, Carrington M. Innate partnership of HLA-B and KIR3DL1 subtypes against HIV-1. Nat Genet. 2007;39(6):733–740. doi: 10.1038/ng2035. [DOI] [PMC free article] [PubMed] [Google Scholar]
- Meyer D, Single RM, Mack SJ, Erlich HA, Thomson G. Signatures of demographic history and natural selection in the human major histocompatibility complex Loci. Genetics. 2006;173(4):2121–2142. doi: 10.1534/genetics.105.052837. [DOI] [PMC free article] [PubMed] [Google Scholar]
- Middleton D, Gonzalez A, Gilmore PM. Studies on the expression of the deleted KIR2DS4*003 gene product and distribution of KIR2DS4 deleted and nondeleted versions in different populations. Hum Immunol. 2007;68(2):128–134. doi: 10.1016/j.humimm.2006.12.007. [DOI] [PubMed] [Google Scholar]
- Middleton D, Meenagh A, Gourraud PA. KIR haplotype content at the allele level in 77 Northern Irish families. Immunogenetics. 2007;59(2):145–158. doi: 10.1007/s00251-006-0181-7. [DOI] [PubMed] [Google Scholar]
- Moffett A, Hiby SE. How does the maternal immune system contribute to the development of pre-eclampsia? Placenta. 2007;28(Suppl A):S51–S56. doi: 10.1016/j.placenta.2006.11.008. [DOI] [PubMed] [Google Scholar]
- Moffett-King A. Natural killer cells and pregnancy. Nat Rev Immunol. 2002;2(9):656–663. doi: 10.1038/nri886. [DOI] [PubMed] [Google Scholar]
- Nei M. Molecular evolutionary genetics. New York: Columbia University Press; 1987. [Google Scholar]
- Norman PJ, Abi-Rached L, Gendzekhadze K, Korbel D, Gleimer M, Rowley D, Bruno D, Carrington CV, Chandanayingyong D, Chang YH, Crespi C, Saruhan-Direskeneli G, Fraser PA, Hameed K, Kamkamidze G, Koram KA, Layrisse Z, Matamoros N, Mila J, Park MH, Pitchappan RM, Ramdath DD, Shiau MY, Stephens HA, Struik S, Verity DH, Vaughan RW, Tyan D, Davis RW, Riley EM, Ronaghi M, Parham P. Unusual selection on the KIR3DL1/S1 natural killer cell receptor in Africans. Nat Genet. 2007;39(9):1092–1099. doi: 10.1038/ng2111. [DOI] [PubMed] [Google Scholar]
- Ordonez D, Meenagh A, Gomez-Lozano N, Castano J, Middleton D, Vilches C. Duplication, mutation and recombination of the human orphan gene KIR2DS3 contribute to the diversity of KIR haplotypes. Genes Immun. 2008;9(5):431–437. doi: 10.1038/gene.2008.34. [DOI] [PubMed] [Google Scholar]
- Parham P. MHC class I molecules and KIRs in human history, health and survival. Nat Rev Immunol. 2005;5(3):201–214. doi: 10.1038/nri1570. [DOI] [PubMed] [Google Scholar]
- Peakall R, Smouse PE. GENALEX 6: genetic analysis in Excel. Population genetic software for teaching and research. Molecular Ecology Notes. 2006;6:288–295. doi: 10.1111/j.1471-8286.2005.01155.x. [DOI] [PMC free article] [PubMed] [Google Scholar]
- Pyo CW, Guethlein LA, Vu Q, Wang R, Abi-Rached L, Norman PJ, Marsh SG, Miller JS, Parham P, Geraghty DE. Different patterns of evolution in the centromeric and telomeric regions of group A and B haplotypes of the human killer cell Ig-like receptor locus. PLoS One. 2010;5(12):e15115. doi: 10.1371/journal.pone.0015115. [DOI] [PMC free article] [PubMed] [Google Scholar]
- R Development Core Team . R: a language and environment for statistical computing. Vienna: R Foundation for Statistical Computing; 2008. [Google Scholar]
- Rosenberg NA, Pritchard JK, Weber JL, Cann HM, Kidd KK, Zhivotovsky LA, Feldman MW. Genetic structure of human populations. Science. 2002;298(5602):2381–2385. doi: 10.1126/science.1078311. [DOI] [PubMed] [Google Scholar]
- Ruggeri L, Capanni M, Urbani E, Perruccio K, Shlomchik WD, Tosti A, Posati S, Rogaia D, Frassoni F, Aversa F, Martelli MF, Velardi A. Effectiveness of donor natural killer cell alloreactivity in mismatched hematopoietic transplants. Science. 2002;295(5562):2097–2100. doi: 10.1126/science.1068440. [DOI] [PubMed] [Google Scholar]
- Single RM, Martin MP, Gao X, Meyer D, Yeager M, Kidd J, Kidd KK, Carrington M. Global diversity and evidence for co-evolution of KIR and HLA genes. Nature Genet. 2007;39(9):1114–1119. doi: 10.1038/ng2077. [DOI] [PubMed] [Google Scholar]
- Single RM, Martin MP, Gao X, Meyer D, Yeager M, Kidd JR, Kidd KK, Carrington M. Global diversity and evidence for coevolution of KIR and HLA. Nat Genet. 2007;39(9):1114–1119. doi: 10.1038/ng2077. [DOI] [PubMed] [Google Scholar]
- Single RM, Martin MP, Meyer D, Gao X, Carrington M. Methods for assessing gene content diversity of KIR with examples from a global set of populations. Immunogenetics. 2008;60(12):711–725. doi: 10.1007/s00251-008-0331-1. [DOI] [PMC free article] [PubMed] [Google Scholar]
- Smith W, Wessel P. Gridding with continuous curvature splines in tension. Geophysics. 1990;55:293–305. doi: 10.1190/1.1442837. [DOI] [Google Scholar]
- Smyth MJ, Cretney E, Kelly JM, Westwood JA, Street SE, Yagita H, Takeda K, van Dommelen SL, Degli-Esposti MA, Hayakawa Y. Activation of NK cell cytotoxicity. Mol Immunol. 2005;42(4):501–510. doi: 10.1016/j.molimm.2004.07.034. [DOI] [PubMed] [Google Scholar]
- Tennekes M (2010) treemap: treemap visualization. R package version 1.0-4. http://cran.r-project.org/web/packages/treemap/treemap.pdf. Accessed Oct 2011
- Trowsdale J. Genetic and functional relationships between MHC and NK receptor genes. Immunity. 2001;15(3):363–374. doi: 10.1016/S1074-7613(01)00197-2. [DOI] [PubMed] [Google Scholar]
- Trowsdale J, Parham P. Mini-review: defense strategies and immunity-related genes. Eur J Immunol. 2004;34(1):7–17. doi: 10.1002/eji.200324693. [DOI] [PubMed] [Google Scholar]
- Uhrberg M, Parham P, Wernet P. Definition of gene content for nine common group B haplotypes of the Caucasoid population: KIR haplotypes contain between seven and eleven KIR genes. Immunogenetics. 2002;54(4):221–229. doi: 10.1007/s00251-002-0463-7. [DOI] [PubMed] [Google Scholar]
- Vales-Gomez M, Reyburn HT, Mandelboim M, Strominger JL. Kinetics of interaction of HLA-C ligands with natural killer cell inhibitory receptors. Immunity. 1998;9(3):337–344. doi: 10.1016/S1074-7613(00)80616-0. [DOI] [PubMed] [Google Scholar]
- Vilches C, Parham P. KIR: diverse, rapidly evolving receptors of innate and adaptive immunity. Annu Rev Immunol. 2002;20:217–251. doi: 10.1146/annurev.immunol.20.092501.134942. [DOI] [PubMed] [Google Scholar]
- Wessel P, Smith WHF (1998) New, improved version of Generic Mapping tools released. EOS Trans Amer Geophys U 79:579
- Wickham H. ggplot2: elegant graphics for data analysis. New York: Springer; 2009. [Google Scholar]
- Williams F, Meenagh A, Sleator C, Cook D, Fernandez-Vina M, Bowcock AM, Middleton D. Activating killer cell immunoglobulin-like receptor gene KIR2DS1 is associated with psoriatic arthritis. Hum Immunol. 2005;66(7):836–841. doi: 10.1016/j.humimm.2005.04.005. [DOI] [PubMed] [Google Scholar]
- Young NT, Uhrberg M. KIR expression shapes cytotoxic repertoires: a developmental program of survival. Trends Immunol. 2002;23(2):71–75. doi: 10.1016/S1471-4906(01)02113-5. [DOI] [PubMed] [Google Scholar]
- Yoo Y, Kaslow R, Tang J, Zhang K (2007) Haplotype inference for present-absent genotype data for clustered genes using identified haplotypes and haplotype patterns. Bioinformatics (Oxford, England) 23(18):2399–2406 [DOI] [PubMed]
Associated Data
This section collects any data citations, data availability statements, or supplementary materials included in this article.
Supplementary Materials
(DOC 288 kb)