Abstract
With strong surface plasmons excited at the metallic tip, tip-enhanced Raman spectroscopy (TERS) has both high spectroscopic sensitivity and high spatial resolution, and is becoming an essential tool for chemical analysis. It is a great challenge to combine TERS with a high vacuum system due to the poor optical collection efficiency. We used our innovatively designed home-built high vacuum TERS (HV-TERS) to investigate the plasmon-driven in-situ chemical reaction of 4-nitrobenzenethiol dimerizing to dimercaptoazobenzene. The chemical reactions can be controlled by the plasmon intensity, which in turn can be controlled by the incident laser intensity, tunneling current and bias voltage. The temperature of such a chemical reaction can also be obtained by the clearly observed Stokes and Anti-Stokes HV-TERS peaks. Our findings offer a new way to design a highly efficient HV-TERS system and its applications to chemical catalysis and synthesis of molecules, and significantly extend the studies of chemical reactions.
Using a sharp metal tip as a controlled plasmon antenna to excite the localized surface plasmons and consequently enhance the electromagnetic field in the vicinity of the tip apex, tip-enhanced Raman spectroscopy (TERS) has become an essential analytical tool to give an extremely high optical sensitivity1,2,3,4,5,6,7,8. Moreover, since the enhanced Raman signals are from the very tiny tip area with the size of tens of nanometers, TERS can offer a nanoscale resolution beyond the diffraction limit of light as well. Since high vacuum can give a clean chemical environment useful for chemical analysis, it is essential to build up TERS in a high vacuum system to achieve a novel solution for chemical analysis. However, it is very challenging to combine the optics with high vacuum systems to achieve highly efficient illumination and collection of extremely weak Raman signals.
Recently, it was found that surface plasmons, which are collective oscillation of free electrons at a dielectric-metal interface9,10, play an important role in chemical reactions11,12,13,14,15,16,17,18,19,20,21,22,23,24, such as photochromic reactions11, polymerization12, isomerization13, dissociation14 and catalytic reactions15,16,17,18,19,20,21,22,23,24. Since the sharp metal tip in TERS can create a “hot site” to excite strong surface plasmon resonances at the tip, and both high spectroscopic sensitivity and nanoscale resolution can supply definitive in-situ spectroscopic evidences for chemical reactions, TERS can be an ideal tool to investigate and control plasmon-driven chemical reactions.
Results
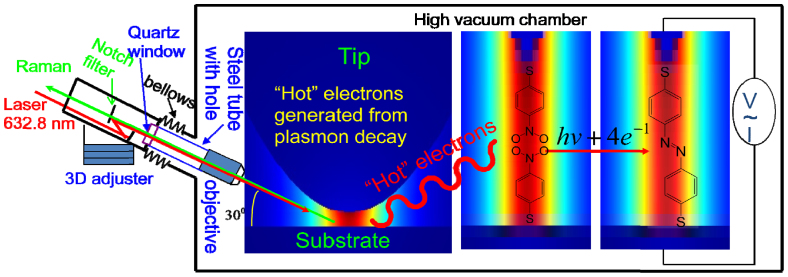
The design of HV-TERS is shown in Figure 1. The Raman optical system is connected to high vacuum by a stainless steel bellow valve, where a stainless steel tube was sealed inside the bellow with one end equipped with a quartz window to allow the light in and out of the high vacuum chamber, and the other end was equipped with a long working distance objective (NA = 0.5) to allow a highly efficient excitation and collection of weak Raman signals at the STM tip. The objective is in the high vacuum chamber, and the focus can be located in the nanogap in the tip-substrate junction. The outside of the bellow is fixed to the Raman probe equipped with two Notch filters to block the scattered light at the laser frequency. The Raman probe is mounted on a 3D adjuster equipped with piezo motor stages for optical fine-alignment.
Figure 1. The schematics of HV-TERS.
Plasmon-driven chemical reaction measured in HV-TERS.
By exploiting the advantages of our HV-TERS setup, we first measured HV-TERS of 4-nitrobenzenethiol (4NBT) adsorbed on a silver film (see Figure 2a and 2b) on the different bias voltage of −0.5 V and +0.5 V, respectively. For comparison, we also measured the normal Raman spectrum of 4NBT powder (see Figure 2c). It was found that the strongly enhanced Raman peaks are in the region of 1000 to 1700 cm−1, and the TERS spectrum is significantly different from the normal Raman spectrum of 4NBT in this region. Comparing Figure 2a and Figure 2b, we can see that both profiles are almost the same, which reveals that the polarity of voltage does not influence the TERS profile. Comparing Figure 2a–b with Figure 2c, we can see that the profiles are significantly different. The Raman intensity of −NO2 stretching mode of 4NBT at 1336 cm−1 in Figure 2c has almost disappeared in Figure 2a and 2b. Furthermore, the strongly enhanced Raman peaks at 1142, 1387 and 1432 cm−1 in Figure 2a and 2b cannot be observed in Figure 2c. We also found that these TERS are the same as the SERS spectra of dimercaptoazobenzene (DMAB) converted from p-aminothiophenol (PATP)15,16, and the Raman peaks in Figure 2a and 2b were assigned. The strongly enhanced vibrational mode of ag17 at 1432 cm−1 in Figure 2a and 2b is the -N = N- stretching vibrational mode of DMAB. So, DMAB cannot only be produced from PATP15,16, but also from 4NBT by a plasmon-driven surface catalyzed reaction. To further confirm that the measured TERS is DMAB converted from 4NBT, we compared HV-TERS (Figs. 2d and 2e) with normal Raman spectrum of 4NBT powder (Figure 2f) in the region of 700 to 1000 cm−1. It was found that the strong Raman peaks of 4NBT at 854 cm−1 in Figure 2f cannot be observed in the TERS in Figs. 2d and 2e, whereas several strongly enhanced TERS peaks in Figs. 2d and 2e cannot be observed in Figure 2f. Theoretical calculations revealed that there are four kinds of vibrational modes in this region. Raman-active ag modes (see Figure S1 in supplementary information) can be clearly observed in Figure 2d and 2e. Note the bg modes can also been observed in Figure 2d and 2e, though the simulation in Figure S1 is weak. It is worthwhile to note that the TERS peaks of DMAB on Ag films are so strongly enhanced that the very weak Raman peaks in the low Raman frequency region in the normal SERS can be clearly observed in more detail. The good agreement between the experiment and the simulated (ag modes) Raman spectra in the low frequency region provides additional spectroscopic evidence for the conversion of 4NBT to DMAB.
Figure 2. HV-TERS measurement of plasmon-driven chemical reaction.
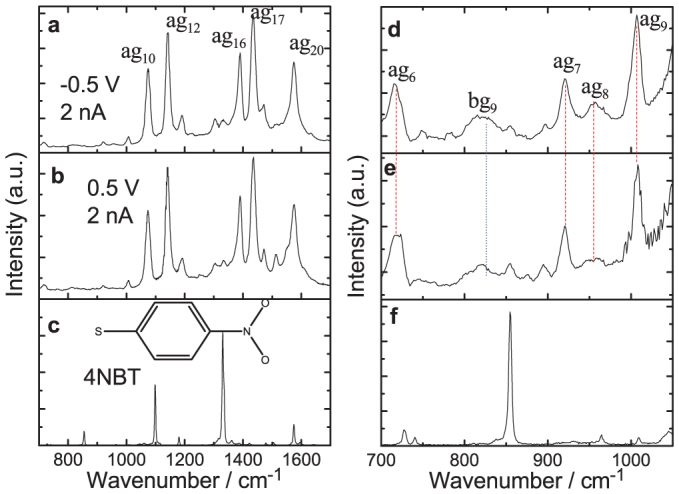
(a) and (b) the measured HV-TERS of DMAB in the region of 700 to 1700 cm−1, and (c) the normal Raman spectrum of 4NBT powder. (d)–(f) are the zoom-in spectra of (a)–(c) from 700 to 1050 cm−1.
With the advantage of our HV-TERS, we can perform in-situ measurements of plasmon-driven chemical reactions to observe how these occur. We measured Raman spectra of 4NBT in the HV-TERS system with different incident laser power. Figure 3a is the TERS of 4NBT at low laser power (0.5% or ~10 μW at the sample); three main peak positions of the measured TERS above 1000 cm−1 are the same as the normal Raman spectrum of 4NBT powder in Figure 2c. With the increase of the incident laser intensity, we found that there was almost no change of the TERS peaks below 3% of laser intensity (see Figure 3b). When the laser intensity is larger than 3%, the measured TERS revealed that 4NBT molecules can be gradually dimerized to DMAB. Figure 3c is the TERS at 10% of laser intensity. It is found that the 4NBT and DMAB coexist, since the fingerprint vibrational peak of 4NBT at 1336 cm−1 for the −NO2 stretching mode of 4NBT (Figure S2 in supplementary information) still exists, but decreases relative to the peak at 1575 cm−1 of benzene ring stretching vibration with the increase of the laser intensity. When the laser intensity is increased to 100%, almost all 4NBT molecules were dimerized to DMAB, since the vibrational peak of 4NBT at 1336 cm−1 almost totally disappeared (see Figure 3d). Figure 3e shows the measured TERS with low laser power, again the same as that in Figure 3a; it is found that the TERS profile in Figure 3e is identical as that in Figure 3d, except for the difference of the Raman intensity, while not back to Figure 3a. Figure 3d and 3e clearly revealed that this chemical reaction of dimerization really happened.
Figure 3. Laser intensity controlled dynamics of plasmon-driven chemical reactions.
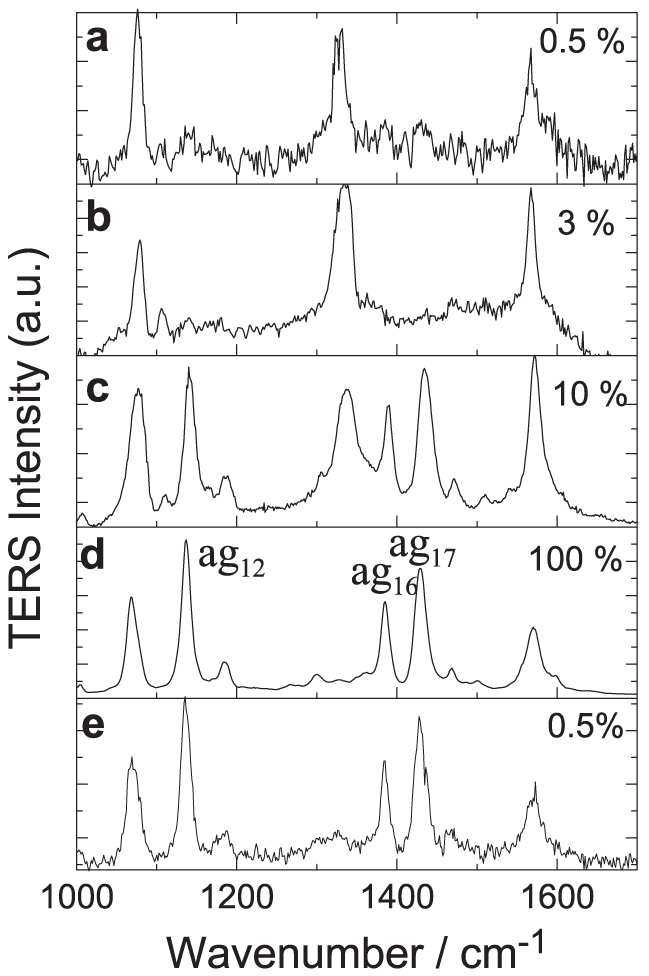
Laser power at (a) 0.5%, (b) 3%, (c) 10%, (d) 100% and (e) 0.5% at bias voltage 1 V, and current 1 nA. The vibrational modes of ag12, ag16 and ag17 for DMAB were assigned in (d).
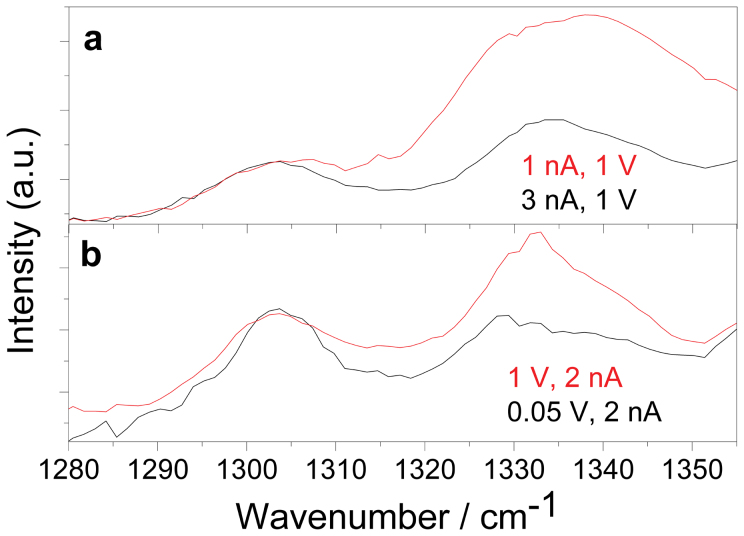
In our HV-TERS system, we can control the tunneling current and bias voltage to change the distance between the metallic tip and the substrate, thus change the local electromagnetic field enhancement. The influences of the control of the tunneling current and bias voltage should somehow be equal to the change of the incident laser intensity. Figure 4a revealed that with an increase of the tunneling current at a constant bias voltage, resulting in a decrease of the distance between the tip and the substrate, the Raman peak at 1336 cm−1 decreases. The decrease of the gap distance can increase the local electromagnetic field, and excite stronger surface plasmon resonances at the metallic tip region8. Similar to the increase of the incident laser intensity, more dimerization conversions of 4NBT to DMAB assisted by stronger plasmon resonances can be obtained. Meanwhile, less 4NBT remaining results in the decrease of the fingerprint Raman peak at 1336 cm−1, as observed. It should be noted that the increase of the tunneling current could also promote the chemical reaction, since the chemical bonds could be selectively broken or formed by the tunneling electron current only25. But as indicated in Figure 3a, no obvious chemical reaction is observed at a low laser power for a long time illumination at a rather significant tunneling current in the order of nA, which indicates the contribution from the tunneling current would be ignored for our case here. Similarly, we measured voltage dependent TERS when the current is fixed to 2 nA. From Figure 4b, as we can see, with the decrease of the bias voltage, the Raman peak at 1336 cm−1 decreases for the same reason as for the current dependence. Since the distance between the tip and the substrate decreases due to the decreased bias voltage, the plasmon resonances become stronger. The stronger the surface plasmon resonances, the more “hot” electrons are generated by plasmon decay, and better chemical reactions can be obtained experimentally.
Figure 4. The current and voltage dependent plasmon-driven chemical reaction.
(a) the current and (b) the voltage dependence of TERS of DMAB. The Raman intensity were normalized at 1304 cm−1 for comparison.
We also experimentally studied the vibrational bending mode of −NO2 at 854 cm−1 in TERS of DMAB versus the tunneling current and bias voltage (see Figure S3 in supplementary information). These are qualitatively consistent with those in Figure 4a and 4b, respectively. It is worthwhile to note that the plasmon-driven chemical reactions in HV-TERS are much faster than those in SERS17. In SERS studies, the vibrational mode of 4NBT at 1336 cm−1 was not noticeably decreased until after 140 minutes, whereas in HV-TERS, it can decrease greatly within several minutes. The narrow nanogap region in the sharp tip/metal substrate geometry can supply extremely large gap plasmon resonances that benefit the plasmon-driven chemical reactions.
Finally, the anti-Stokes HV-TERS measurement again confirms that 4NBTs were dimerized to DMAB (see Figure 5), in which the ag10, ag12, ag16 and ag17 vibrational modes of DMAB were clearly observed experimentally. Furthermore, the −NO2 vibrational modes of 4NBT at −854 cm−1 and −1336 cm−1 disappeared, which means that the probability of this plasmon-driven chemical reaction is very high. It is very important to know accurately the experimental temperature of the plasmon-driven chemical reaction, which can be fitted with Eq. 1,
where Is and Ias are the intensities of Stokes and anti-Stokes, and  ,
,  and T are the Planck constant and Boltzmann constant, experimental temperature, respectively, and a is an experimental constant. The fitted experimental temperature is 327 (±4) K, and the experimental parameter a in Eq. (1) is 2.06 (±0.19).
Figure 5. The Stokes and anti-Stokes HV-TERS peaks.
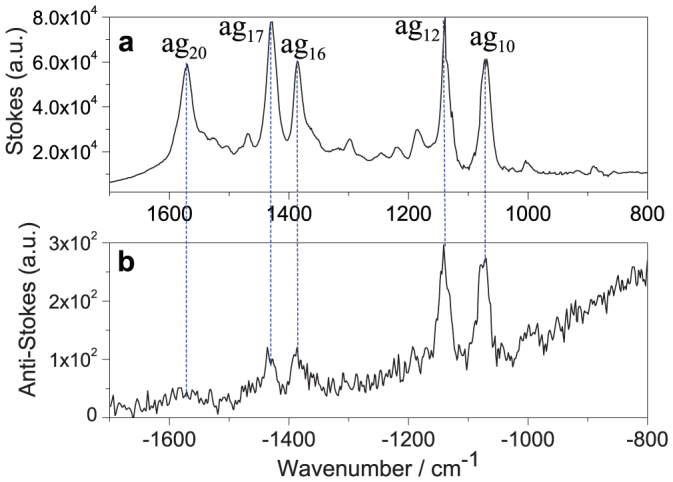
(a) The Stokes TERS, and (b) the Anti-Stokes TERS at the bias voltage 1 V and the tunneling current 2.5 nA.
Discussion
The HV-TERS system used here supplies an ideal configuration with a sharp metal tip coupled to the metal substrate to excite surface plasmons. Although photochemical reactions could still happen at the absorption resonance, it is unlikely for the 4NBT molecules used here. Both the adsorption of the 4NBT molecules and the adsorption of the compound of 4NBT on silver film are in the UV region, far away from the excitation in the red used here. Surface plasmons can decay to “hot” electrons with a kinetic energy above the Fermi level26,27which have a key role for the chemical reaction in the TERS system as revealed in Figure 3 where a stronger laser intensity generates a stronger plasmon resonance. Strong plasmon resonances produce a higher density of “hot” electrons generated from plasmon decay. The “hot” electrons with high kinetic energy above the Fermi level could jump to the unoccupied resonant energy level of chemical reactants near the metal surface. The occupation of a resonance level by a “hot” electron changes the equilibrium potential energy surface from the neutral situation to a temporal negative ion situation of the composite adsorbate molecule. The energy above the Fermi level of the “hot” electrons can be transferred to the intra molecular vibrational energy during the interactions. In both cases the energy barrier of the chemical reactions could be decreased19. Since four electrons are needed to produce one DMAB from two 4NBTs, a higher density of “hot” electrons induced by stronger incident laser intensity and stronger local plasmon resonances can boost the chemical reaction. The chemical reaction is unlikely to happen when the plasmon intensity is too weak when the incident laser power is too low, as observed in Figure 3. Thermal effects during the plasmon-driven chemical reaction can be largely ruled out according to no obvious temperature increase by fitting the Stokes and anti-Stokes HV-TERS as shown in Figure 5.
Methods
Vibrational spectra were measured with a home-built HV-TERS setup as shown in Figure 1. The diameter and height of the cylindrical vacuum chamber are 25 and 28 cm, respectively. The pressure in the vacuum chamber is about 10−7 Pa. A gold tip with the radius of about 50 nm was made by electrochemical etching of a 0.25 mm diameter gold wire28. The substrate was prepared by evaporating 100 nm silver film to a newly cleaned mica film under high vacuum. The film was immersed in a 1×10⁻⁵ M 4NBT ethanol solution for 24 hours, and then washed with ethanol for 10 minutes to guarantee that there was only one monolayer of 4NBT molecules adsorbed on the silver film. Then the sample was immediately put into the high vacuum chamber. To get a good signal-to-noise ratio, the TERS signals were collected with an acquisition time of 40 seconds and accumulated 20 times for each spectrum. We also measured normal Raman scattering spectrum of 4NBT powder, using Leica microscopy equipment in a confocal Raman spectroscopic system (Renishaw, Invia), and the incident wavelength is 632.8 nm.
Author Contributions
H.X.X. and H.R.Z. supervised the project, M.T.S. and H.X.X. designed the experiments. Z.L.Z. and M.T.S. measured HV-TERS experimentally. M.T.S. and H.X.X. analyzed data and wrote the paper.
Supplementary Material
supporting information
Acknowledgments
This work was supported by the National Basic Research Project of China (Grants 2009CB930701, 2009CB930704 and 2007CB936804) and the National Natural Science Foundation of China (Grants 90923003, 10874233, 10874234 and 20703064).
References
- Stöckle R. M., Suh Y. D., Deckert V. & Zenobi R. Nanoscale chemical analysis by tip-enhanced Raman spectroscopy. Chem. Phys. Lett. 318, 131–136 (2000). [Google Scholar]
- Hayazawa N., Inouye Y., Sekkat Z. & Kawata S. Detection and characterization of longitudinal field for tip-enhanced Raman spectroscopy. Opt. Commun. 183, 333–336 (2000). [Google Scholar]
- Anderson M. S. Locally enhanced Raman spectroscopy with an atomic force microscope. Appl. Phys. Lett. 4, 3130–3132 (2000). [Google Scholar]
- Domke K. F., Zhang D. & Pettinger B. Toward Raman fingerprints of single dye Molecules at atomically smooth Au(111). J. Am. Chem. Soc. 128, 14721–14727 (2006). [DOI] [PubMed] [Google Scholar]
- Bailo E. & Deckert V. Tip-enhanced Raman scattering. Chem. Soc. Rev. 37, 921–930 (2008). [DOI] [PubMed] [Google Scholar]
- Steidtner J. & Pettinger B. High-resolution microscope for tip-enhanced optical processes in ultrahigh Vacuum. Rev. Sci. Instr. 78, 103104 (2007). [DOI] [PubMed] [Google Scholar]
- Jiang N. et al. Observation of multiple vibrational modes in ultrahigh vacuum tip-enhanced Raman spectroscopy combined with molecular-resolution scanning tunneling microscopy. Nano Lett. (DOI:10.1021/nl2039925). [DOI] [PubMed] [Google Scholar]
- Sun M. T., Fang Y. R., Yang Z. L. & Xu H. X. Chemical and electromagnetic mechanisms of tip-enhanced Raman scattering. Phys. Chem. Chem. Phys. 11, 9412–9419 (2009). [DOI] [PubMed] [Google Scholar]
- Ritchie R. H. Plasma losses by fast electrons in thin films. Phys. Rev. 106, 874–881 (1957). [Google Scholar]
- Brockman J. M., Nelson B. P. & Corn R. M. Surface plasmon resonance imaging measurements of ultrathin organic films. Annu. Rev. Phys. Chem. 51, 41–63 (2000). [DOI] [PubMed] [Google Scholar]
- Tsuboi Y., Shimizu R., Shoji T. & Kitamura N. Near-infrared continuous-wave light driving a two-photon photochromic reaction with the assistance of localized surface Plasmon. J. Am. Chem. Soc. 131, 12623–13267 (2009). [DOI] [PubMed] [Google Scholar]
- Deeb C. et al. Plasmon-based free-radical photopolymerization: effect of diffusion on nanolithography processes. J. Am. Chem. Soc. 133, 10535–10542 (2011). [DOI] [PubMed] [Google Scholar]
- Hubert C. et al. Near-field photochemical imaging of noble metal nanostructures. Nano Lett. 5, 615–619 (2005). [DOI] [PubMed] [Google Scholar]
- Chen C. J. & Osgood R. M. Near-field photochemical imaging of noble metal nanostructures. Phys. Rev. Lett. 50, 1705 (1983). [Google Scholar]
- Fang Y., Li Y., Xu H. X. & Sun M. T. Ascertaining p, p'-Dimercaptoazobenzene Produced from p-Aminothiophenol by Selective Catalytic Coupling Reaction on Silver Nanoparticles. Langmuir 26, 7737–7746 (2010). [DOI] [PubMed] [Google Scholar]
- Huang Y. F. et al. When the signal is not from the original molecule to be detected: chemical transformation of para-aminothiophenol on Ag during the SERS measurement. J. Am. Chem. Soc. 132, 9244–9246 (2010). [DOI] [PubMed] [Google Scholar]
- Dong B., Fang Y. R., Chen X. W., Xu H. X. & Sun M. T. Substrate-, wavelength-, and time-dependent plasmon-assisted surface catalysis reaction of 4-nitrobenzenethiol dimerizing to p,p'-dimercaptoazobenzene on Au, Ag, and Cu films. Langmuir 27, 10677–10682 (2011). [DOI] [PubMed] [Google Scholar]
- Zhu H., Ke X., Yang X., Sarina S. & Liu H. Reduction of nitroaromatic compounds on supported gold nanoparticles by visible and ultraviolet light. Angew. Chem. Int. Ed. 49, 9657 (2010). [DOI] [PubMed] [Google Scholar]
- Christopher P., Xin H. & Linic S. Visible-light-enhanced catalytic oxidation reactions on plasmonic silver nanostructures. Nature Chem. 3, 467–472 (2011). [DOI] [PubMed] [Google Scholar]
- Xie W., Herrmann C., Kömpe K., Haase M. & Schlücker S. Synthesis of bifunctional Au/Pt/Au Core/Shell nanoraspberries for in situ SERS monitoring of Platinum-catalyzed reactions. J. Am. Chem. Soc. 133, 19302–19305 (2011). [DOI] [PubMed] [Google Scholar]
- Navalon S., de Miguel M., Martin R., Alvaro M. & Garcia H. Enhancement of the catalytic activity of supported gold nanoparticles for the Fenton reaction by light. J. Am. Chem. Soc. 133, 2218–2226 (2011). [DOI] [PubMed] [Google Scholar]
- Silva C. G., Juárez R., Marino T., Molinari R. & García H. Influence of excitation wavelength (UV or visible light) on the photocatalytic activity of titania containing gold nanoparticles for the generation of hydrogen or oxygen. J. Am. Chem. Soc. 133, 595–602 (2011). [DOI] [PubMed] [Google Scholar]
- Wadayama T. & Yokawa M. Hot-electron assisted reaction of p-nitrobenzoic acid adsorbed on metal–insulator–metal tunnel junction's electrode surface. Chem. Phys. Lett. 428, 348–351 (2006). [Google Scholar]
- Sun M. T. & Xu H. X. A novel application of plasmonics: plasmon driven surface catalyzed eeactions. Small 2012, in press (DOI: 10.1002/smll.201200572). [DOI] [PubMed] [Google Scholar]
- Lee H. J. & Ho W. Single-bond formation and characterization with a scanning tunneling microscope. Science 286, 1719–1722 (1999). [DOI] [PubMed] [Google Scholar]
- Knight M. W., Sobhani H., Nordlander P. & Halas N. J. Photodetection with active optical antennas. Science 332, 702–704 (2011). [DOI] [PubMed] [Google Scholar]
- Moskovits M. Hot electrons cross boundaries. Science 332, 676–677 (2011). [DOI] [PubMed] [Google Scholar]
- Ren B., Picardi G. & Pettinger B. Preparation of gold tips suitable for tip-enhanced Raman spectroscopy and light emission by electrochemical etching. Rev. Sci. Instrum. 75, 837–841 (2004). [Google Scholar]
Associated Data
This section collects any data citations, data availability statements, or supplementary materials included in this article.
Supplementary Materials
supporting information


