Abstract
Three-dimensional periodic complex structures are encountered in various soft matter systems such as liquid crystals, block-copolymer phases and the related nano-structured materials. Here, we review several well-defined topologies: two-dimensional hexagonal phase, three-dimensional packing of spheres, tetrahedral close packing (tcp) bi-continuous and tri-continuous cubic phases. We illustrate how small-angle X-ray scattering experiments help us to investigate these different structures and introduce the main available structural models based on both direct and inverse methods.
Keywords: hexagonal phases, cubic phases, tcp phases, nano-structured materials, small-angle X-ray scattering, X-ray scattering
1. Introduction
Three-dimensional periodic complex fluids with different architectures can form based on the nano-segregation between two incompatible components at the molecular level. Since the 1970s, many soft matter systems have shown this phenomenon in liquid-crystalline (LC) phases, including thermotropic molecules, surfactants, block-copolymers and lipids. Nowadays, thanks to the development over the last 15 years of the synthesis of nano-structured materials using surfactants as structure-directing agents, the same architectures are encountered in hybrid materials and porous materials. In this area, many application fields are in development such as porous media in catalysis, nano-molds to synthesize nanoparticles of controlled size or biomaterials for drug delivery or bone tissue regeneration. These structures have therefore generated considerable interest in the soft matter and the materials fields.
Small-angle scattering (SAS) is a widespread technique to investigate these structures and it has been essential to elucidate new phases. In contrast with atomic or molecular crystals, the basic units are supra-molecular aggregates of a few nanometres. We first introduce here the basic methods and specificities with SAS dealing with mesophases and nano-structured materials. After that we give an overview of the available structural models, with a special emphasis on the use of intensity measurements. The different phases discussed in this paper are given in table 1: two-dimensional hexagonal phase, three-dimensional packing of spheres, tetrahedral close packing (tcp), bi-continuous and tri-continuous cubic phases. This list corresponds to all the three-dimensional phases found experimentally for which the driving force is the segregation between two incompatible molecular blocks. The case of the lamellar/smectic phase is not included here because stacking of layers corresponds to a quasi-one dimensional long-range order, and this implies a different structural approach. In the same way, mesophases based on orientational order (nematic phases, blue phases … ) or a combination of orientational and positional order (smectic blue phases, smectic Q phases … ) are out of the scope of this paper, as we focus here on the case of structures exhibiting only long-range positional order.
Table 1.
List of the different three-dimensional phases discussed in this paper. For each of them, the space-group and the sequence of the Bragg reflections are provided [1]. For each Bragg reflection, the Miller indices are given with the value of s2 and the multiplicity m inside brackets. Depending on the symmetry of the phase, notations are as follows: three-dimensional cubic: hkl (s2 = h2 + k2 + l2, m); three-dimensional hexagonal: hkl (s2 = (4/3)(h2 + k2 + hk) +(1/R2)l2, m) with R = c/a ≈ (8/3)1/2; two-dimensional hexagonal: hk (s2 = h2 + k2 + hk, m); three-dimensional tetragonal: hkl (s2 = h2 + k2 + (1/R2)l2, m) with R = c/a. Miller indices are written in bold script when they correspond to a usually strong Bragg reflection.
| type | space-group | Bragg reflections | references |
|---|---|---|---|
| three-dimensional micellar sphere packing | Im m (bcc) m (bcc) |
110 (2, 12), 200 (4, 6), 211 (6, 24), 220 (8, 12), 310 (10, 24), 222 (12, 8), 321 (14, 48), 400 (16, 6) … | |
Fm m (fcc) m (fcc) |
111 (3, 8), 200 (4, 6), 220 (8, 12), 311 (11, 24), 222 (12, 8), 400 (16, 6), 331 (19, 24), 420 (20, 24), 422 (24, 24), 511 (27, 24)), 333 (27, 8), 440 (32, 12), … | ||
| P63/mmc (hcp) | 100 (4/3, 6), 002 (4/R2, 2), 101 (4/3+1/R2, 12), 102 (4/3+4/R2, 12), 110 (4, 6), 103 (4/3+9/R2, 12), 200 (16/3, 6), 112 (4+4/R2, 12), 201 (16/3+1/R2, 12) … | [2] | |
| three-dimensional micellar (tcp) tetrahedral close packing | Pm n n
|
110 (2, 12), 200 (4, 6), 210 (5, 24), 211 (6, 24), 220 (8, 12), 310 (10, 24), 222 (12, 8), 320 (13, 24), 321 (14, 48), 400 (16, 6) … | [3] |
Fd m m
|
111 (3, 8), 220 (8, 12), 311 (11, 24), 222 (12, 8), 400 (16, 6), 331 (19, 24), 422 (24, 24), 511 (27, 24), 333 (27, 8), 440 (32, 12) … | [4] | |
| P42/mnm | 311 (10+1/R2, 16), 002 (4/R2, 2), 112 (2+4/R2, 8), 410 (17, 8), 330 (18, 4), 202 (4+4/R2, 8), 212 (5+4/R2, 16), 411 (17+1/R2, 16), 331 (18+1/R2, 8), 222 (8+4/R2, 8), 312 (10+4/R2, 16) … | [5,6] | |
| two-dimensional hexagonal | P6/mm | 10 (1, 6), 11 (3, 6), 20 (4, 6), 21 (7, 12), 30 (9, 6), 22 (12, 6), 31 (13, 12) … | |
| bi-continuous cubic | Ia d (G-surface) d (G-surface) |
211 (6, 24), 220 (8, 12), 321 (14, 48), 400 (16, 6), 420 (20, 24), 332 (22, 24), 422 (24, 24), 431 (26, 48), 521 (30, 48), 440 (32, 12) … | [7] |
Pn m (D-surface) m (D-surface) |
110 (2, 12), 111 (3, 8), 200 (4, 6), 211 (6, 24), 220 (8, 12), 221 (9, 24), 310 (10, 24), 311 (11, 24)… | ||
Im m (P-surface) m (P-surface) |
110 (2, 12), 200 (4, 6), 211 (6, 24), 220 (8, 12), 310 (10, 24), 222 (12, 8), 321 (14, 48), 400 (16, 6), … | ||
| tri-continuous cubic | Im m m
|
110 (2, 12), 200 (4, 6), 211 (6, 24), 220 (8, 12), 310 (10, 24), 222 (12, 8), 321 (14, 48), 400 (16, 6), 411 (18, 24), 330 (18, 12), 420 (20, 24), 332 (22, 24), 422 (24, 24) … | [8] |
2. Measurements with small-angle scattering
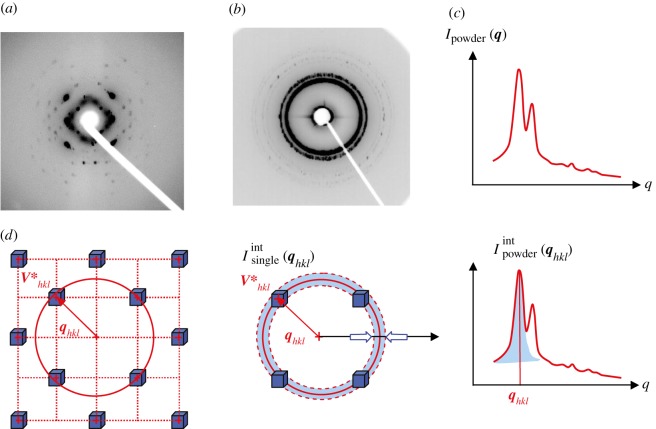
SAS is a well-known method to investigate structural properties in many soft matter systems, using either X-rays (SAXS) or neutrons (SANS) at length scales ranging from 1 to 100 nm. Dealing with periodic structures, the main feature in SAS is the presence of several Bragg peaks, because of long-range order organization at the nano-scale, as illustrated in figure 1. These Bragg peaks do not come from the crystalline arrangements of atoms as in usual crystallography, but reveal a periodicity inside matter at a molecular level between supra-molecular entities. Usually, only a very small number (typically 10 of them or less) of Bragg reflections are recorded. From their positions in reciprocal space, one can deduce the unit cell dimensions, its symmetry elements and the space group. For each phase, the list of the observed reflections is given in table 1. The space-group identification step is quite straightforward, but, when only a small number of Bragg peaks are observed, the choice of space-group is often based on additional hypothesis and when different space-groups are possible, the space-group with the highest symmetry is chosen. For example, for cubic phases, one always assumes that the point group is m m, and this corresponds to the presence of an inversion centre and mirrors perpendicular to the fourfold and twofold axis. However, the knowledge of the space-group is not sufficient for structure identification. For example, in table 1, three different phases have the same space-group Im
 m: the bcc phase, the P-surface bi-continuous cubic phase and the tri-continuous cubic phase. In order to distinguish between these three structures, one has to take into account not only the positions but also the intensities of the Bragg peaks. Therefore, this paper focuses on the elaboration of structural models based on these intensities. Indeed, because the dimensions of the basic structural units (the supra-molecular entities) are comparable to the size of the unit cell, their molecular form factor gives rise to strong modulations of the Bragg peak intensities. First, we discuss how to take Bragg peak intensity measurements with SAS experiments. We detail how the usual expressions of the scattered intensity from standard crystallography using discrete atomic coordinates are modified in the case of SAS. In that case, we are able to derive the expressions of the scattered intensity in absolute scale, including all the pre-factors. As SAXS is much more suitable than SANS to measure Bragg peaks with a good resolution, we will give the intensity expressions only in the case of X-rays.
Figure 1.
Typical SAXS pattern of a bi-continuous Ia d phase [9]: (a) single-crystal pattern along a fourfold axis, (b) powder pattern and (c) the radially averaged powder intensity. (d) Relationships in reciprocal space between the integrated intensity of an individual Bragg peak
  and the integrated powder intensity
  . The radially averaged intensity for a powder sample Ipowder(q) takes into account the multiplicity mhkl of the hkl reflection and the isotropic average over the orientation in space.
We start from the general expression of the scattered intensity for SAXS in absolute scale1 defined as
 |
2.1 |
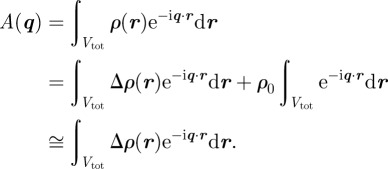
where re = 2.81794 × 10⁻¹⁵ m is the classical radius of the electron, Vtot is the sample volume illuminated by the X-ray beam and q is the scattering vector in the reciprocal-space. The modulus of the scattering vector is q = 4πsin(θ)/λ, where 2θ is the scattering angle and λ is the wavelength of X-rays. In an SAXS measurement, the fundamental quantity derived is the Fourier transform A(q) of the electron density ρ(r), the number of electrons per unit volume. Using the electron density, matter is described at the nano-scale as a continuous medium, and the scattered intensity reflects the spatial repartition of high- and low-electron density regions. Note that one can either define for SAXS a scattering length density (SLD) ρSLD(r) = reρ(r), similar to the coherent SLD in neutron scattering (SANS), which is associated with the nuclei of the atoms. In the general case, an ensemble average (brackets notation 〈|A(q)|2〉) over different configurations of the system upon time and disorder factors has to be taken into account.
Only relative variations of the electron density ρ(r) with respect to a constant electron density level contribute to the measured intensity. This can be shown writing ρ(r) = ρ0 + Δρ(r), where ρ0 is a constant, such as the solvent electron density for a colloidal or micellar solution, or the average electron density for a periodic structure.
 |
2.2 |
Because the total sample volume Vtot is always assumed to be macroscopic, the second integral over Vtot can be neglected in  , as it contributes only for very small scattering vector moduli that are not accessible experimentally.
For SAS, the scattering angles are small (less than typically 5°) and cosθ ≅ 1. As in standard crystallography, intensity is recorded in reciprocal space only for scattering vectors q located on the Ewald sphere. The intersection with the Ewald sphere gives rise to a geometrical correction (Lorentz factor) in the measured intensities that depends on the scattering angle. However, because cosθ ≅ 1, the Lorentz factor can be neglected in the intensity expressions. Similarly, the polarization factor is equal to one for SAS.
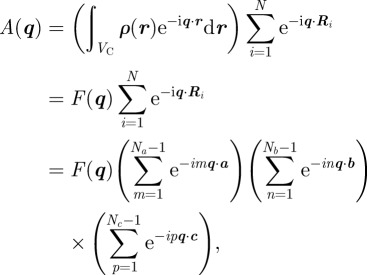
For a three-dimensional periodic structure, the electron density ρ(r) is a three-dimensional periodic function, and the amplitude can be factorized as follows:
 |
2.3 |
with
 |
2.4 |
where VC is the volume of the unit cell defined by the basis vectors (a,b,c), N = NaNbNc is the total number of unit cells and {Ri} are the lattice vectors Ri = ma + nb + pc. Like in crystallography, we can introduce the Laue function
 |
2.5 |
For a perfectly ordered structure, all unit cells are identical and the electron density corresponds to the average structure inside the unit cell (|F(q)|2 = 〈|F(q)|2〉). The intensity can be written as
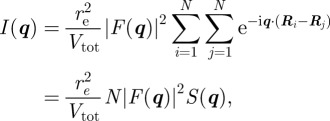 |
2.6 |
where S(q) is the structure factor associated with the three-dimensional lattice:
 |
2.7 |
For a large number of unit cells (macroscopic crystal), the three integers Na, Nb and Nc are large, and the intensity is concentrated inside Bragg peaks located at the nodes of the reciprocal lattice: qhkl = 2π(ha* + kb* + lc*). It is only in the ideal case of an infinite crystal that the Bragg peaks reduce to points in the reciprocal space. For a crystal of finite size, the Bragg peaks are extended to a small volume in the reciprocal space that is linked to the shape of the crystal as described by the Laue functions [10]. However, with a standard resolution of an SAS experiment, this effect may be detectable only for very small crystals (typically less than 0.1–0.3 μm). The most usual situation is that the crystals are large enough so that the measured extension of the Bragg peaks is fixed by the experimental resolution and not by the size of the crystals. Then, the relevant quantity to introduce is the integrated intensity of a Bragg peak in reciprocal space. Its expression can be obtained by integrating the expression with the Laue functions for each Bragg peak within a small reciprocal volume  around it. For a single crystal, this integrated intensity
  is well approximated by
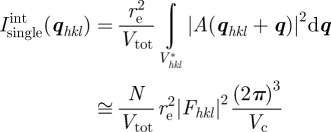 |
2.8 |
with
 |
2.9 |
For a fixed position of a single crystal, the intersection with the Ewald sphere gives rise to asymmetric patterns on a two-dimensional detector. This is because, even if the scattering angles are small, Bragg peaks at qhkl and −qhkl are not simultaneously in reflection position on the Ewald sphere. Then, for a single crystal, one needs to rotate the sample in order to collect the integrated intensity of the Bragg peaks. For example, in figure 1a, the two-dimensional scattering pattern was recorded when applying to the sample oscillations of a few degrees in amplitude around the vertical axis, to allow the different Bragg peaks to cross the Ewald sphere. The rotation of the sample has then to be taken into account for intensity measurements.2
Reliable measurements of the integrated intensity are easier to obtain with a sample in a powder configuration rather than with a single crystal. Typical experimental data for both situations are given in figure 1 for comparison. A powder sample is composed of a large number of independent crystals (all of macroscopic size) exhibiting all possible orientations in space with the same probability. This sample is formally described by the assembly of M identical crystals of volume Vtot/M, containing N/M unit cells. Note that the contribution of a powder of M crystals of N/M unit cells is equal to the contribution of only one single crystal of size N averaged over all orientation in space. The integration is performed in reciprocal space on a sphere of radius qhkl as illustrated in figure 1 and the integrated powder intensity is
 |
2.10 |
where mhkl is the multiplicity of the hkl Bragg reflection.
Again, the relevant quantity is  , the integrated intensity of a Bragg peak on the radially averaged intensity Ipowder(q). It may be useful to introduce peak-shaped function L(q,qhkl) to model continuously Ipowder(q) as follows:
 |
2.11 |
where the L(q,qhkl) function is normalized as follows:  .
.
For a powder sample, the two corrections are the q−2 dependence of the intensity with respect to the scattering vector and the multiplicity term.
3. Direct and inverse methods
In §2, we have shown how to deduce the values of the Fourier coefficients Fhkl of the electron density ρ(r) from experimental measurements of the Bragg peak intensities. Once the Fhkl values are known, there are two ways to obtain a structural model in real-space, the so-called direct and inverse methods. With the direct method approach, the structural model is built directly in real-space, and the Fourier coefficients Fhkl are calculated from the model and compared with the experimental values. The different parameters of the model (size, contrast, disorder terms … ) are adjusted by a least-squared minimization procedure to fit the experimental intensity. The main advantages of this method are: (i) to provide quantitative values of the parameters to describe the structural model, (ii) to be able to model the whole intensity curve (not only the Bragg peaks integrated intensities), and (iii) to introduce disorder terms in the description of the structure. The main drawbacks of a direct method are that a structural model has to be built already as a starting point, and that it may happen that several different models can fit as well the same experimental data. Inverse methods consist of the reconstruction of the electron density function, using an inverse Fourier transform from reciprocal space to real space. Its main advantage is to provide the global features of the structure without assuming initially any models. Dealing with periodic structures, the key point is to solve the ‘phases problem’, which may be complicated for a large number of Bragg peaks. As the reconstruction is based only on the integrated intensities of the Bragg peaks, it provides a periodic average structure but includes no disorder terms. The electron density maps are obtained with a finite spatial resolution, fixed by the accessible q-range and it is then more difficult to derive quantitatively the sizes of the structural units when compared with the direct methods. Before giving several examples of structure determination using both methods, we will describe the reconstruction of the electron density (§3.1) and the introduction of disorder contributions (§3.2).
3.1. Reconstruction of the electron density
The reconstruction of the electron density is obtained by an inverse Fourier transform from reciprocal space to the direct space, using the Fhkl values (equation (2.9)):
 |
3.1 |
Experimentally, only |Fhkl|2 is measured for hkl values different from 000. The fact that only the modulus of a Fhkl coefficient is measured is known at the ‘phases problem’ in crystallography and the Fhkl coefficients are a priori complex numbers of unknown phase φhkl:
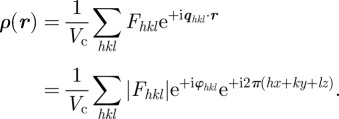 |
3.2 |
For the structures we are interested in, it happens that they all contain an inversion centre and the space-group is centrosymmetric. If the origin of real space is taken at this inversion centre, the Fhkl coefficients are real and a phase φhkl can take only two discrete values, φhkl = 0 or ±π:
 |
3.3 |
The ‘phases problem’ reduces to a sign determination (cos(φhkl) = ± 1) and it is very often possible to solve it. As the number of measured Bragg peaks is rather low, the usual method is to generate the electron density maps for all the different sign combinations. Among them, the best combination of signs is selected, which is in agreement with the independent knowledge of the structure in terms of the size of the building-blocks and the repartition of high and electron density regions. The complete sums of cosine terms for all space-groups are tabulated in the International Tables for Crystallography [1], more details are provided in3 and an example of reconstruction for the Ia d space group (electronic supplementary material, figure S2) is discussed in §6.
The F000 coefficient cannot be measured because the scattering vector q = 0 is not experimentally accessible. Consequently, as already mentioned (§2 equation (2.2)), only the relative variations of the electron density with respect to a constant electron density level can be determined. In practice, the value of the F000 coefficient is obtained from the knowledge of the molecular composition of the sample. Either the average value 〈ρ〉 within the unit cell is taken, or the average variation 〈Δρ〉 referring to a constant density level ρ0 (for instance the solvent electron density for a colloidal suspension). In this latter case, the Fhkl coefficients are relative to the Fourier transform of Δρ(r).
 |
3.4 |
or
 |
In the case of a two-dimensional hexagonal phase, the lattice is two-dimensional and equation (5.3) has to be used instead.
3.2. Disorder contribution
It is possible to introduce some disorder contribution in a structural model based on direct methods. The nature of the disorder can be a displacement disorder over the lattice nodes (modelled by a Debye–Waller contribution), or a substitution disorder (distribution in size or in nature of some supra-molecular units). Another origin for disorder can be the conformation of the supra-molecular aggregates themselves, like for micelles of bloc-copolymers with long polymeric chains, that do not exhibit a spherical symmetry [11]. In this section, we will introduce only basic general equations, to show that all types of disorder affect scattering in the same way. When disorder is included, the unit cells are not identical, and a more general expression than in equation (2.6) applies, where one assumes that the structure is on average a three-dimensional periodic arrangement:
 |
3.5 |
where  refers to the content of the unit cell located at position Ri. If one can assume that the disorder terms are not spatially correlated between two different unit cells, one can use the decoupling approximation that had been introduced in various contexts [10,12–14]
 |
3.6 |
and the intensity reads:
 |
with
 |
3.7 |
On this expression, one recovers the main important general result that the influence of disorder is twofold [10]. It gives rise to diffuse scattering in between the Bragg peaks (term (1−β(q))) and accordingly the intensities of the Bragg peaks are decreased by a factor β(q).
In the case of a displacement disorder over the lattice nodes, the factor β(q) is decreasing following an exponential law known as the Debye-Waller term:
| 3.8 |
where  is the mean square amplitude of the displacement in the q vector direction. This expression can be simplified by assuming that the distribution is isotropic [10]. Then
  for a three-dimensional lattice, and
  for a two-dimensional lattice (like a two-dimensional hexagonal phase), where 〈u2〉 is the isotropic mean square amplitude of the displacement. Note that for bi-continuous cubic phases, expressions including the q vector direction dependence are available [15]. The values of 〈u2〉 have to be small and more precisely, by analogy with solid state theory, one can apply the Lindemann criterion for the melting of a solid, for which melting arises when 〈u2〉/d ≅ 0.1−0.2, where d is the typical interatomic distance [16]. For a mesophase, d can be replaced by the typical distance between particles.
4. Spheres packing and tcp packing
Several mesophases consist of a three-dimensional packing of spherical-like particles. These particles display various natures such as LC dendrimers, micelles of surfactant molecules, micelles of block-copolymers and solid nanoparticles with organic chains grafted on their surface. The different, observed three-dimensional packings can be classified into two categories: spherical packing (bcc, fcc and hcp; figure 2 and table 1) and tcp (figure 3 and table 1). In the first category, all the particles are identical and have a spherical symmetry. In contrast, in a tcp packing, the particles are not all identical in the packing. They are located on lattice points with different symmetry (Z = 12, 14, 15, 16 nearest neighbours; figure 3) and are able to deform into spheroidal shapes because of their soft nature. Very often, one particular system can exhibit several of these packings upon concentration or temperature—for example, non-ionic surfactants in water [2,17,18] or dendrimers [3]. The global understanding of this behaviour is based on the interaction potential between the particles and on the crystallization phenomena. The occurrence of fcc or hcp packing is related to the crystallization of spheres interacting via a hard-sphere potential and to the famous Kepler's conjecture in 1611. As recalled in figure 2, both structures consist of the dense packing of spheres with 12 nearest neighbours (Z = 12), and they have the same compacity of 0.74, but differ only in the packing sequence, ABC for fcc and AB for hcp. The Kepler's conjecture claims that both the fcc and hcp packings exhibit the largest possible compacity for the packing of identical spheres in three dimensions [19]. Surprisingly, a first proof of this conjecture has been given only very recently by the mathematician Thomas C. Hales, and is still nowadays under verification using extensive numerical calculations [20]. Recent numerical simulations using a hard-sphere potential find a very small entropy difference (10−3 kB per sphere) in favour of the fcc packing versus the hcp one [21,22]. However, there are several observations of the hcp packing in soft matter systems [2,23,24] and in mesoporous materials [25], indicating that it could also be thermodynamically stable. As the bcc packing exhibit a smaller compacity of 0.68 (instead 0.74 for fcc/hcp), its occurrence may at first sight be surprising. In fact, this packing occurs in the presence of a more long-range potential in addition to the hard-sphere potential [26–28]. A physical interpretation has been proposed by Kamien & Ziherl [29] in the case of dendrimers in terms of an additional repulsive potential driven by the conformational entropy of the chains located at the surface of the particles. This interpretation is, in fact, quite general and can be extended for many kind of particles where long enough chains are present on their surface. For example, for block-copolymer micelles with a shell made of EO chains, fcc packing is formed for short EO chains and bcc for longer ones [27].
Figure 2.
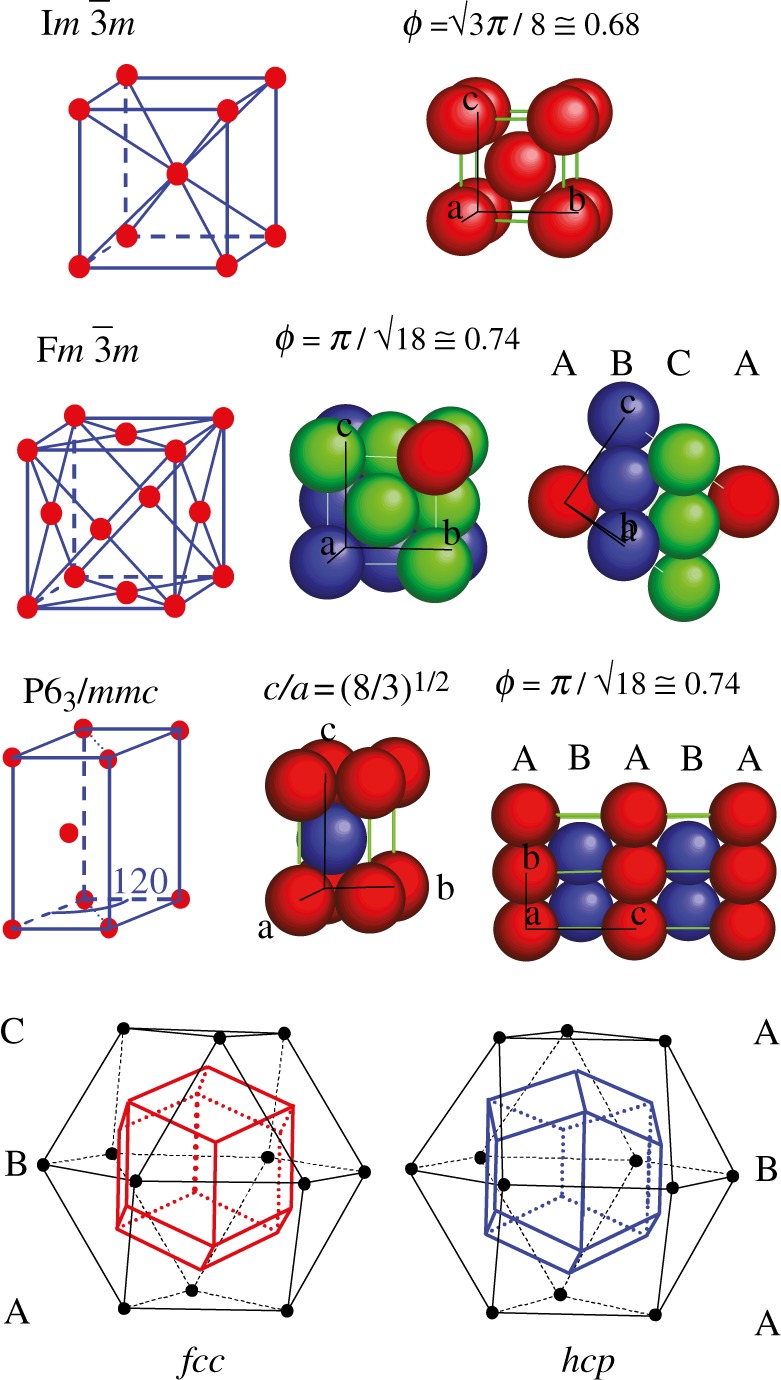
Three-dimensional packing of spheres: bcc (Im m), fcc (Fm
 m) and hcp (P63/mmc). All sites are identical in these structures.
Figure 3.
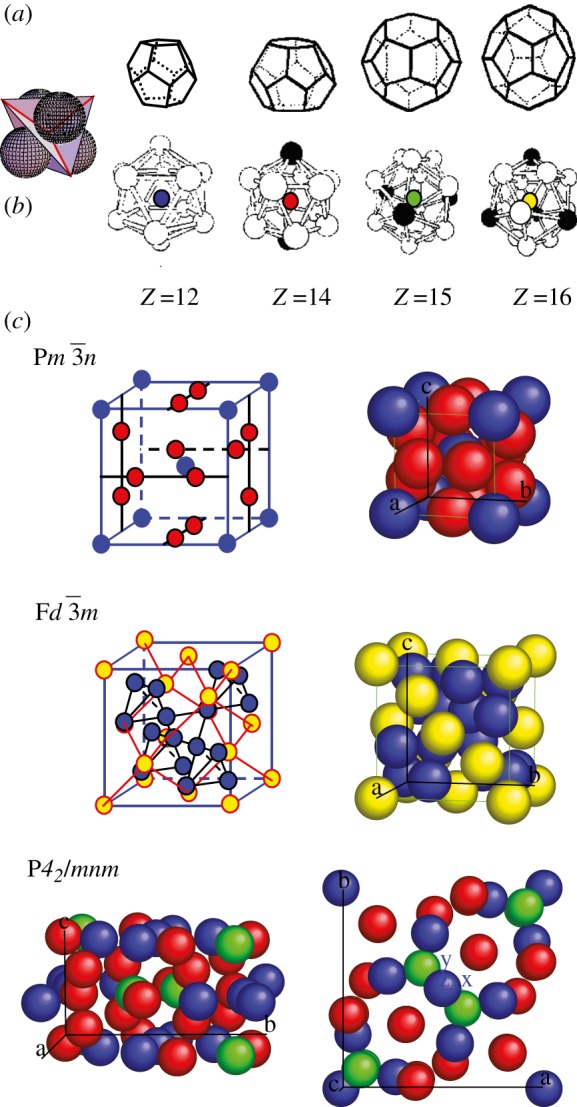
Tcp packing. (a) local tetrahedral close packing configuration. (b) the different sites Z = 12 (blue), Z = 14 (red), Z = 15 (green) and Z = 16 (yellow). (c) The three phases observed experimentally in soft matter systems: Pm n, Fd
n, Fd m and P42/mnm.
For SAS, the fcc, hcp and bcc packings give rise to a simple expression for the Fhkl coefficients (equation (2.9)), assuming that all particles are identical and have a spherical symmetry [14]:
| 4.1 |
where FS(q) is the form factor of a particle with a spherical symmetry and any density profile (sphere, core/shell … ) and  is a contrast term.
  is the structure factor inside the unit cell that depends on the lattice.4 For sphere packing, both direct and inverse methods can be easily applied, and models with disorder terms are available [14]. In the case of hcp, a comparison of both methods confirmed the spherical shape of the micelles in this packing [23].
The tcp packings constitute a fascinating family of structures. In mesophases, thanks essentially to SAS experiments combined with reconstruction methods, three of them have been discovered so far (figure 3): the Pm n, Fd
n, Fd m [30] and, more recently, the P42/mnm phase [5,6,31]. Using purely geometrical arguments and the concept of geometrical frustration, Charvolin & Sadoc [32] have shown that tcp packings in mesophases are strongly related not only to the Franck and Kasper phases of metals and metallic alloys, but also to the structure of soap froths. It is remarkable that the Pm
 n phase has the same structure as one crystalline phase tungsten and the P42/mnm phase as uranium [33]. In a geometrical approach, a tcp packing results from the compromise between a global constrain to achieve a periodic structure and a local minimum, the tetrahedral packing of four particles, which corresponds locally to a maximum density for spheres packing (figure 3). This compromise arises because it is not possible to form a periodic packing with regular tetrahedrons in three dimensions [34].
Then the particles are arranged locally in a tetrahedral configuration, but are not identical in the sense that they occupy sites with different symmetries, corresponding to different numbers of nearest neighbours (Z = 12, 14, 15, 16 …) (figure 3). The related geometrical problem with the domain of soap froths, which was brought up by Kelvin (1887), is to find the periodic soap froth with cells of identical volume that minimizes the total area of the cells. Indeed, the minimization of the area corresponds locally to the Plateau's laws (1873) for soap films with a tetrahedral symmetry of the junctions of the films as depicted in figure 3. The minimization of this area is equivalent to the maximization of the density for spheres packing. Weaire & Phelan [35] have shown that the Pm n phase (with two types of cells) is a better solution to the Kelvin's problem than the packing of Kelvin's polyhedra [36]. For mesophases, Ziherl & Kamien [29,37] gave a physical interpretation of the minimisation of the total area in the Pm
 n phase by the maximization of the entropy of the chains located at the surface of the supra-molecular units. They were also able to compare the relative stability of the bcc, fcc and Pm
 n phases, using the combination of an hard-sphere potential with a repulsive soft shoulder potential [37].
In the case of soft deformable particles, their shape and size happen to modify slightly from a pure spherical symmetry depending on the site symmetry (Z = 12, 14, 15, 16 …). In figure 3, the sites are depicted with different colours but spherical balls are used to simplify the representation. Inverse methods with SAS allow us to directly visualize differences in the shape and sizes depending on the symmetry of the site [3,30]. These methods are more suited to describe tcp packings than direct methods, which are in fact less used in this situation. This is because the form factor of each particle in the unit cell is different depending on its position, and cannot be factorized like in the case of spheres packing as shown in equation (4.1). For the Fd m structure, there is a significant difference in the size of the two types of sites (Z = 12 and Z = 16) that are both almost spherical [4,30]. In the Pm
 n structure (coexistence of Z = 12 and Z = 14), the Z = 14 sites adopt slightly elongated shapes as discussed in detail in Balagurusamy et al. [3]. In porous materials with a Pm
 n structure, the main cavities have two different sizes [38]. Moreover, additionnal pores may form between adjacent cavities and the whole structure can be described based on a new Infinite Periodic Minimal Surface (IPMS) by applying again a global criterium of aera minimization [39]. The P42/mnm structure contains 30 particles per unit cell (Z = 12, Z = 14 and Z = 15), and the reconstructions evidence spheroidal shapes for all of them, with small deformations from spherical symmetry [5,6]. Note that in the latter case, a characteristic feature is that the strongest Bragg reflections (table 1) have quite high Miller indices (410, 330, 202, 212 …) because of the large number (30) of particles in the unit cell. From the analogy with the Franck and Kasper phases, other tcp phases are still to be discovered in soft matter systems and mesoporous materials [40]. In this sense, there is also a structural link between tcp phases and the quasi-crystalline phases recently discovered in thermotropic dendrimers [5,33].
5. Two-dimensional hexagonal phase
Two-dimensional hexagonal phases are very common in soft matter systems and nano-structured materials. For porous nano-structured materials, it has been shown that Bragg peaks intensity measurements with SAS are very useful to determine their pore size [41]. For this phase, the expressions of the intensity given in §2 have to be slightly modified because the lattice has two dimensions instead of three. In the following, using a simple model, we derive these expressions by assuming that the two-dimensional order is a true long-range order, and not a quasi-two-dimensional order like in the more sophisticated para-crystal model [14].
A two-dimensional hexagonal phase consists of the two-dimensional packing of very long particles having a cylindrical symmetry. A two-dimensional hexagonal lattice (electronic supplementary material, figure S1) and the macroscopic length L along the perpendicular direction z′z to the lattice describe this structure. The electron density ρ(r) is a two-dimensional periodic function in the hexagonal plane and is constant along z′z. Equation (2.5), given previously in the three-dimensional case, changes in the following way:
 |
5.1 |
where VC = SC L is the unit cell volume, SC is the area of the two-dimensional unit cell defined by the basis vectors (a,b), N = NaNb is the total number of two-dimensional unit cells and r = r P + zez, q = q P + qzez,
 |
5.2 |
Note that with this definition, F(q P) has the dimension [L−1] but ρ(r) is still defined as the three-dimensional electron density ([L−3]). The expression for the electron density reconstruction then reads (see equation (3.4))
 |
5.3 |
with
 |
5.4 |
The expressions for the intensity are derived essentially in the same way as in the three-dimensional case (equation (2.8); figure 1). The integrated intensity  at a Bragg peak
  is performed in a three-dimensional reciprocal volume
  (q = qaa* + qbb* + qzez). As the length L is large, the extension of a Bragg peak along z′z is small. The integration gives
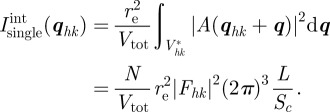 |
5.5 |
For a powder sample, equations (2.10) and (2.11)) becomes
 |
5.6 |
and
 |
5.7 |
where mhk is the multiplicity of the hk Bragg reflection.
Like in the three-dimensional case, a q−2 dependence applies for a powder sample. This behaviour can be derived in a slightly different way [14,42–44] as the product of a q−1 contribution in the hexagonal plane (orientation average of the two-dimensional lattice) and a q−1 dependence of a form factor along z′z. Assuming that the particles packed on the two-dimensional lattice have a cylindrical symmetry, one can introduce their cross section form factor FCS(q), in a similar way as for sphere packing (equation (4.1)):
and
 |
5.8 |
Similar to spheres packing, both direct and inverse methods are available for two-dimensional hexagonal phases. Contribution of disorder [14,42,43] can also be included as introduced in §3.2. In figure 4, a comparison of both methods is given in the case of the formation of a two-dimensional hexagonal hybrid material (SBA-15). On the basis of the Bragg peaks evolution upon time (figure 4a), the variations of the electron density are modelled either by a core/shell form factor [43,45] or by performing a two-dimensional electron density reconstruction [46]. The time-resolved formation of a dense silica wall in-between the cylindrical micelles is evidenced with both methods.
Figure 4.
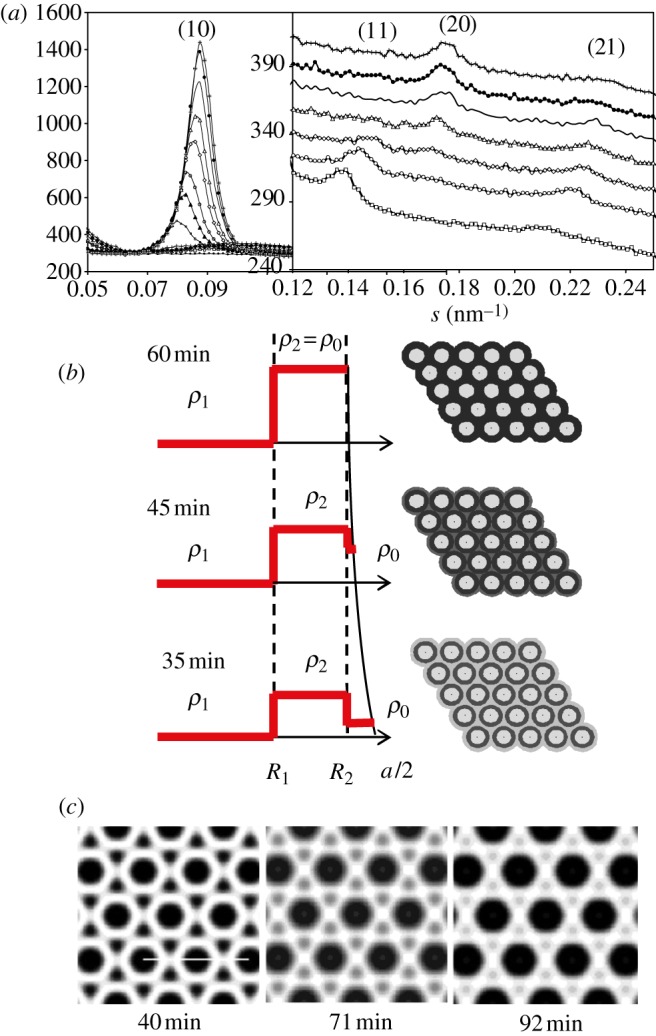
Time-resolved formation of a two-dimensional hexagonal nano-structured silica material (SBA-15). (a) Evolution of the (10), (11), (20) and (21) Bragg peaks (powder pattern). (b) Density profile obtained by modeling these experimental data using a cylindrical core/shell model (higher electron density in black) [45]. (c) Two-dimensional electron density reconstruction (higher electron density in white) from reference [46]. The formation upon time of a dense silica wall in-between the cylindrical micelles is evidenced with both methods.
6. Bi-continuous and tri-continuous phases
In bi-continuous (figure 5) and tri-continuous cubic (figure 6) phases, the structural units are not individual particles (such as spheres or cylindrical particles) but continuous three-dimensional periodic interfaces and their description require the use of the crystallography of surfaces [34]. To our knowledge, only three different bi-continuous phases has been observed. Their space-groups are (Ia d, Pn
d, Pn m, Im
m, Im m; table 1), corresponding respectively to the three Infinite Periodic Minimal Surfaces (IPMS) G, D and P surfaces. Only one tri-continuous phase [8] of space-group Im
 m has been discovered. We can underline here again that the knowledge of the space-group is not sufficient for the structure identification, as the space-group Im
 m corresponds to three different mesophases (table 1): bcc sphere packing, P-surface bi-continuous cubic phase and the tri-continuous cubic phase. In the latter case, a characteristic feature is that the strongest Bragg reflections are the 321 and 400, indicating that many different structural units are present in the unit cell.
Figure 5.
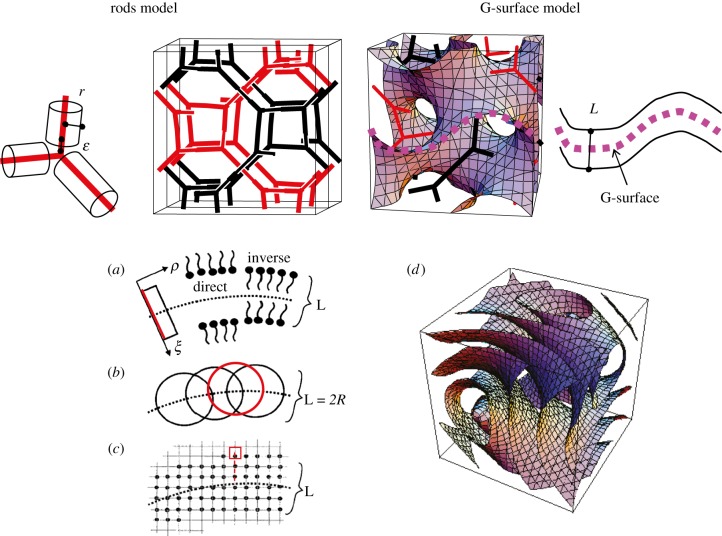
The cubic unit cell for the Ia d bi-continuous phase for the rods model and the G-surface model. Using the G-surface model, different methods can be used [14] to take into account the thickness of the film L (a) a linear profile along the normal at each point of the surface [47] (b) a convolution by an infinitely thin shell [48] (c) a lattice method with the calculation of the distance to the G-surface [49] (d) the iso-density surfaces using the nodal surfaces approximation [50].
Figure 6.
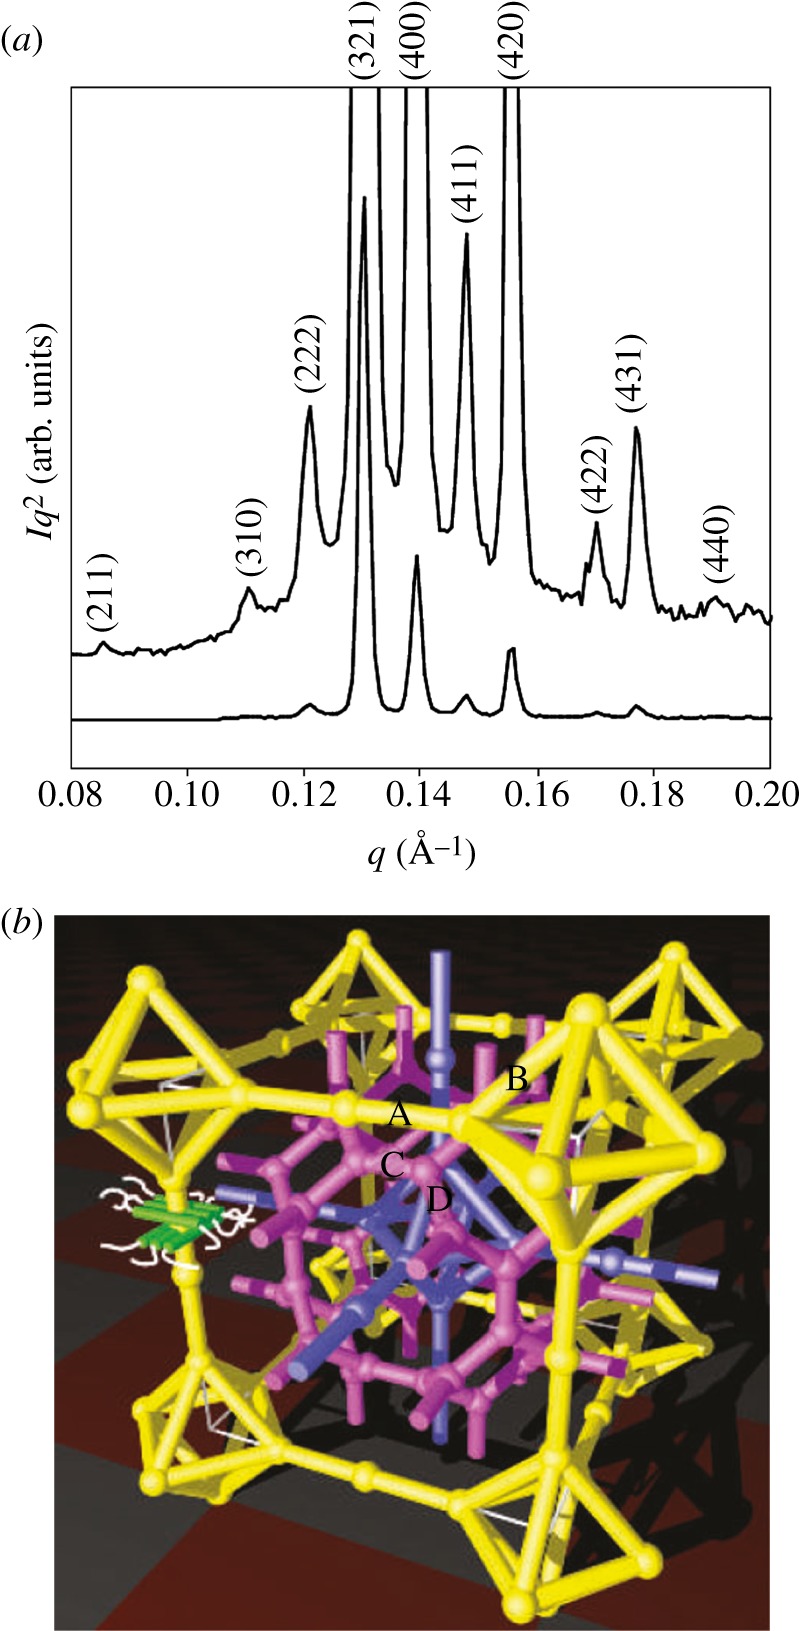
The Im m tri-continuous cubic phase [8]. (a) Powder pattern. (b) Network model derived from the electron density reconstruction. The two identical networks are drawn in yellow and violet and the third one in magenta.
6.1. Bi-continuous Ia3̄d
Since the pioneer work by Luzzati & Spegt [7] who discovered this type of structure in the case of the Ia d space-group about 40 years ago, inverse as well as direct methods have been developed based on the use of the Bragg peaks intensities. We will focus here only on this space-group although similar expressions for SAS can be derived for the two others bi-continuous phases (D and P surfaces).
The main feature in the case of the Ia d space-group is that it gives rise to two strong Bragg reflections, the 211 and the 220 (figure 1 and table 1). Performing an electron density reconstruction based only on the two terms F211 and F220 reproduces well the bi-continuous structure, as shown in electronic supplementary material, figure S2. This is a good illustration of the efficiency of inverse methods to elucidate new structures. Further refinement of the structure can be done by including the other measured Bragg reflections. To solve the phase problem, comparison with electron microscopy images were used for both lipids phases [30] and mesoporous materials [51,52].
The alternative way is to model completely the Bragg intensities using the structure factor of the G-surface. Another possibilty is to calculate the structure factor of the two networks (rods model in figure 5), adding a cylindrical molecular form factor on each rod [7], but this method is less satisfying because it involves one more adjustable parameter, ε, a cut-off on the rods length (figure 5). Using the G-surface model, the structure is described essentially by a film of thickness L and an electron density ρ1, which is centred on the G-surface and separates the two subspaces of density ρ0 with an associated contrast Δρ = |ρ1−ρ0|. Starting from equation (2.9), we get
 |
6.1 |
and, in the limit of an infinitely thin film:
 |
6.2 |
with
 |
6.3 |
The  coefficients are the structure factors of the G-surface and AG = 3.091a2 is the area of the G-surface in the cubic unit cell. We calculated the G-surface structure factors
  using the exact G-surface IPMS [48] and their values are given in electronic supplementary material, table S1 along with more recent calculations [15,47]. Using the approximation of the G-surface by Von Schnering & Nesper [53] by a nodal surface of equation
 |
6.4 |
the calculation of the structure factors is much simplified, and the values (electronic supplementary material, table S1) are close enough to those of the G-surface to be used instead.
To take into account the thickness of the film, L, we introduced a simple method where the points on the G-surface are convoluted in real space by an infinitely thin spherical shell of radius R=L/2 (figure 5) [48]. The main advantage of this method is that the form factor of this spherical shell ( ) appears simply as a product in the expression of Fhkl because of the spherical symmetry of the shell:
 |
6.5 |
where nS is the two-dimensional number density of the shells on the G-surface, and ρS the two-dimensional electron density on a shell. The product nS · ρS is related to the contrast Δρ of the film ( ) and Vfilm can be calculated using the Gauss–Bonnet relation (
 ) [48]. Taking into account the thickness L = 2R, the final expression reads
 |
6.6 |
This model is valid only for sufficiently small values of R with respect to the mean curvature radius of the G-surface, typically for an R/a ratio less than 0.25 [48]. In the intensity expression, a disorder term can be introduced using the Debye–Waller expression (refer to §3.2). More refined models are available in the literature, but without a simple factorization of a spherical form factor. Garstecki & Holyst [15,54–57], Harper et al. [47], Enlow et al. [49] took into account the thickness either by a segment of length L oriented at each point along the normal to the G-surface, or using a lattice model (figure 5). Using parallel nodal surfaces (see equation (6.4) and figure 5), Solovyov et al. [50] obtained a very precise modelization of a mesoporous Ia d phase based on more than 25 Bragg reflections. It is found that the thickness of the silica region is almost constant and homogoenous, with a slightly higher density (10%) at the flat points of the G-surface.
6.2. Tri-continuous Im3̄m
Until now, the tri-continuous Im m phase has been observed only with thermotropic compounds [8,9,58]. However, we believe that mesophase formation again probably results from the segregation between two molecular entities (aliphatic chains and polar cores for these thermotropic compounds) like for the previously mentioned structures. One then expects that new examples of this phase will be discovered in other systems such as lyotropic systems or nano-structured materials. For such complicated topology, the use of a reconstruction method was necessary to elucidate its structure (figure 6) [8,59]. On the basis of the three main Bragg peaks (321, 400 and 420), the reconstruction evidences three interwoven regions in the structure, proving that it is tri-continuous. A network model has been proposed to visualize these three regions, as shown in figure 6. It consists of three networks. Only two of them are identical (drawn in yellow and violet in figure 6b), as the third one (drawn in magenta in figure 6b), located in between the two identical ones, is of a different type. A slightly different model that is also based on three networks has been recently proposed, and it is still in agreement with a tri-continuous structure [60]. For this phase, the challenges remaining are: (i) a visualization based on transmission electron microscopy studies to confirm the SAS results and (ii) a deeper understanding of its structural relationships with the Ia
 d bi-continuous phase. Indeed, a phase transition between these two cubic phases has been observed in several thermotropic systems [8,60].
7. Conclusion
This paper provides a summary of the available structural models for different three-dimensional mesophases. Such complex structures all result from the packing of supra-molecular units having two incompatible molecular blocks and are encountered nowadays in various fields. For example, a recent application of these types of structures is to use them to obtain tunable optical properties, in synthetic nano-structured materials or in biological systems like butterflies wings [61]. Here, we focus on the use of SAS to establish structural models, and introduce two types of methods: the inverse and the direct ones. For sphere packing and two-dimensional hexagonal phases, structural models are easier to derive because there is a straightforward factorization between a form factor and a structure factor in the SAS intensity expression. Then, more elaborated models including disorder terms may be even used for these phases. To investigate tcp packings, inverse methods are preferred because the particles in the unit cell have different form factors. For bi-continuous cubic phases, both methods are available in order to incorporate the film thickness but direct methods are better suited. We propose a simple model based on the convolution in the direct space of the IPMS by a spherical shell that leads to a factorization of its form factor in reciprocal space.
In the near future, two main developments are expected in the structural analysis of mesophases. The first is to include disorder terms of different kinds in the structural models. For example, there is a need to develop models for substitution disorder between different types of particles dealing with more and more elaborated multi-component nano-structured materials. A second challenge will be to introduce quantitatively the interaction potentials between soft deformable entities and to relate them to the mesophase structures, to ultimately predict the phase diagrams. One possible approach may be to measure these interaction potentials in concentrated solutions during mesophase formation using SAS.
Footnotes
The intensity I(q) in absolute scale is in units of the inverse of a length [L−1] usually expressed in cm−1 or mm−1. Experimentally, intensity measurements in absolute scale are made using a calibration sample. For SAXS, one can use the constant intensity contribution of water equal to 0.016 cm−1. For SANS, the constant incoherent scattering signal from a 1 mm thick water (H2O) sample is a widespread standard. In addition, corrections by the transmission of the sample and by the background contribution have to be done using standard procedures.
For an oscillating single crystal (amplitude Δα along a rotation axis Z′Z), the integrated intensity measured for an individual Bragg peak qhkl is divided by Δα|q hklperp|, where |q hklperp| is the component of qhkl perpendicular to Z′Z. Note that Bragg peaks located along the rotation axis Z′Z are not measured.
Note that the sum is performed over all the permutations and signs for each hkl set (containing m terms, where m is the multiplicity) and that the Fhkl, Fkhl, F−hkl … are not always equal and may be related by an extra sign depending on the space group and its symmetry elements. For example, because of the sliding mirrors, Fkhl = (−1)h+k+l Fhkl for the space group Pm3̄n, and F−hkl = (−1)h+k Fhkl and Fkhl = (−1)(h+k+l)/2 Fhkl for the space group Ia3̄ d.
References
- 1.1995. International Tables for Crystallography. Kluwer Academic Publishers [Google Scholar]
- 2.Clerc M. 1996. A new symmetry for the packing of amphiphilic direct micelles. J. Phys. 6, 961–968 10.1051/jp2:1996110 (doi:10.1051/jp2:1996110) [DOI] [Google Scholar]
- 3.Balagurusamy V. S. K., Ungar G., Percec V., Johansson G. 1997. Rational design of the first spherical supramolecular dendrimers self-organized in a novel thermotropic cubic liquid-crystalline phase and the determination of their shape by X-ray analysis. J. Am. Chem. Soc. 119, 1539–1555 10.1021/ja963295i (doi:10.1021/ja963295i) [DOI] [Google Scholar]
- 4.Delacroix H., GulikKrzywicki T., Seddon J. M. 1996. Freeze fracture electron microscopy of lyotropic lipid systems: quantitative analysis of the inverse micellar cubic phase of space groupFd3m (Q227). J. Mol. Biol. 258, 88–103 10.1006/jmbi.1996.0236 (doi:10.1006/jmbi.1996.0236) [DOI] [PubMed] [Google Scholar]
- 5.Ungar G., Liu Y. S., Zeng X. B., Percec V., Cho W. D. 2003. Giant supramolecular liquid crystal lattice. Science, 299, 1208–1211 10.1126/science.1078849 (doi:10.1126/science.1078849) [DOI] [PubMed] [Google Scholar]
- 6.Bates F. S., Lee S., Bluemle M. J. 2010. Discovery of a Frank–Kasper σ phase in sphere-forming block copolymer melts. Science 330, 349–353 10.1126/science.1195552 (doi:10.1126/science.1195552) [DOI] [PubMed] [Google Scholar]
- 7.Luzzati V., Spegt P. A. 1967. Polymorphism of lipids. Nature 215, 701–704 10.1038/215701a0 (doi:10.1038/215701a0) [DOI] [Google Scholar]
- 8.Zeng X. B., Ungar G., Imperor-Clerc M. 2005. A triple-network tricontinuous cubic liquid crystal. Nat. Mater. 4, 562–567 10.1038/nmat1413 (doi:10.1038/nmat1413) [DOI] [PubMed] [Google Scholar]
- 9.Levelut A. M., Clerc M. 1998. Structural investigations on ‘smectic D’ and related mesophases. Liquid Cryst. 24, 105–115 10.1080/026782998207631 (doi:10.1080/026782998207631) [DOI] [Google Scholar]
- 10.Guinier A. 1994. X-ray diffraction: in crystals, imperfect crystals, and amorphous bodies. Dover publications [Google Scholar]
- 11.Pedersen J. S. 2001. Structure factors effects in small-angle scattering from block copolymer micelles and star polymers. J. Chem. Phys. 114, 2839–2846 10.1063/1.1339221 (doi:10.1063/1.1339221) [DOI] [Google Scholar]
- 12.Kotlarchyk M., Chen S. H., Huang J. S., Kim M. W. 1984. Structure of three-component microemulsions in the critical region determined by small angle neutron scattering. Phys. Rev. A 29, 2054–2069 10.1103/PhysRevA.29.2054 (doi:10.1103/PhysRevA.29.2054) [DOI] [Google Scholar]
- 13.Pedersen J. S. 1997. Analysis of small-angle scattering data from colloids and polymer solutions: modeling and least-squares fitting. Adv. Colloid Interface 70, 171–210 10.1016/S0001-8686(97)00312-6 (doi:10.1016/S0001-8686(97)00312-6) [DOI] [Google Scholar]
- 14.Förster S., Timmann A., Konrad M., Schellbach C., Meyer A., Funari S. S., Mulvaney P., Knott R. 2005. Scattering curves of ordered mesoscopic materials. J. Phys. Chem. B 109, 1347–1360 10.1021/jp0467494 (doi:10.1021/jp0467494) [DOI] [PubMed] [Google Scholar]
- 15.Garstecki P., Holyst R. 2002. Scattering patterns of self-assembled cubic phases. II. Analysis of the experimental spectra. Langmuir 18, 2529–2537 10.1021/la011299h (doi:10.1021/la011299h) [DOI] [Google Scholar]
- 16.Arms D. A., Shah R. S., Simmons R. O. 2003. X-ray debye-waller factor measurements of solid 3He and 4He. Phys. Rev. B 67, 094303. 10.1103/PhysRevB.67.094303 (doi:10.1103/PhysRevB.67.094303) [DOI] [Google Scholar]
- 17.Sakya P., Seddon J. M., Templer R. H.,, Mirkin R. J., Tiddy G. J. T. 1997. Micellar cubic phases and their structural relationships: the nonionic surfactant system C12EO12/water. Langmuir 13, 3706–3714 10.1021/la9701844 (doi:10.1021/la9701844) [DOI] [Google Scholar]
- 18.Imai M., Yoshida I., Iwaki T., Nakaya K. 2005. Static and dynamic structures of spherical nonionic surfactant micelles during the disorder-order transition. J. Chem. Phys. 122, 044906. 10.1063/1.1839559 (doi:10.1063/1.1839559) [DOI] [PubMed] [Google Scholar]
- 19.Hales T. C. 2006. Sphere packing. IV. Detailed bounds. Discrete Comput. Geom. OF1–OF16 10.1007/s00454-005-1213-z (doi:10.1007/s00454-005-1213-z) [DOI] [Google Scholar]
- 20.Hales T. C. 2005. A proof of the Kepler conjecture. Ann. Math. 162, 1065–1185 10.4007/annals.2005.162.1065 (doi:10.4007/annals.2005.162.1065) [DOI] [Google Scholar]
- 21.Mau S. C., Huse D. A. 1999. Stacking entropy of hard-sphere crystals. Phys. Rev. E 59, 4396–4401 10.1103/PhysRevE.59.4396 (doi:10.1103/PhysRevE.59.4396) [DOI] [Google Scholar]
- 22.Koch H., Radin C., Sadun L. 2005. Most stable structure for hard spheres. Phys. Rev. E 72, 16708. 10.1103/PhysRevE.72.016708 (doi:10.1103/PhysRevE.72.016708) [DOI] [PubMed] [Google Scholar]
- 23.Zeng X. B., Liu Y. S., Imperor-Clerc M. 2007. Hexagonal close packing of nonionic surfactant micelles in water. J. Phys. Chem. B 111, 5174–5179 10.1021/jp0687955 (doi:10.1021/jp0687955) [DOI] [PubMed] [Google Scholar]
- 24.Shearman G. C., Tyler A. I. I., Brooks N. J., Templer R. H., Ces O., Law R.V., Seddon J. M. 2009. A 3-D hexagonal inverse micellar lyotropic phase. J. Am. Chem. Soc. 131, 1678. 10.1021/ja809280r (doi:10.1021/ja809280r) [DOI] [PubMed] [Google Scholar]
- 25.Tolbert S. H., Schaffer T. E., Feng J. L., Hansma P. K., Stucky G. D. 1997. A new phase of oriented mesoporous silicate thin films. Chem. Mater. 9, 1962–1967 10.1021/cm960454o (doi:10.1021/cm960454o) [DOI] [Google Scholar]
- 26.Anderson J. A., Lorenz C. D., Travesset A. 2008. Micellar crystals in solution from molecular dynamics simulations. J. Chem. Phys. 128, 184906. 10.1063/1.2913522 (doi:10.1063/1.2913522) [DOI] [PubMed] [Google Scholar]
- 27.Hamley I. W., Daniel C., Mingvanish W., Mai S. M., Booth C., Messe L., Ryan A. J. 2000. From hard spheres to soft spheres: the effect of copolymer composition on the structure of micellar cubic phases formed by diblock copolymers in aqueous solution. Langmuir 16, 2508–2514 10.1021/la991035j (doi:10.1021/la991035j) [DOI] [Google Scholar]
- 28.McConnell G. A., Gast A. P. 1996. Predicting disorder–order phase transition in polymeric micelles. Phys. Rev. E 54, 5447–5455 10.1103/PhysRevE.54.5447 (doi:10.1103/PhysRevE.54.5447) [DOI] [PubMed] [Google Scholar]
- 29.Kamien R. D., Ziherl P. 2001. Maximizing entropy by minimizing area: towards a new principle of self-organization. J. Phys. Chem. B 105, 10 147–10 158 10.1021/jp010944q (doi:10.1021/jp010944q) [DOI] [Google Scholar]
- 30.Mariani P., Luzzati V., Delacroix H. 1988. Cubic phases of lipid—containing systems: structure analysis and biological implications. J. Mol. Biol. 204, 165–189 10.1016/0022-2836(88)90607-9 (doi:10.1016/0022-2836(88)90607-9) [DOI] [PubMed] [Google Scholar]
- 31.Garcia-Bennett A. E., Kupferschmidt N., Sakamoto Y., Che S., Terasaki O. 2005. Synthesis of mesocage structures by kinetic control of self-assembly in anionic surfactants. Angew. Chem., Int. Ed. 44, 5317–5322 10.1002/anie.200500113 (doi:10.1002/anie.200500113) [DOI] [PubMed] [Google Scholar]
- 32.Charvolin J., Sadoc J. F. 1988. Periodic systems of frustrated fluid films and « micellar » cubic structures in liquid crystals. J. Phys. France 49, 521–526 10.1051/jphys:01988004903052100 (doi:10.1051/jphys:01988004903052100) [DOI] [Google Scholar]
- 33.Ungar G., Zeng X. B. 2005. Frank–Kasper, quasicrystalline and related phases in liquid crystals. Soft Matter 1, 95–106 10.1039/b502443a (doi:10.1039/b502443a) [DOI] [PubMed] [Google Scholar]
- 34.Sadoc J. F. 1990. Geometry in condensed matter physics. World Scientific Publishing [Google Scholar]
- 35.Weaire D., Phelan R. 1994. A counterexample to Kelvin's conjecture on minimal surfaces. Phil. Mag. Lett. 69, 107–110 10.1080/09500839408241577 (doi:10.1080/09500839408241577) [DOI] [Google Scholar]
- 36.Rivier N. 1994. Kelvin's conjecture on minimal froths and the counter-example of Weaire and Phelan. Phil. Mag. Lett. 69, 297–303 10.1080/09500839408241607 (doi:10.1080/09500839408241607) [DOI] [Google Scholar]
- 37.Kamien R. D., Kung W., Ziherl P. 2004. The foam analogy: from phases to elasticity. J. Colloid Interface Sci. 275, 539–547 10.1016/j.jcis.2004.03.009 (doi:10.1016/j.jcis.2004.03.009) [DOI] [PubMed] [Google Scholar]
- 38.Sakamoto Y., Kaneda M., Terasaki O., Zhao D. Y., Kim J. M., Stucky G., Shim H. J., Ryoo R. 2000. Direct imaging of the pores and cages of three-dimensional mesoporous materials. Nature 408, 449–453 10.1038/35044040 (doi:10.1038/35044040) [DOI] [PubMed] [Google Scholar]
- 39.Anderson M. W., Egger C. C., Tiddy G. J. T., Casci J. L., Brakke K. A. 2005. A new minimal surface and the structure of mesoporous silicas. Angew. Chem. Int. Ed. 44, 3243–3248 10.1002/anie.200462295 (doi:10.1002/anie.200462295) [DOI] [PubMed] [Google Scholar]
- 40.Sakamoto Y., Terasaki O. 2011. A layer stacking with large repeating unit in multi-modal cage-type anionic-surfactant-templated silica mesoporous crystal. Solid State Sci. 13, 762–767 10.1016/j.solidstatesciences.2010.04.006 (doi:10.1016/j.solidstatesciences.2010.04.006) [DOI] [Google Scholar]
- 41.Imperor-Clerc M., Davidson P., Davidson A. 2000. Existence of a microporous corona around the mesopores of silica-based sba-15 materials templated by triblock copolymers. J. Am. Chem. Soc. 122, 11 925–11 933 10.1021/ja002245h (doi:10.1021/ja002245h) [DOI] [Google Scholar]
- 42.Palmqvist A. E. C., Sundblom A., Oliveira C. L. P., Pedersen J. S. 2009. Modeling in situ small-angle X-ray scattering measurements following the formation of mesostructured silica. J. Phys. Chem. C 113, 7706–7713 10.1021/jp809798c (doi:10.1021/jp809798c) [DOI] [Google Scholar]
- 43.Manet S., et al. 2011. Kinetics of the formation of a 2D-hexagonal silica nano-structured materials by non-ionic copolymer templating in solution. J. Phys. Chem. B 115, 11 330–11 344 10.1021/jp200213k (doi:10.1021/jp200213k) [DOI] [PubMed] [Google Scholar]
- 44.Glatter O., Freiberger N. 2006. Small-angle scattering from hexagonal liquid crystals. J. Phys. Chem. B 110, 14 719–14 727 10.1021/jp0559332 (doi:10.1021/jp0559332) [DOI] [PubMed] [Google Scholar]
- 45.Khodakov A. Y., Zholobenko V. L., Imperor-Clerc M., Durand D. 2005. Characterization of the initial stages of SBA-15 synthesis by in situ time-resolved small-angle X-ray scattering. J. Phys. Chem. B 109, 22 780–22 790 10.1021/jp052786z (doi:10.1021/jp052786z) [DOI] [PubMed] [Google Scholar]
- 46.Linden M., Flodstrom K., Teixeira C. V., Amenitsch H., Alfredsson V. 2004. In situ synchrotron small-angle x-ray scattering/x-ray diffraction study of the formation of SBA-15 mesoporous silica. Langmuir 20, 4885–4891 10.1021/la049637c (doi:10.1021/la049637c) [DOI] [PubMed] [Google Scholar]
- 47.Harper P. E., Gruner S. M., Lewis R. N. A. H., McElhaney R. N. 2000. Electron density modeling and reconstruction of infinite periodic minimal surfaces (IPMS) based phases in lipid-water systems. II. Reconstruction of D surface based phases. Eur. Phys. J. E 2, 229–245 10.1007/PL00013664 (doi:10.1007/PL00013664) [DOI] [Google Scholar]
- 48.Clerc M., Duboisviolette E. 1994. X-ray scattering by bicontinuous cubic phases. J. Phys. 4, 275–286 10.1051/jp2:1994128 (doi:10.1051/jp2:1994128) [DOI] [Google Scholar]
- 49.Enlow J. D., Enlow R. L., McGrath K. M., Tate M. W. 2004. Modeling liquid crystal bilayer structures with minimal surfaces. J. Chem. Phys. 120, 1981–1989 10.1063/1.1635811 (doi:10.1063/1.1635811) [DOI] [PubMed] [Google Scholar]
- 50.Solovyov L. A., Belousov O. V., Dinnebier R. E., Shmakov A. N., Kirik S. D. 2005. X-ray diffraction structure analysis of MCM-48 mesoporous silica. J. Phys. Chem. B 109, 3233–3237 10.1021/jp0482868 (doi:10.1021/jp0482868) [DOI] [PubMed] [Google Scholar]
-
51.Sakamoto Y., Kim T. W., Ryoo R., Terasaki O.
2004.
Three-dimensional structure of large-pore mesoporous cubic Ia
 d silica with complementary pores and its carbon replica by electron crystallography. Angew. Chem. Int. Ed.
43, 5231–5234 10.1002/anie.200460449 (doi:10.1002/anie.200460449) [DOI] [PubMed] [Google Scholar]
 - 52.Zhao D. Y., et al. 2004. Facile synthesis and characterization of novel mesoporous and mesorelief oxides with gyroidal structures. J. Am. Chem. Soc. 126, 865–875 10.1021/ja037877t (doi:10.1021/ja037877t) [DOI] [PubMed] [Google Scholar]
- 53.Vonschnering H. G., Nesper R., 1991. Nodal surfaces of fourier series: fundamental invariants of structured matter. Z. Phys. B, Condens. Matter 83, 407–412 10.1007/BF01313411 (doi:10.1007/BF01313411) [DOI] [Google Scholar]
- 54.Garstecki P., Holyst R. 2000. Surfaces, interfaces, and materials—scattering on triply periodic minimal surfaces—the effect of the topology, Debye–Waller, and molecular form factors. J. Chem. Phys. 113, 3772–3779 10.1063/1.1287426 (doi:10.1063/1.1287426) [DOI] [Google Scholar]
- 55.Garstecki P., Holyst R. 2001. Periodic surfaces of simple and complex topology: comparison of scattering patterns. Phys. Rev. E 64, 021501. [DOI] [PubMed] [Google Scholar]
- 56.Garstecki P., Holyst R. 2001. Scattering patterns of self-assembled gyroid cubic phases in amphiphilic systems. J. Chem. Phys. 115, 1095–1099 10.1063/1.1379326 (doi:10.1063/1.1379326) [DOI] [Google Scholar]
- 57.Garstecki P., Holyst R. 2003. Scattering patterns of multiply continuous cubic phases in block copolymers. I. The model. Macromolecules 36, 9181–9190 10.1021/ma0212588 (doi:10.1021/ma0212588) [DOI] [Google Scholar]
- 58.Imperor-Clerc M. 2005. Thermotropic cubic mesophases. Curr. Opin. Colloid Interface Sci. 9, 370–376 10.1016/j.cocis.2004.12.004 (doi:10.1016/j.cocis.2004.12.004) [DOI] [Google Scholar]
-
59.Ungar G., Zeng X. B., Cseh L. L., Mehl G. H.
2008.
Testing the triple network structure of the cubic Im
 m (I) phase by isomorphous replacement and model refinement. J. Mater. Chem.
18, 2953–2961 10.1039/b805965a (doi:10.1039/b805965a) [DOI] [Google Scholar]
 - 60.Kutsumizu S., Mori H., Saito K., Yarnamoto K., Sakurai S., Sakajiri K. 2010. Temperature-jump time-resolved X-ray diffraction study of cubic-cubic phase-transition kinetics in thermotropic cubic mesogen 1,2-Bis(4'-n-alkoxybenzoyl)hydrazines (BABH-n). Langmuir 26, 11 605–11 608 10.1021/la101553j (doi:10.1021/la101553j) [DOI] [PubMed] [Google Scholar]
- 61.Saranathan V., Osuji C. O., Mochrie S. G. J., Noh H., Narayanan S., Sandy A., Dufresne E. R., Prum R. O. 2010. Structure, function, and self-assembly of single network gyroid (I4132) photonic crystals in butterfly wing scales. Proc. Natl Acad. Sci. USA 107, 11 676–11 681 10.1073/pnas.0909616107 (doi:10.1073/pnas.0909616107) [DOI] [PMC free article] [PubMed] [Google Scholar]


