Abstract
Hematopoietic stem cell (HSC) function is tightly regulated by cytokine signaling. Although phospho-flow cytometry allows us to study signaling in defined populations of cells, there has been tremendous hurdle to carry out this study in rare HSCs due to unrecoverable critical HSC markers, low HSC number, and poor cell recovery rate. Here, we overcame these difficulties and developed a “HSC phospho-flow” method to analyze cytokine signaling in murine HSCs at the single-cell level and compare HSC signaling profile to that of multipotent progenitors (MPPs), a cell type immediately downstream of HSCs, and commonly used Lin− cKit+ cells (LK cells, enriched for myeloid progenitors). We chose to study signaling evoked from three representative cytokines, stem cell factor (SCF) and thrombopoietin (TPO) that are essential for HSC function, and granulocyte macrophage-colony stimulating factor (GM-CSF) that is dispensable for HSCs. HSCs display a distinct TPO and GM-CSF signaling signature from MPPs and LK cells, which highly correlates with receptor surface expression. In contrast, although majority of LK cells express lower levels of cKit than HSCs and MPPs, SCF-evoked ERK1/2 activation in LK cells shows a significantly increased magnitude for a prolonged period. These results suggest that specific cellular context plays a more important role than receptor surface expression in SCF signaling. Our study of HSC signaling at the homeostasis stage paves the way to investigate signaling changes in HSCs under conditions of stress, aging, and hematopoietic diseases.
Keywords: hematopoietic stem cells, multipotent progenitors, TPO signaling, SCF signaling, phospho-flow cytometry
Introduction
The hematopoietic system is generated and maintained by a rare population of cells, termed hematopoietic stem cells (HSCs), which can self-renew and produce all the lineages of blood cells throughout life1. In mice, HSCs are well defined based on their characteristic expression of surface markers and can be highly purified from bone marrow in adulthood for research purposes2, 3, making it a paradigm for understanding the biology of tissue stem cells. HSC function is tightly regulated by cytokines acting through their receptors. The importance of individual cytokine signaling in regulating HSC activity is clearly demonstrated by various HSC defects identified in mouse models deficient for specific cytokines or their respective receptors. For example, in mice deficient for Stem cell factor (SCF) or its receptor cKit4, the numbers of HSCs and various progenitors are greatly reduced. In mice deficient for Thrombopoietin (TPO) or its receptor Mpl, HSC quiescence and self-renewal capability are significantly impaired5–9. Furthermore, many factors and cytokines can promote ex vivo expansion of human cord blood HSCs10 and mouse bone marrow HSCs11. However, the signaling mechanisms underlying the regulation of HSC activity, until now, remain unknown because the limited number of murine HSCs makes it impossible to carry out any investigation of cytokine signaling in this rare population using conventional Western blot analysis.
Phospho-flow, a highly sensitive and quantitative technique to measure phosphorylated signaling proteins using flow cytometry12, has become a standard tool to study cell signaling in defined populations of cells in immunology and cancer biology. Using this technology, we and others analyzed signaling pathways in various heterogeneous populations of cells, including Lin− cKit+ cells (LK cells, enriched for myeloid progenitors), sorted Lin− Sca1+ cKit+ cells (LSK cells), or sorted LSK CD34− cells.13–16. HSCs only consist a small fraction, varying from 0.5% to 3%, of these heterogeneous cell populations. Thus, signaling changes observed in these cells may not truthfully reflect those in HSCs.
Although phospho-flow has been successfully used to study cells that comprise ~0.3–3% of bone marrow cells, such assay has not been able to apply on the extremely rare HSCs (~0.01% of bone marrow cells) due to the following difficulties. First, we could not analyze phospho-proteins directly in defined HSCs using total bone marrow cells because not all the antigens used to define HSCs can survive the harsh phospho-flow procedure (Scenario I, Supplementary Figure 1). In our previous studies, we found that at least one of the key HSC markers, Sca1, is unsuitable for the phospho-flow analysis17. Second, it is not practical to perform standard phospho-flow directly on highly purified HSCs due to the low HSC number and poor cell recovery rate (Scenario II, Supplementary Figure 1). Following a protocol previously established and described3, we routinely obtained ~500–800 HSCs per mouse after flow cytometric sorting. When these highly purified HSCs were directly used in phospho-flow, the cell recovery rate was less than 10%. To analyze a single pathway under unstimulated and one cytokine stimulated conditions, we had to pool HSCs purified from at least 10–15 mice.
Here, we developed a “HSC phospho-flow” method to robustly analyze activation of multiple important signaling proteins in well-defined HSCs (CD41− CD48− Ter119− B220-Gr1− CD150+ cKit+ Sca1+ cells) at the single-cell level. We compared HSC signaling profile to that of multipotent progenitors (MPPs), a cell type immediately downstream of HSCs, and commonly used LK cells (enriched for myeloid progenitors). Signaling evoked from three representative cytokines was examined: SCF, TPO, and GM-CSF (granulocyte macrophage-colony stimulating factor). SCF is essential for both HSCs and progenitor cells; TPO is important for HSC function and megakaryocyte differentiation; GM-CSF is dispensable for HSCs and mainly regulates granulocyte and macrophage differentiation18–20. Our results identify a profile of TPO and GM-CSF signaling in HSCs distinct from that in MPPs and LK cells. TPO and GM-CSF signaling in these three populations of cells correlate well with relative expression levels of their respective receptors. In contrast, although majority of LK cells express lower levels of cKit than HSCs and MPPs, SCF-evoked ERK1/2 activation in LK cells shows a significantly increased magnitude for a prolonged period. Together, our study of HSC signaling at their homeostasis stage paves the way to investigate signaling changes in HSCs under various pathological conditions.
Materials and Methods
Mice
Mpl−/− mice (Genentech Inc.) were maintained in a pure C57BL/6 genetic background (>N10)21. Six-eight week old C57BL/6 wild-type mice were purchased from the Jackson Laboratories. All experiments were conducted with the ethical approval of International Association for Assessment and Accreditation of Laboratory Animal Care at the University of Wisconsin-Madison and the Children's Hospital of Philadelphia.
Evaluation of HSC surface markers in the standard phospho-flow procedure
Ten million of total bone marrow cells were resuspended in 1 ml PBS/10% FBS in a 5 ml FACS tube (BD Biosciences) and fixed with 16% paraformaldehyde (Electron Microscopy Sciences) at a final concentration of 2% for 10 minutes at 37°C. Equal volume of PBS was added and mixed by vortexing to terminate fixation. The fixed cells were then collected by centrifugation at room temperature (RT) at 800g for 5min with a low deceleration speed (Allegra X-15R Centrifuge, Beckman Coulter). The residual paraformaldehyde was thoroughly removed by washing the cells twice with 4 ml PBS. Following fixation, cells were permeabilized by slowly adding 2 ml ice-cold 95% methanol (Electron Microscopy Sciences) while vortexing at a low speed. Cells were incubated on ice for 20 minutes and kept at −20°C overnight.
Next day, equal volume of PBS was added and supernatant was aspirated after centrifugation described above. Cells were washed twice with 4 ml PBS and resuspended in 1 ml HBSS/4% PBS. Cells were incubated at 4°C for 1 hour for rehydration and aliquoted into multiple tubes for subsequent staining. Fc blocker (1:200, eBiosciences) was added to each sample and incubated on ice for 15 minutes. FITC-conjugated antibodies against CD48, CD41, Ter119, B220, and Gr1 as well as PE-conjugated antibodies against cKit and CD150, and their corresponding isotype controls were added to the cells as described in details in Supplementary Table 1. Cells were incubated with antibodies at RT for 30 minutes. The stained cells were washed once with PBS and finally resuspended in 400μl PBS for flow cytometric analysis. Flow data were collected using a FACS Calibur (BD Biosciences) and analyzed by the FlowJo software (v9.0.2, TreeStar).
Enrichment of Sca1+ cells
The density of bone marrow cells was adjusted to 40–100 million/ml in PBS/0.5% BSA. After incubation with Fc blocker for 15 minutes on ice, cells were incubated with Biotinconjugated Sca1 antibody on ice for 15 minutes. The unbound antibodies were washed away using PBS/0.5% BSA. Cells were resuspended at a density of ~100 million/ml in PBS/0.5% BSA/2 mM EDTA and incubated with anti-Biotin micro beads (400 μ/ml) on ice for 15 minutes. After washing with PBS/0.5% BSA/2 mM EDTA, cells were resuspended in 1ml PBS/0.5% BSA/2 mM EDTA and passed through a 25 μm strainer before separation. The Sca1 positive cells were enriched using an AutoMACS (Miltenyi Biotec) with the Possel_S program.
Flow cytometric sorting of Sca1+ enriched cells
Sca1+ enriched cells were simultaneously labeled for CD150 and CD41. After washing, cells were passed through a 25 μm strainer and DAPI (Invitrogen) was added (1:2,000) right before sorting. CD150+ CD41− and CD150− CD41− cells were sorted using a FACS AriaII (BD Biosciences) with a 100 μm nozzle and 12 psi at a processing speed of 2000 events/second. A portion of sorted cells was routinely analyzed by the same sorter to confirm the purity (Fig. S2). It usually takes 30–40 minutes to sort Sca1+ enriched cells from one mouse.
Phospho-flow analysis in HSCs, MPPs, and LK cells
Phospho-flow analysis of phospho-proteins was performed essentially as described14 with following modifications. Briefly, sorted CD150+ CD41− and CD150− CD41− cells were aliquoted into multiple tubes (1 ml per tube) at a density of 100,000–1,000,000 cells/ml. Cells were deprived of serum and cytokines in Starvation Medium (IMDM/1% BSA) for 30 minutes at 37°C and stimulated with different cytokines at various doses for 10 minutes (unless specified) at 37°C. The stimulated cells were fixed and permeabilized. To retain as many cells as possible, cells were resuspended solely by gentle pipetting and a residual volume of ~150ul was left at each washing step. At the antibody-staining step, antibodies against specific phospho-proteins were added first and incubated at RT for 30 minutes in dark before adding all the other antibodies. In the cases of detecting pERK1/2 and pAkt, after incubation with primary antibodies, cells were washed once before adding Alexa 647-conjugated secondary antibodies and all the other antibodies. FITC-conjugated antibodies against B220, Ter119, Gr1, and CD48, and PE-conjugated antibodies against cKit were used to define HSCs and MPPs as described in details in Supplementary Table 1. Phospho-flow analysis in LK cells was carried out as described14. Phospho-flow data were collected using a FACS Calibur (BD Biosciences) and analyzed using the FlowJo software (v9.0.2, TreeStar).
Analysis of MPL expression level
Mouse bone marrow cells were isolated from C57BL6/J or Mpl−/− mice and treated with Ammonium Chloride Solution (StemCell Technologies) to lyse late erythroblasts and enucleated red blood cells prior to staining. Bone marrow cells were incubated with Fc blocker, then stained with the antibody cocktail [FITC-(CD41, CD48, B220, Gr1, TER119), PerCP-Cy5.5-Sca1,APC-cKit, and PECy7-CD150]. MPL expression level was measured by primarily staining with anti-mouse Mpl polyclonal antibodies 21, 22 followed by goat anti-rabbit PE-conjugated secondary antibody (Jackson ImmunoResearch). Data were collected using a LSR Fortessa (BD Biosciences) and analyzed using the FlowJo software (v9.0.2, TreeStar).
Results
Development of “HSC phospho-flow” method
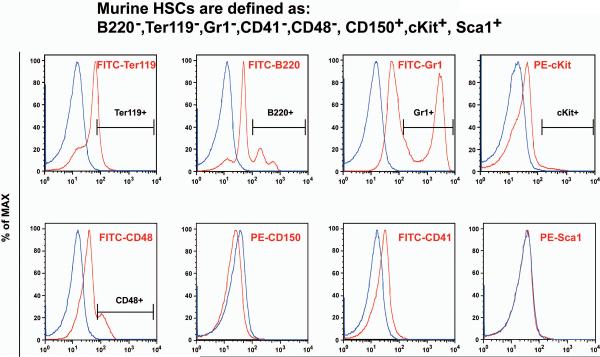
To study cytokine signaling in well-defined murine HSCs, we first evaluated all the HSC markers using the standard phospho-flow protocol and identified the ones not suitable for this procedure. FITC-conjugated antibodies against CD48, Ter119, B220, and Gr1 as well as PE-conjugated antibody against cKit could be directly used in this procedure, while FITC-conjugated antibodies against CD41 and PE-conjugated antibodies against CD150 and Sca1 failed to recognize antigens after fix/permeabilization treatment (Figure 1). Based on these results, we decided to use Sca1, CD150 and CD41 for initial enrichment of HSCs from total bone marrow cells before the phospho-flow procedure.
Figure 1. Evaluation of HSC surface markers using the standard phospho-flow procedure.
Murine HSCs are defined as CD41− CD48− Ter119− B220− Gr1− CD150+ cKit+ Sca1+ cells. Total bone marrow cells were freshly isolated from C57BL/6 mice and subjected to the standard phospho-flow procedure. Cells were labeled with individual HSC surface markers or their corresponding isotype controls. Results are presented as overlaid histograms of individual pairs of antibodies and their controls. Positive populations are indicated on the graphs.
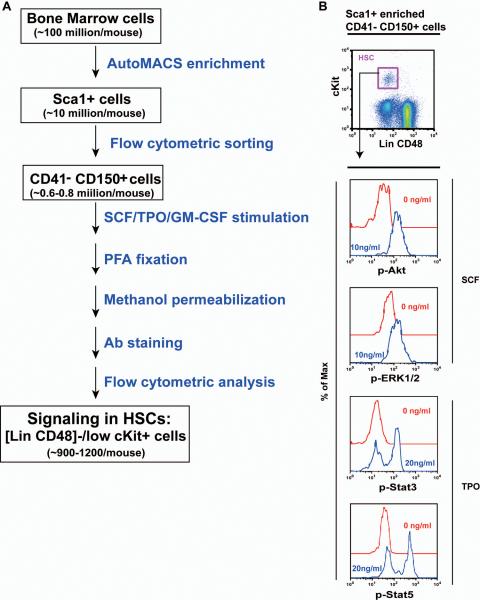
Second, we optimized the HSC enrichment procedure to maximize the purity, viability, and recovery efficiency of target cell population. This procedure involves an initial enrichment of Sca1+ cells using AutoMACS followed by a flow cytometric sorting of CD41− CD150+ cells (Figure 2A). The Sca1 enrichment step typically yields ~10 million cells per mouse, while ~0.6–0.8 million CD41− CD150+ cells are routinely recovered per mouse. Subsequent reanalysis of sorted cells showed that the cell viability and purity are consistently above 95% (Figure S2). The sorted cells from a single mouse were adequate for 3–4 signaling analysis in HSCs (see below).
Figure 2. HSCs are highly responsive to SCF and TPO stimulation.
(A) Flow chart of the developed “HSC phospho-flow” method. (B) Sca1+ enriched, CD150+ CD41− bone marrow cells were serum- and cytokine-starved for 30 minutes and stimulated with 10 ng /ml of SCF or 20 ng/ml of TPO for 10 minutes at 37°C. Levels of phosphorylated ERK1/2, Akt, Stat3, and Stat5 were measured using phospho-specific flow cytometry. HSCs (defined as [Lin CD48]−/low cKit+ cells) were gated for data analysis. Representative gating strategy and plots of phosphorylated signaling proteins are shown (n= 6).
Third, we modified the current phospho-flow protocol, in particular at cell handling steps to minimize cell loss (See details in Materials and Methods). Thus, approximately 30–35% of cells were routinely recovered for data analysis, and HSCs consisted of ~0.5–0.7% of analyzed cells.
As a proof of principle, we examined SCF-evoked activation of Akt and ERK1/2 as well as TPO-evoked activation of Stat3 and Stat5 in [Lin (Ter119 B220 Gr1) CD48]−/low cKit+ cells, which represent HSCs (Figure 2B). All the 4 signaling pathways were significantly activated in HSCs upon cytokine stimulation. We estimate that ~900–1,200 HSCs per mouse are analyzed for signaling and data are usually collected from 300–400 HSCs per data point. In our hands, we could perform up to 6–8 signaling analysis per mouse with data collected from ~150 HSCs per data point. These results were essentially same as the ones with 300–400 HSCs.
HSCs display a distinct TPO and GM-CSF signaling profile from their downstream progenitors
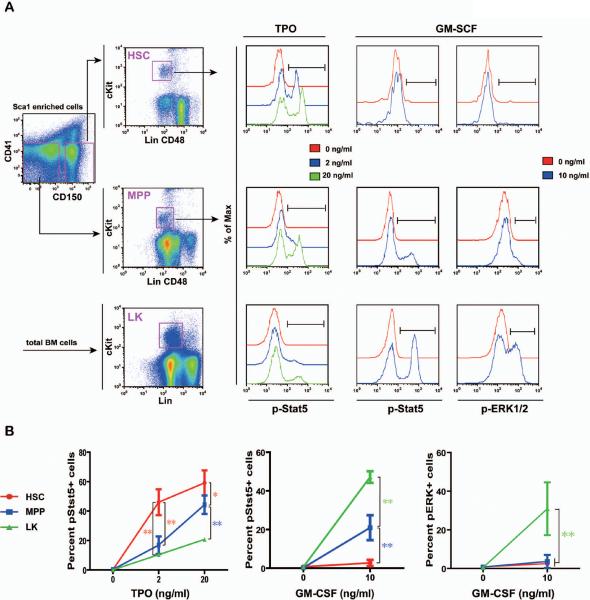
To determine whether HSCs express a distinct signaling signature from other progenitor cells, we examined multiple signaling pathways evoked from various cytokines in HSCs, multipotent progenitors (MPPs, a cell type immediately downstream of HSCs and defined as CD41− CD48− TER119− B220− Gr1− CD150− cKit+ Sca1+ cells) 2, and heterogeneous Lin− (CD3, CD4, CD8, B220, Ter119, and Gr1) cKit+ cells (LK cells, enriched for myeloid progenitors) (Figure 3). Cells enriched for HSCs and MPPs were sorted in parallel as CD150+ CD41− cells and CD150− CD41− cells respectively and processed similarly in the following phospho-flow steps, while LK cells were defined and analyzed directly from total bone marrow cells as described 14. Upon TPO stimulation, a significant fraction but not all of HSCs were activated in a dose-dependent manner. Although a similar fraction of MPPs were also activated by TPO, the extent of Stat5 action was significantly lower compared to that in HSCs. It is not surprising that only a small fraction of LK cells were activated upon TPO stimulation because TPO-responsive HSCs and MPPs only consist of a small percentage of LK cells. Our result is consistent with a previous report, which shows only ~5% of Lin− cKit+ Sca1− cells express Mpl 21. When stimulated with GM-CSF at its saturated concentration, activation of ERK1/2 and Stat5 were not detectable at all in HSCs. In contrast, a minor but distinct population of MPPs was activated by GM-CSF, and a significant fraction of LK cells were highly responsive to GM-CSF stimulation. The responses of HSCs, MPPs, and LK cells to GM-CSF stimulation highly correlate with the known GM-CSF expression patterns 19. These results indicate that HSCs show a distinct TPO and GM-CSF signaling profile from MPPs and LK cells.
Figure 3. HSCs display a distinct TPO and GM-CSF signaling profile from highly purified MPPs and heterogeneous LK cells.
Total bone marrow cells were freshly isolated from C57BL/6 mice and enriched for Sca1+ cells. CD150+ CD41− cells (enriched for HSCs) and CD150− CD41− cells (enriched for MPPs) were subsequently sorted from Sca1+ enriched cells. Sorted cells were equally divided into a few aliquots, serum- and cytokine-starved for 30 minutes, and stimulated with 2 or 20 ng /ml of TPO or 10 ng/ml of GM-CSF for 10 minutes at 37°C. Levels of phosphorylated ERK1/2 and Stat5 were measured using phospho-specific flow cytometry. HSCs (defined as [Lin CD48]−/low cKit+ cells from sorted CD150+ CD41− cells) and MPPs (defined as [Lin CD48]−/low cKit+ cells from sorted CD150− CD41− cells) were gated for data analysis. LK cells (defined as Lin−/low cKit+ cells) were directly gated and analyzed from nonneutrophilic total bone marrow cells. (A) Representative gating strategy and plots of phosphorylated signaling proteins are shown (n= 4–7). pStat5+ or pERK+ cells are defined on each plot. (B) The percentages of pStat5+ or pERK+ cells are shown as mean + s.d.. Student's t-test was performed: * p<0.05 and ** p<0.01. Note: The Lin cocktail used to define HSCs and MPPs includes Ter119, B220, and Gr1, whereas the Lin cocktail used to define LK cells includes CD3, CD4, CD8, Ter119, B220, and Gr1.
HSCs express higher levels of surface Mpl than MPPs
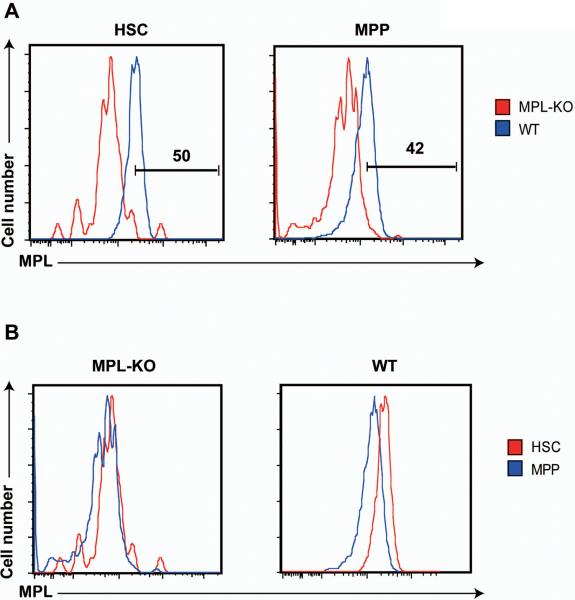
We examined Mpl surface expression in defined HSCs and MPPs to determine whether heterogeneous responses to TPO stimulation and significantly different TPO signaling in HSCs and MPPs correlate with differential expression levels of Mpl in these cells (Figure 4). Mpl deficient HSCs and MPPs served as negative controls. Indeed, only ~50% of HSCs and ~40% of MPPs expressed Mpl at detectable levels (Figure 4A). Interestingly, although the levels of background staining in Mpl deficient HSCs were comparable to those in Mpl deficient MPPs, Mpl surface expression in wild-type HSCs was significantly higher than that in wild-type MPPs (Figure 4B). These results indicate that both HSCs and MPPs are heterogeneous in Mpl surface expression and expression levels of Mpl in HSCs are higher than those in MPPs. Thus, different TPO signaling in HSCs and MPPs is mainly due to differential Mpl surface expression in these cells.
Figure 4. HSCs show higher Mpl surface expression than MPPs.
Total bone marrow cells were isolated from C57BL/6 and Mpl−/− (Mpl-KO) mice. HSCs and MPPs are defined as described in Figure 3. (A) Representative histograms of Mpl surface expression in HSCs and MPPs from wild-type (blue line) and Mpl−/− mice (red line). Percentages of Mpl+ cells are indicated on the plots. (B) Cross comparison of Mpl surface expression in HSCs (red line) and MPPs (blue line) from wild-type and Mpl−/− mice.
HSCs and MPPs respond to SCF stimulation with a different amplitude and kinetics from LK cells
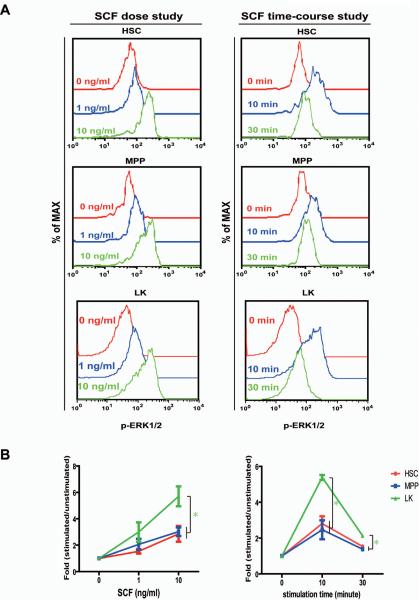
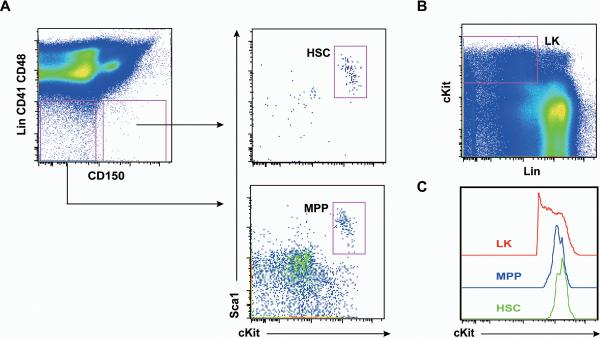
We further studied SCF-evoked ERK1/2 activation in HSCs, MPPs, and LK cells (Figure 5). Unlike TPO and GM-CSF, which activated downstream signaling in a fraction of cells, SCF activated the ERK1/2 pathway in all of these cells. This result is consistent with our expectation because these cells are all defined as cKit+ cells. Quantitative analysis of dose-dependent and time-course studies showed that ERK1/2 activation in HSCs was indistinguishable from that in MPPs. However, compared to HSCs and MPPs, LK cells displayed significantly increased magnitude and prolonged activation of ERK1/2. These results were further confirmed by comparison of SCF signaling in LK, LK Sca1+, and LK Sca1− cells (Figure S3). To determine whether the differential SCF signaling correlates with cKit surface expression as in the case of TPO signaling, we analyzed cKit expression levels in HSCs, MPPs, and LK cells (Figure 6). To our surprise, HSCs expressed higher levels of cKit than MPPs. Although LK cells expressed cKit in a much wider range, cKit surface expression in majority of LK cells was significantly lower than that in HSCs and MPPs. These results suggest that different SCF signaling in HSCs, MPPs, and LK cells is determined by specific cellular context.
Figure 5. HSCs and MPPs respond to SCF stimulation with a different amplitude and kinetics from LK cells.
The CD150+ CD41− cells and CD150− CD41− cells were simultaneously sorted from Sca1+ enriched bone marrow cells and stimulated with 1 or 10 ng/ml of SCF (dose study), or 10 ng/ml of SCF for 10 or 30 minutes (time-course study) as described in Figure 3. Levels of phosphorylated ERK1/2 (p-ERK1/2) were measured in HSCs, MPPs, and LK cells as described in Figure 3. (A) Representative plots of p-ERK1/2 are shown. (B) To quantify the activation of ERK1/2, median intensities of p-ERK1/2 at different SCF concentrations or stimulated for different periods are compared to their respective control cells at 0 ng/ml or 0 minute, which are arbitrarily set at 1. Quantification of 4–8 independent experiments is shown as mean ± s.d.. Green asterisks indicate significant differences of LK cells compared to HSCs and MPPs (p<0.05).
Figure 6. Majority of LK cells express lower levels of cKit than HSCs and MPPs.
Representative gating of live HSCs and MPPs (A) and LK cells (B). (C) Histograms of cKit surface expression in HSCs, MPPs, and LK cells.
Discussion
Although phospho-flow cytometry allows us to study signaling in defined populations of cells, it is impossible, until now, to carry out this study in rare HSCs due to unrecoverable critical HSC markers, low HSC number, and poor cell recovery rate. We overcame these difficulties and developed “HSC phospho-flow” method to measure cytokine signaling in rare HSCs at the single-cell level at their homeostasis stage. Our data clearly demonstrate that it is necessary and important to study cytokine signaling in well-defined HSCs rather than in mixed cells containing HSCs when we investigate signaling mechanisms underlying HSC functional changes. Because of the heterogeneity within well-defined HSCs and MPPs, single-cell measurements of phospho-protein responses could reveal shifts in signaling potential under different conditions, allowing for classification of cellular phenotypes based on their multidimensional signaling profiles. In this study, we analyzed a large number of markers (Lin and CD48) in one single channel (FITC). Although this practice is routinely performed in the HSC field2, 3 and should not affect our results, it would be optimal to use CD48 in a separate channel.
The general principle of “HSC phospho-flow” method, which uses markers not suitable for phospho-flow to initially enrich target cells and uses markers suitable for phospho-flow in direct analysis, might be applied to analyze other types of rare cells. We acknowledge that each system presents its own unique challenges and substantial optimization might be required to develop a similar method in different systems. Nonetheless, we believe that it is highly practical to robustly measure signaling in rare cells representing more than 0.01% of total cells as shown for HSCs in our study.
The heterogeneous TPO responses we observed in HSCs and MPPs are highly consistent with levels of Mpl surface expression (Figures 3 and 4). However, given the profound defects reported in Mpl−/− HSCs5, 6, we do not think that the negative population in our results represents cells not expressing Mpl at all. Rather, they might express very low levels of Mpl, which is below the sensitivity of current technologies to detect phosphorylated signaling proteins and Mpl surface expression. Nonetheless, our data reveal significant heterogeneity within HSCs and MPPs in Mpl expression and corresponding TPO signaling. Similarly as TPO signaling, GM-CSF signaling in HSCs, MPPs, and LK cells (enriched for myeloid progenitors) also highly correlates with its known expression patterns in different hematopoietic cells19.
We show that LK cells (enriched for myeloid progenitors) stimulated by SCF show an increased magnitude and prolonged activation of ERK1/2 compared to HSCs and MPPs (Fig. 5). This finding is surprising but consistent with the known function of the MEK/ERK pathway in regulating cell proliferation and differentiation23. In general, higher magnitude of ERK activation promotes cell proliferation and its prolonged activation links to cell differentiation. Because LK cells are enriched for more downstream myeloid progenitors, it is conceivable that cytokine-evoked ERK1/2 activation is stronger and lasts longer than that in more quiescent and more primitive HSCs and MPPs. Nonetheless, our result highlights the importance of SCF signaling throughout hematopoiesis, which is highly consistent with the profound hematopoietic defects identified in HSCs and progenitors deficient for cKit4.
Summary
In conclusion, using the HSC phospho-flow method we developed, we studied multiple cytokine signaling in defined HSCs, MPPs, and heterogeneous LK cells (Figure S4). HSCs display a characteristic TPO and GM-CSF signaling signature distinct from MPPs and LK cells. In contrast, SCF-evoked ERK1/2 activation is comparable in HSCs and MPPs but much stronger and last longer in LK cells. The information obtained at the homeostasis stage serves as a foundation for future signaling studies in HSCs and progenitor cells under various pathological conditions.
Supplementary Material
Grant acknowledgements
This work was supported by a Howard Temin Award and a R01 grant R01CA152108 from the National Cancer Institute, a Shaw Scientist Award from the Greater Milwaukee Foundation, an ASH Scholar Award from the American Society of Hematology, a V Scholar Award from the V Foundation for Cancer Research, and an Investigator Initiated Grant from UWCCC to J.Z.. This work was also supported in part by NIH/NCI P30 CA014520--UW Comprehensive Cancer Center Support. In addition, this work was supported by NIH grants R01HL095675, R01HL110806, and R21HL102688, a New Investigator Award from the Myeloproliferative Neoplasm (MPN) Research Foundation and Gabrielle's Angel Foundation for Cancer Research to W.T. and a Postdoctoral Fellowship from the American Heart Association (AHA) to J.J..
Acknowledgements We are grateful to Drs. Emery Bresnick, Qiang Chang, and Lily Huang for helpful discussion and critical comments on the manuscript. We would like to thank the University of Wisconsin Carbone Comprehensive Cancer Center (UWCCC) for use of its Shared Services to complete this research.
Footnotes
Authorship Juan Du: Conception and design, Collection and assembly of data, Data analysis and interpretation, Manuscript writing
Jinyong Wang: Conception and design, Collection and assembly of data, Data analysis and interpretation, Manuscript writing
Guangyao Kong: Collection and assembly of data, Data analysis and interpretation
Jing Jiang: Collection and assembly of data, Data analysis and interpretation
Jingfang Zhang: Collection and assembly of data, Data analysis and interpretation
Yangang Liu: Collection and assembly of data, Data analysis and interpretation
Wei Tong: Conception and design, Manuscript writing, Final approval of manuscript
Jing Zhang: Conception and design, Manuscript writing, Final approval of manuscript
We declare no competing financial interests.
References
- 1.Orkin SH, Zon LI. Hematopoiesis: an evolving paradigm for stem cell biology. Cell. 2008;132:631–644. doi: 10.1016/j.cell.2008.01.025. [DOI] [PMC free article] [PubMed] [Google Scholar]
- 2.Kiel MJ, Yilmaz OH, Iwashita T, et al. SLAM family receptors distinguish hematopoietic stem and progenitor cells and reveal endothelial niches for stem cells. Cell. 2005;121:1109–1121. doi: 10.1016/j.cell.2005.05.026. [DOI] [PubMed] [Google Scholar]
- 3.Kiel MJ, He S, Ashkenazi R, et al. Haematopoietic stem cells do not asymmetrically segregate chromosomes or retain BrdU. Nature. 2007;449:238–242. doi: 10.1038/nature06115. [DOI] [PMC free article] [PubMed] [Google Scholar]
- 4.Wilson A, Trumpp A. Bone-marrow haematopoietic-stem-cell niches. Nat Rev Immunol. 2006;6:93–106. doi: 10.1038/nri1779. [DOI] [PubMed] [Google Scholar]
- 5.Kimura S, Roberts AW, Metcalf D, et al. Hematopoietic stem cell deficiencies in mice lacking c-Mpl, the receptor for thrombopoietin. Proc Natl Acad Sci U S A. 1998;95:1195–1200. doi: 10.1073/pnas.95.3.1195. [DOI] [PMC free article] [PubMed] [Google Scholar]
- 6.Solar GP, Kerr WG, Zeigler FC, et al. Role of c-mpl in early hematopoiesis. Blood. 1998;92:4–10. [PubMed] [Google Scholar]
- 7.Fox N, Priestley G, Papayannopoulou T, et al. Thrombopoietin expands hematopoietic stem cells after transplantation. J Clin Invest. 2002;110:389–394. doi: 10.1172/JCI15430. [DOI] [PMC free article] [PubMed] [Google Scholar]
- 8.Qian H, Buza-Vidas N, Hyland CD, et al. Critical role of thrombopoietin in maintaining adult quiescent hematopoietic stem cells. Cell Stem Cell. 2007;1:671–684. doi: 10.1016/j.stem.2007.10.008. [DOI] [PubMed] [Google Scholar]
- 9.Yoshihara H, Arai F, Hosokawa K, et al. Thrombopoietin/MPL signaling regulates hematopoietic stem cell quiescence and interaction with the osteoblastic niche. Cell Stem Cell. 2007;1:685–697. doi: 10.1016/j.stem.2007.10.020. [DOI] [PubMed] [Google Scholar]
- 10.Chou S, Chu P, Hwang W, et al. Expansion of human cord blood hematopoietic stem cells for transplantation. Cell Stem Cell. 2010;7:427–428. doi: 10.1016/j.stem.2010.09.001. [DOI] [PMC free article] [PubMed] [Google Scholar]
- 11.Butler JM, Kobayashi H, Rafii S. Instructive role of the vascular niche in promoting tumour growth and tissue repair by angiocrine factors. Nat Rev Cancer. 2010;10:138–146. doi: 10.1038/nrc2791. [DOI] [PMC free article] [PubMed] [Google Scholar]
- 12.Irish JM, Hovland R, Krutzik PO, et al. Single cell profiling of potentiated phospho-protein networks in cancer cells. Cell. 2004;118:217–228. doi: 10.1016/j.cell.2004.06.028. [DOI] [PubMed] [Google Scholar]
- 13.Van Meter ME, Diaz-Flores E, Archard JA, et al. K-RasG12D expression induces hyperproliferation and aberrant signaling in primary hematopoietic stem/progenitor cells. Blood. 2007;109:3945–3952. doi: 10.1182/blood-2006-09-047530. [DOI] [PMC free article] [PubMed] [Google Scholar]
- 14.Wang JY, Liu YG, Li ZY, et al. Endogenous oncogenic Nras mutation leads to aberrant GM-CSF signaling in granulocytic/monocytic precursors in a murine model of chronic myelomonocytic leukemia. Blood. 2010;116:5991–6002. doi: 10.1182/blood-2010-04-281527. [DOI] [PMC free article] [PubMed] [Google Scholar]
- 15.Rathinam C, Thien CB, Langdon WY, et al. The E3 ubiquitin ligase c-Cbl restricts development and functions of hematopoietic stem cells. Genes Dev. 2008;22:992–997. doi: 10.1101/gad.1651408. [DOI] [PMC free article] [PubMed] [Google Scholar]
- 16.Essers MA, Offner S, Blanco-Bose WE, et al. IFNalpha activates dormant haematopoietic stem cells in vivo. Nature. 2009;458:904–908. doi: 10.1038/nature07815. [DOI] [PubMed] [Google Scholar]
- 17.Wang JY, Liu YG, Li ZY, et al. Endogenous oncogenic Nras mutation initiates hematopoietic malignancies in a dose- and cell type-dependent manner. Blood. 2011;118:368–379. doi: 10.1182/blood-2010-12-326058. [DOI] [PMC free article] [PubMed] [Google Scholar]
- 18.Robb L, Drinkwater CC, Metcalf D, et al. Hematopoietic and lung abnormalities in mice with a null mutation of the common beta subunit of the receptors for granulocyte-macrophage colony-stimulating factor and interleukins 3 and 5. Proc Natl Acad Sci U S A. 1995;92:9565–9569. doi: 10.1073/pnas.92.21.9565. [DOI] [PMC free article] [PubMed] [Google Scholar]
- 19.McKinstry WJ, Li CL, Rasko JE, et al. Cytokine receptor expression on hematopoietic stem and progenitor cells. Blood. 1997;89:65–71. [PubMed] [Google Scholar]
- 20.Protin U, Schweighoffer T, Jochum W, et al. CD44-deficient mice develop normally with changes in subpopulations and recirculation of lymphocyte subsets. J Immunol. 1999;163:4917–4923. [PubMed] [Google Scholar]
- 21.Bersenev A, Wu C, Balcerek J, et al. Lnk controls mouse hematopoietic stem cell self-renewal and quiescence through direct interactions with JAK2. J Clin Invest. 2008;118:2832–2844. doi: 10.1172/JCI35808. [DOI] [PMC free article] [PubMed] [Google Scholar]
- 22.Tong W, Ibarra YM, Lodish HF. Signals emanating from the membrane proximal region of the thrombopoietin receptor (mpl) support hematopoietic stem cell self-renewal. Exp Hematol. 2007;35:1447–1455. doi: 10.1016/j.exphem.2007.05.010. [DOI] [PMC free article] [PubMed] [Google Scholar]
- 23.Orford KW, Scadden DT. Deconstructing stem cell self-renewal: genetic insights into cell-cycle regulation. Nat Rev Genet. 2008;9:115–128. doi: 10.1038/nrg2269. [DOI] [PubMed] [Google Scholar]
Associated Data
This section collects any data citations, data availability statements, or supplementary materials included in this article.


